11email: mk@mpifr-bonn.mpg.de
The innermost region of AGN tori: implications from the HST/NICMOS Type 1 point sources and near-IR reverberation
Spatially resolving the innermost region of the putative torus-like structure in an active galactic nucleus (AGN) is one of the main goals of its high-spatial-resolution studies. This could be done in the near-IR observations of Type 1 AGNs where we see directly the hottest dust grains in the torus. We discuss two critical issues in such studies. One is the possible contribution from the central putative accretion disk (the near-IR part of the big blue bump emission), which should be taken into account for the torus measurements. The other is the expected size of the inner boundary of the torus, essential for the feasibility of spatially resolving the region.
Firstly, we examine the nuclear near-IR point sources in the HST/NICMOS images of nearby Type 1 AGNs, to evaluate the accretion disk contribution. After the subtraction of the host bulge flux through two-dimensional decompositions, we show that near-IR colors of the point sources appear quite interpretable simply as a composite of a black-body-like spectrum and a relatively blue distinct component as expected for a torus and an accretion disk in the near-IR, respectively. The near-IR colors of our radiative transfer models for clumpy tori also support this simple two-component interpretation. The observed near-IR colors for the available sample suggest a fractional accretion disk contribution of 25% or less at 2.2 m.
Secondly, we show that the innermost torus radii as indicated by the recent near-IR reverberation measurements are systematically smaller by a factor of 3 than the predicted dust sublimation radius with a reasonable assumption for graphite grains of sublimation temperature 1500 K and size 0.05 m in radius. The discrepancy might indicate a much higher sublimation temperature or a typical grain size being much larger in the innermost tori, though the former case appears to be disfavored by the observed colors of the HST point sources studied above. Alternatively, the central engine radiation might be significantly anisotropic. The near-IR interferometry with a baseline of 100 m should be able to provide the important, independent size measurements for the innermost torus region, based on the low fractional contribution from the accretion disk obtained above.
Key Words.:
Galaxies: active, Techniques: interferometric1 Introduction
The emission from active galactic nuclei (AGN) in the near- and mid-infrared (IR) wavelengths is generally thought to be dominated by the thermal emission from dust grains in the putative torus-like structure surrounding the broad emission line region and the central engine. One of the main goals of high spatial resolution AGN studies is to resolve the innermost region of these tori. The innermost structure in itself is physically interesting, but also the region could well be closely related to and involved in the feeding process of the central engine. Spatially resolving the innermost torus could be done in Type 1 AGNs where our line of sight is more or less close to the symmetry axis direction of the torus and so the innermost region is directly seen. While IR interferometric observations have resolved at least some part of this torus structure in nearby AGNs (Wittkowski et al. 1998, Weinberger et al. 1999, Swain et al. 2003, Weigelt et al. 2004, and Wittkowski et al. 2004 in the near-IR; Jaffe et al. 2004 and Tristram et al. 2007 in the mid-IR; see below for more discussions), most of the results obtained so far are for Type 2 objects where the symmetry axis of the torus is thought to have large inclinations to our line of sight and so the innermost region of the torus is not directly seen.
The inner boundary of the torus is thought to be set by dust sublimation, and since the dust sublimation temperature is thought to be roughly 1500K, the innermost region is mainly emitting in the near-IR. However, in Type 1s, some sizable part of the near-IR emission comes from the central engine, which is also directly seen along our line of sight, and this will affect the measurement of the innermost region of the torus. This fractional contribution is one of the key quantities in high spatial resolution studies of the innermost tori. In this paper, we try to quantify the contribution and its effect on the interferometric observations, based on the high spatial resolution HST/NICMOS images of nearby type 1 AGNs which minimizes the effect of host galaxies.
Another key quantity is the expected innermost size of the torus. A theoretical prediction of dust sublimation radii by Barvainis (1987) is quite a robust estimation of the inner torus boundary size. On the other hand, this innermost radii can observationally be probed by time-lag measurements between the UV/optical and near-IR. The time-lag radii have recently been shown to be proportional to the square root of the optical luminosity (Suganuma et al. 2006), which is consistent with the prediction for dust sublimation radii. Therefore, a direct comparison between these two radii should be very important. We aim to discuss the implications from the comparison, and evaluate the current expectation for near-IR interferometry based on the expected innermost torus size.
In section 2, we will describe the available HST/NICMOS sample and the measurement of the point source fluxes at multiple wavebands through two-dimensional decomposition. In section 3, these point-source fluxes will be compared with simple blackbody colors and also with the colors of more realistic clumpy torus models, to evaluate the accretion disk contribution. In section 4, we examine the expected innermost size of the torus. Based on these discussions, we aim to clarify the current expectation for the interferometry of the innermost torus region in section 5. We summarize our discussions in section 6. When needed, cosmological parameters are assumed as km s-1 Mpc-1, , and throughout this paper.
|
-
a
Calcualated from the radial velocities corrected with a CMB dipole model from NED.
2 The HST/NICMOS images and point source flux
2.1 The sample and data reduction
We have searched the HST archive for NICMOS observations of Type 1 AGNs which are in the AGN catalog compiled by Véron-Cetty & Véron (2006) with spectral classifications S1.0S1.5 and redshift up to 0.2, and have simultaneous observations at or bands. Filters are mostly F110W, F160W, and F222M, with a central wavelength of 1.12, 1.60 and 2.22 m, respectively. We further excluded radio-loud objects to avoid any possible contribution in the near-IR from synchrotron components. Table 1 lists the objects found. For this sample, the physical linear size corresponding to the FWHM of the NICMOS Point Spread Function (PSF) at 2.2 m is less than 600 pc (see Table 1). The data were reduced and calibrated using the standard pipeline software CALNICA and CALNICB with the most recent reference files as of early 2007. The detector readout mode was MULTIACCUM. In this mode, each pixel in NICMOS detectors is read multiple times non-destructively during a single integration. The final count rate at each pixel is calculated in CALNICA by a least squares fit to the accumulating counts versus exposure times at each readout. This uses only non-saturated periods during the course of the single exposure for each pixel. Therefore, the brightest nuclear pixels have effectively short exposure times and do not suffer from saturation.
2.2 Nuclear flux measurements
We implemented two-dimensional decompositions for the central 4 4 arcsec2 of each image using our software written in IDL. We used a model PSF generated by TinyTim (see Krist et al. 1998) for the nuclear point source and a model bulge component for an underlying host galaxy, convolved with the same model PSF, assuming de Vaucouleurs profile. We then measured the total flux of the PSF component.
Generally, the point sources in NICMOS images can be well modeled by the TinyTim synthetic PSFs, but detailed PSF shapes depend on several factors, which have been investigated substantially by Krist et al. (1998) and Suchkov & Krist (1998). To roughly estimate the discrepancies between synthetic and observed PSFs, we compared synthetic PSFs with the NICMOS images of the Galactic stars SA 107-626 and SA 107-627 taken with NIC1/NIC2 cameras with a few filters. These have been observed for the PSF measurements by Kukula et al. (2001; see also Veilleux et al. 2006 for notes on the latter star). For each stellar observation, we compared radial profiles of three images: (A) an absolute difference image between the synthetic and observed PSF with matched total counts; (B) a ’standard-deviation’ image for the observed PSF, where each pixel consists of the standard deviation of the 3 3 pixel region centered on that pixel; (C) a statistical error estimate image for the observed PSF from the pipeline. In the outer region, the pixel values of the image B approaches those of the image C as expected. In the inner region close to the PSF center, is much larger than , since the former rather represents the extent of small spatial scale structures of the PSF on top of the statistical photon noise. We found that the overall profile of the difference image A is roughly reproduced by taking the geometric mean of image B and C, i.e. . Thus the average deviation of the observed image from the model PSF can approximately be described by this .
This would also be applicable to our AGN images since a relatively smooth, underlying host component would not contribute much to the image except for its photon noise. Therefore we adopted this image as an estimate for the average deviation of each observed AGN image from the model. In the two-dimensional fit, we weighted each pixel by , after masking out obvious distinct structures in the host galaxies such as starburst knots in a few cases (e.g. NGC 7469). The image can easily be generated from the observed image and the image from the pipeline software. The radial profile of the image of the resulting fits turned out to be rather flat, with values being roughly of order unity in most cases, indicating adequate weighting and fit. The reduced of the fits are thus quite close to unity in most cases.
To estimate the errors in our PSF flux measurements, we compared the PSF flux recovered by the fits for the Galactic stars above with those from a synthetic aperture photometry with aperture corrections. We found that the former reproduces the latter within 5%. In the fits for the AGN images of our sample, we also measured the residual flux within a 2 arcsec diameter aperture after the subtraction of the fitted PSF and host components, and found it on average to be less than 5% of the measured PSF flux. Therefore we assume 5% uncertainty in our PSF flux measurements. This has been found to be typically several times larger than the formal statistical error given by the fit.
The results of the flux measurements are summarized in Table 1. The measured fraction of the PSF component within a 2 arcsec diameter aperture for each object is also tabulated. Similar measurements have been made by Alonso-Herrero et al. (2001) for 5 objects in the list, though only two of them have simultaneous observations, for which we have confirmed approximate consistency of the results. Scoville et al. (2000) studied the same NICMOS colors of ultra luminous infrared galaxies including a few objects in our sample, by measuring the nuclear fluxes within a 1.1 arcsec diameter aperture with the adjacent background subtracted. Our two-dimensional decomposition measurements for the common objects are roughly in agreement with their measurements.
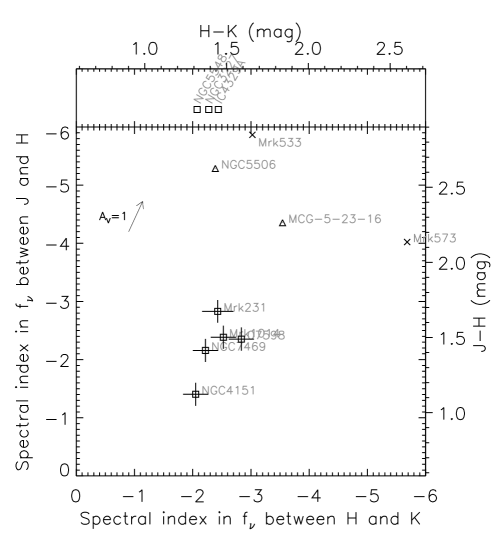
The observed and colors for these Type 1 objects are plotted in Fig.1 in squares after a small correction for the Galactic extinction using from NED. The objects only with a color are plotted in the small top panel. For comparison, we have also plotted the same colors of the nuclear point sources in several nearby Type 2 or intermediate-type objects (crosses and triangles, respectively; the latters are designated as S1i in the catalog by Véron-Cetty & Véron, meaning that broad lines are detected in the IR). These are at and the fluxes have been deduced by Alonso-Herrero et al. (2001) using both ground-based and HST images. The colors of the Type 1 objects are concentrated in a relatively narrow range, and generally much bluer than those of the Type 2 and intermediate-type objects.
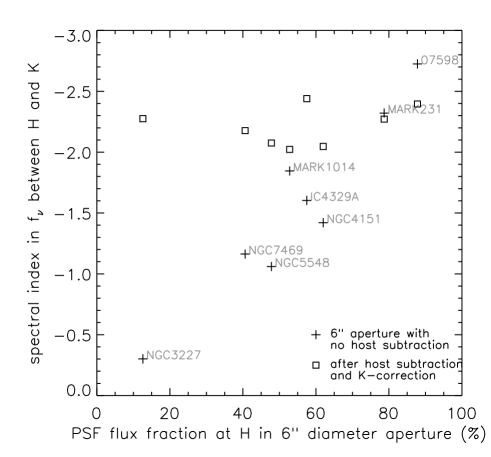
To show the effect of the host subtraction (through the two-dimensional PSF+host decomposition) on the color measurements as compared with large-aperture measurements, we plotted the color versus the PSF flux fraction at band with a synthetic aperture of 6 arcsec diameter in Fig.2. The color changes significantly as a function of the PSF fraction. For comparison, we also plotted the color of the PSF flux from the PSF+host decomposition (the colors are the same as the colors plotted in Fig.3, i.e. with a K-correction for objects with J/H/K measurements; see section 3.1 below). As clearly seen, the effect of the host subtraction using these high resolution images is quite significant in the majority of the objects.
3 The spectral components of the near-IR point sources
3.1 Hot dust emission and contribution from the putative accretion disk
Type 1 objects are thought to have low inclination angles, providing a direct view of the central engine and the broad line region. If we assume that the stellar light from the host galaxy is well subtracted by the PSF+host decomposition, the spectrum of the unresolved source in the near-IR wavelengths is expected to be composed of essentially two components: (i) the thermal emission from hot dust grains in the innermost torus, nearly at the sublimation temperature; (ii) the central engine emission, i.e. the near-IR tail of the so-called big blue bump emission from the putative accretion disk. (We will discuss other possible components below.)
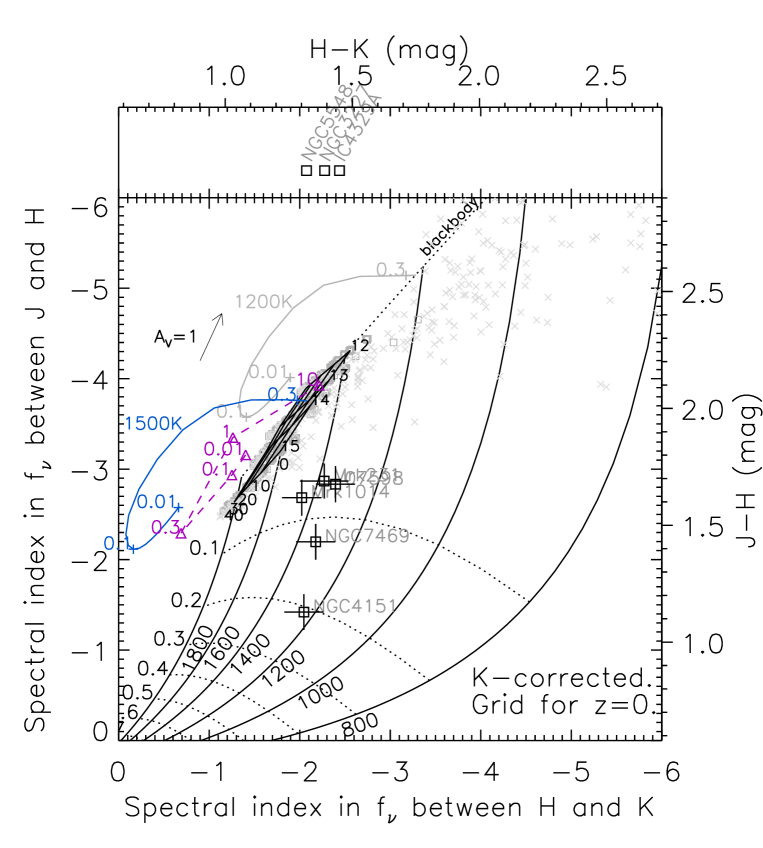
If we simply assume the near-IR spectrum of dust grains to be of a blackbody with a single temperature , and that of an accretion disk to be of a power-law form which is a long wavelength limit of simple multi-temperature blackbody disks (Shakura & Sunyaev 1973), then the spectral shape in the rest frame is fixed for a given and a given fraction of the accretion disk contribution at a certain wavelength. We parameterize the latter as the disk fraction at the rest wavelength of 2.2 m and denote it as . These and can be calculated from the observed set of and colors and redshift for each object. Equivalently, we can produce a grid of and on the and color plane for , and plot the and colors of each object with K-corrections assuming this two-component spectrum. Such a color-color diagram is shown in Fig.3 for the Type 1 objects. Note that such K-corrections are noticeable essentially only for two objects in the plot. Fig.3 shows that the observed colors follow a relatively well-defined trend: they are along a locus of a roughly similar temperature 12001500K for the hot dust component, with a small range in of 525%. The corresponding accretion disk fractions at and are much higher, 0.10.5 and 0.40.9, respectively.
3.2 The near-IR colors of clumpy torus models
To estimate the extent of the difference from simple black-body spectra, we have simulated the near-IR colors of more realistic AGN tori using our clumpy torus model (Hönig et al. 2006; Beckert & Duschl 2004). We concentrate on Type 1 cases where inclinations are smaller than the half opening angle of the torus and thus our line of sight toward the central engine is free of any model cloud.
We calculated spectra with a dust sublimation temperature of 12001500K and a radial distribution of the number of clouds where . For each set of model parameters, we calculated 10 random arrangements of cloud placements with a fixed opening angle, or more precisely, a fixed ratio of scale height to radius corresponding to an average half opening angle of 40° (see Hönig et al. 2006 for more details). We measured colors for the inclination angles free of clouds along the line of sight. These colors are plotted in small gray squares in Fig.3. Overlayed on these gray square points is a small grid of K, ° with =, which shows the averaged colors of the 10 random arrangements for each set. The comparison of this single-radial-index grid with the gray square points (which include the indices from to ) shows that the radial-index generally has a smaller effect on colors for this half-opening angle case with Type 1 inclinations. As the inclination increases from 0° to 40°, the colors become slightly bluer since the fractional contribution from the hotter side of the innermost clouds becomes more significant. This trend holds until the inclination becomes close to the half opening angle of the torus, when the colors start to become much redder. For comparison we also have plotted the model colors of Type 2 or intermediate-type inclinations (°) for which one or more clouds are along the line of sight, as small gray crosses. They generally show much redder colors and much larger scatters than those of Type 1 cases.
We also have calculated the colors of optically-thin emission from dust grains with various sizes (radii from 0.001 to 10 m) for two temperatures, 1200 and 1500K, using absorption efficiencies calculated by Draine & Lee (1984) and Laor & Draine (1993). The color tracks for graphite grains are plotted in Fig.3 in gray/blue curves, where colors for =0.01, 0.1, 0.3 m are marked as plus signs. The colors of silicate grains are shown only for =1500K and =0.01, 0.1, 0.3, 1, and 10 m cases in triangles for clarity, and they are connected with gray/purple dashed lines. As expected, the colors approach the blackbody colors of the same temperature as the grain size becomes larger. The curves for graphite grains are truncated at =0.35 m, beyond which the colors are almost the same as that of a blackbody.
The spectra of our clumpy tori essentially corresponds to the case of =0.05 m for 1:1 mixture of graphite and silicate grains (Hönig et al. 2006). Then the near-IR colors of the clumpy tori with a given can be seen as sitting roughly between the blackbody and the optically-thin case (close to graphite grains with =0.05 m, due to a much larger absorption efficiency of graphites than that of silicates in near-IR) with . In more detail, the overall colors of the clumpy tori with a given are roughly the same as the optically-thin color with , because the wavelength region is dominated by the emission from the hottest grains. On the other hand, the colors are slightly redder, somewhere between the optically-thin and blackbody case, since it has some contribution from slightly cooler grains at -band. Because of this relatively simple behavior, our results can easily be extrapolated toward slightly higher and lower cases, and the results for a particular grain size can also be roughly inferred. If, for example, the grains in the innermost torus is dominated by those with much larger than 0.05 m, which we actually argue in the next section, the torus near-IR color grid shown in Fig.3 will slightly shift to a redder side (both in and ), much closer to the corresponding blackbody colors.
In all cases, the overall colors of Type 1 torus models stay quite close to the locus of blackbody colors. Therefore, the above estimate of the fraction of the accretion disk contribution, %, essentially stays the same.
The observed colors of the HST point sources constrain the plausible range of at least to some extent. The colors appear to disfavor the cases with much higher than 1500K. This would be true even in the large-grain case described above.
3.3 The near-IR spectral shape of the big blue bump
In the estimation above, we have assumed the near-IR spectral shape of the big blue bump (BBB) as . The near-IR part of the BBB is still quite unknown, simply because we usually cannot measure it due to the strong dominance of the thermal dust emission from the torus. However, there are a few pieces of observational evidence that the near-IR part of the BBB is quite blue, as blue as the long wavelength limit of a non-truncated standard accretion disk, , which is much bluer than the observed optical BBB shape (e.g. ; Neugebauer et al. 1987; Francis et al. 1991). One piece of evidence is from a near-IR polarization study of one quasar by Kishimoto et al. (2005). They show that the near-IR polarized flux spectrum, which is argued to represent the intrinsic shape of the near-IR BBB, is of the form . Another is from the reverberation measurements between the optical and near-IR for one nearby Seyfert 1 galaxy by Tomita et al. (2006). They show that the putative disk component has a spectral form of . Of course, these are still far from measuring the spectral shape for the whole population, but pointing towards a color bluer than the observed optical BBB shape. The detailed form of the disk component essentially does not affect our conclusions, as long as it remains relatively blue. The disk component color is the convergence point of the grid in Fig.3 (lower left, outside of the figure), and if the color is bluer than e.g. the observed optical BBB shape cited above, which is quite likely, an estimate for will not change significantly.
3.4 Other components
One potential contamination by an additional component in the near-IR would be a synchrotron emission from radio jets, but this is quite unlikely since we have restricted our objects to radio-quiet ones. On the other hand, it is possible that the NICMOS PSF fluxes have some contribution from a nuclear young stellar cluster on top of the host galaxy profile extrapolated from larger scales. In fact, recent high-spatial-resolution integral field spectroscopic studies (Davies et al. 2007 and references therein) indicate the existence of such young stars with estimated ages of 10-300 Myr in the nuclear vicinity of nearby Seyfert galaxies, including a few objects in our sample (NGC 3227, NGC 7469, Mrk 231). However its effect on our estimation of is expected to be quite small based on the following reasons. (1) Its luminosity contributes only a few % in 10-100pc scales in most of the Type 1 objects in their studies. (2) The near-IR colors of these young stars are much bluer – the spectral index for and is and , respectively (Scoville et al. 2000, Fig.5) – than the observed colors of the NICMOS point sources studied here. Even if these stars are significantly reddened by internal dust grains, which could be the case for a few luminous infrared galaxies in our sample (Mrk 231, IRAS07598+6508, Mrk 1014), the reddened color (, ; Scoville et al. 2000) is still bluer than the observed point-source colors at least in . Therefore, the subtraction of these young stellar component can only make the remaining components redder, which might even decrease the estimation of , not increase.
A possible foreground reddening of the nuclear point source light can lead to an underestimation of (Fig.3). At least an approximate upper limit on the foreground reddening can be obtained from the broad line ratios. No significant reddening in the ratios () has been obtained for NGC4151, NGC5548, NGC7469 (Lacy et al 1982) and Mrk1014 (Wu et al. 1998). For the rest of the sample, some reddening is present: for Mrk 231 (Lacy et al. 1982), for IRAS07598+6508 (Hines & Wills 1995), and for IC4329A (due to an edge-on dust lane, Winkler et al. 1992 and references therein). The estimation of for these objects slightly increases accordingly, but is still consistent with %.
Therefore, we conclude that, at least for the sample studied here, the fractional contribution from an accretion disk at K-band is less than 25%. Similar conclusions have been obtained from a detailed analysis of the near-IR reverberation data for a Seyfert 1 galaxy (Tomita et al. 2006) and from detailed near-IR spectroscopy of quasars (Kobayashi et al. 1993), suggesting the validity of our simple approach.
4 The inner boundary of AGN tori
In this section we focus on the expected physical and angular size of the torus inner boundary, which is another critical issue in the high spatial resolution studies of AGN tori. We first summarize the dust sublimation radius in physical and angular size, and compare it with the time-lag radius from the near-IR reverberation measurements in the literature, and then discuss the implications.
4.1 Dust sublimation radius
The inner boundary of tori is believed to be set by the sublimation of dust grains. A theoretical calculation of dust sublimation radius by Barvainis (1987) is a well-referenced, quite robust estimation of this inner boundary, which is given as
| (1) |
In this calculation, Barvainis adopted absorption efficiencies for graphite grains, since they have higher sublimation temperatures than silicate grains and thus are supposed to survive in regions further in. The value of =1500K is also adopted by Barvainis (1987). For a plausible range of ambient gas pressures, for graphite and silicate grains are estimated to be 15001900 K and 10001400 K, respectively (e.g. Salpeter 1977, Huffman 1977, and references therein; Phinney 1989; Guhathakurta & Draine 1989; Laor & Draine 1993). We explicitly included the grain radial size of 0.05 m assumed by Barvainis (1987), which sits in the middle of the inferred size distribution for interstellar graphite grains (Mathis, Rumpl & Nordsieck 1977). The approximate proportionality comes from the absorption efficiency of a dust grain being roughly proportional to its radius at a certain wavelength in the near-IR (Draine & Lee 1984). is the UV-optical luminosity of the central engine, or more precisely, the integration of the central engine luminosity weighted by of a dust grain in question.
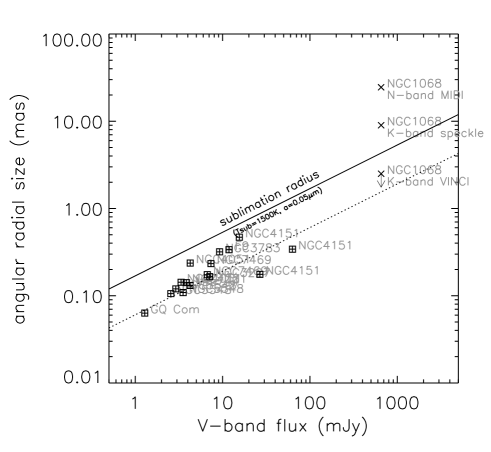
We can write a corresponding angular radius in milliarcsecond (mas) as
| (2) | |||||
for cases. Here mJy approximately corresponds to the V-band flux of the nucleus of the brightest Seyfert 1 galaxy NGC 4151. is roughly unity for a generic AGN spectral energy distribution (SED; Elvis et al. 1994; Sanders et al. 1989). Note that the angular size is simply proportional to the square root of observed flux for cases.
4.2 The near-IR reverberation radius
The variability in the near-IR flux of several nearby Seyfert 1 galaxies has been observed to have a delay from the UV/optical variability (Suganuma et al. 2006 and references therein), and the time lags in these objects have been shown to be consistent with being proportional to where is the optical luminosity (Suganuma et al. 2006). The light travel distance for the time lag at K-band, , has been interpreted to be the distance from the compact UV/optical source to the K-band emitting region, which is thought to be the innermost region of the torus where dust grains are nearly at their sublimation temperature.
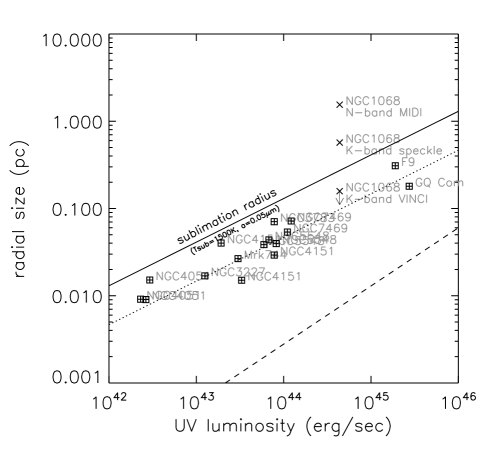
The proportionality is in a nice agreement with the proportionality for a generic AGN SED. However the values suggested by the time-lag radii and by (with =1500K and =0.05 m) are actually quite different. Fig.4 compares and the observed in physical linear scale as a function of , and Fig.5 in angular scale as a function of optical V-band flux . A fit to the time-lag data points given by Suganuma et al. (2006) can be written as
| (3) |
and the corresponding angular radius for cases is given as
| (4) |
These fits are plotted in dotted lines in Fig.4 and 5. As can be seen clearly, the time-lag radii are systematically smaller than by a factor of 3.
4.3 Implications
The case for the time-lag radius to be the radius of the dominant K-band emitting region, which is thought to be the innermost torus, seems likely, since the reverberation monitorings show that quite a significant fraction of the K-band emission is varying in response to the UV/optical in many Type 1 objects (e.g. Glass 2004; Minezaki et al. 2004; Suganuma et al. 2006). Some minor part of the factor 3 might be from a geometrically shortened delay, if the directly illuminated region is only the surface or skin-like region of the inner torus with a relatively small opening angle. However, this would probably not be the dominant factor, as long as the most dominant emission region is still roughly in the equatorial plane of the torus.
Then one implication might be that the sublimation temperature is much higher than K, and/or the typical grain radius is much larger than 0.05 m. In fact, this has been inferred for some individual time-lag cases (e.g. Clavel et al. 1989, Barvainis 1992 for Fairall 9; Sitko et al. 1993 for GQ Com). However, as we noted in section 3.2, sublimation temperatures much higher than 1500 K appear to be disfavored by the observed near-IR colors of the HST point sources (Fig.3). In this case, the above comparison of and might simply suggest a dominance of large grains in the innermost region, and this would systematically be true (at least among these reverberation objects), not just in some individual objects. The sublimation radius as a function of and grain size is well illustrated graphically in Fig.8 of Laor & Draine (1993). If the sublimation temperature is 1500 K, the typical grain size in radius would be 0.2 m to have go down to match . This is quite large enough to be rather close to the blackbody limit (i.e. a larger size will not change too much further), but still in the inferred size range for Galactic interstellar graphite grains (e.g. Mathis et al. 1977). Note that a dominance of large grains in AGN tori has been suggested and discussed on different grounds (e.g. Maiolino et al. 2001a,b; Gaskell et al. 2004).
Another possibility is an intrinsic anisotropy of the central engine radiation, with a factor of 10 reduction from a polar to equatorial direction, i.e. much less luminosity toward the torus (equatorial) direction than to our (polar) line of sight. This might be consistent with accretion disks where we expect the effects of projected area and limb darkening (e.g. Netzer 1985). Alternatively there might be a significant extinction, i.e. absorption and/or scattering, of the central engine radiation before reaching the torus. However, its consequences has to be carefully considered. In any case, the systematic difference between the time-lag radii and above indicates that dust properties and/or anisotropy/extinction in the innermost region is somehow similar in these various objects.
5 The near-IR interferometry of Type 1 nuclei
Small angular sizes of AGN tori require IR interferometric observations to spatially resolve the structure, and some structures actually have been resolved in a few objects with interferometry both in the near-IR (Wittkowski et al. 1998, Weinberger et al. 1999, Weigelt et al. 2004, Wittkowski et al. 2004 for NGC 1068; Swain et al. 2003 for NGC 4151) and mid-IR (Jaffe et al. 2004 for NGC 1068; Tristram et al. 2007 for Circinus). Based on the discussion of the accretion disk flux fraction and the angular size of the torus inner boundary in the previous sections above, we discuss the current expectations for the near-IR interferometric studies of the innermost region of AGN tori, and also discuss the existing measurements.
5.1 Simulated interferometric observations
For the sample studied in sections 2 and 3, the fractional contribution at K-band from a putative accretion disk is suggested to be only 25% or less, so that the point-source K-band flux is essentially dominated by the flux from the torus. On the other hand, the physical size of the near-IR emitting region in the accretion disk is expected to be much smaller than the torus inner boundary. Assuming a simple geometrically-thin optically-thick multi-temperature blackbody disk (Shakura & Sunyaev 1973), we can at least formally estimate the K-band emitting radius as a radius where the disk temperature goes down to 1500K. We obtain
| (5) |
where and are the radiative efficiency (the luminosity ; is the mass accretion rate) and Eddington luminosity, respectively. This is shown in Fig.4 as a dashed line. The effective size of the K-band emitting region might be even smaller due to the truncation of the outer part of the disk by self-gravity (e.g. Goodman 2003).
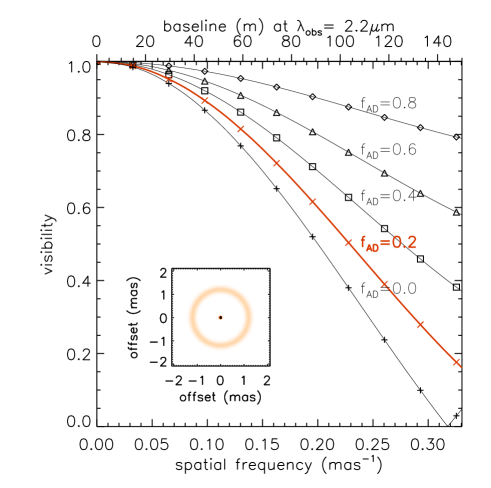
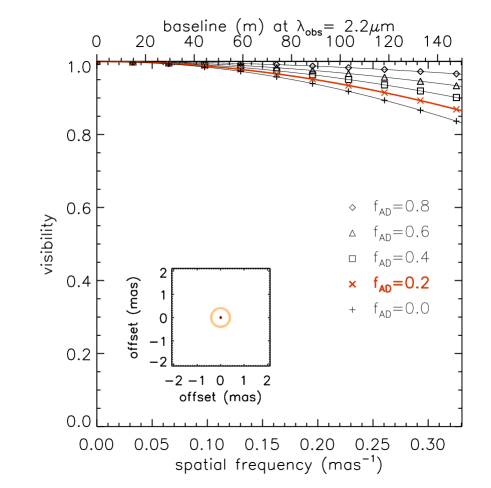
Fig.6 and 7 show the simulation of interferometric observations for a simple case of a ring-like torus plus a much more compact source, corresponding to an accretion disk, with various fractional flux contributions . Fig.6 is for a ring radius of 1.2 mas corresponding to the angular size in Eq. 2 ( case), and Fig.7 is for 0.4 mas in Eq. 4 ( case). Here, the FWHM of the ring is set to 1/5 of the ring radius , but the results for the spatial frequency range shown in these Figures essentially do not change as long as .
The model image (shown in the insets), or the surface brightness distribution, can apparently look dominated by the point source even for an case, simply because of the small emitting size of the point source. However, in the Fourier-transformed image, the low spatial frequency part of the Fourier amplitude profile, or visibility profile, is essentially determined by the size of the torus in the cases of low fractional contributions from the disk. Fig.6 and 7 show that, when goes down to 0.2, the profile is already quite similar to the torus-only case (i.e. =0). Simulations with different ring radii show that, if is confined to low values of 0.2, the dispersion of the visibility curves for a given ring radius caused by this small range of is roughly equivalent to the dispersion due to a ring radius change by 10% or less. Therefore, if is confined to low values of 0.2, which seems to be the case at least for the Type 1 objects studied here, the size measurement of the torus in the K-band will not be significantly affected by the accretion disk component.
For both cases with the inner boundary given by (with =1500K and =0.05 m) and by , Fig.6 and 7 show that we can measure the size of the innermost region of the torus with a baseline of 100 m at K-band, which is achievable with existing facilities, although we would need at least a few % accuracy in the visibility measurements for the latter case. Note that the actual visibility for a more realistic torus case would be smaller than the ring case whose radius is equal to the inner boundary radius of the torus, since the intensity distribution would be more extended outwards and not inwards.
5.2 Comparison with existing measurements
For the nucleus of the Seyfert 1 galaxy NGC 4151, Swain et al. (2003) measured a squared visibility of 0.840.06 (or V=0.920.03) at a projected baseline of 83 m in K-band with the Keck interferometer. They favored that most of the K-band emission is coming from an unresolved accretion disk, rather than having a ring-like torus emission as the dominant component. One major reason was that, if a ring-like geometry is assumed, the ring radius implied by the measured visibility is 0.5 mas (0.04 pc) which is much smaller than for =1500K and =0.05 m (1.2 mas or 0.10 pc for NGC 4151; see Fig.5). However, this implied ring radius is essentially consistent with the time-lag radius which is 0.4 mas for NGC4151. The Keck visibility measurement is consistent with the visibility curves in Fig.7 – note that is estimated to be 0.20.25 for NGC 4151 (Fig.3). Therefore the interpretation can drastically change if the time-lag radius represents the actual innermost torus radius.
For the nucleus of the Seyfert 2 galaxy NGC 1068, a few interferometric observation have been carried out. In the mid-IR, a structure has been resolved with VLTI/MIDI (Jaffe et al. 2004) where a Gaussian-modeled111 Note that a elliptical Gaussian is probably an adequate model for Type 2s rather than a ring, and the visibility curves for a Gaussian and a ring are quite similar at the low spatial frequencies before the first visibility minimum (zero) for the latter, if the Gaussian HWHM is equal to the ring radius. radial size perpendicular to the innermost radio jet axis is 25 mas (HWHM; 1.6 pc). At K-band, bispectrum speckle interferometry (Wittkowski et al. 1998; Weigelt et al. 2004) has shown that the visibility goes down quite quickly from unity to 0.7 at short baselines (06 m), with a measured radial size perpendicular to jet being 9 mas (Gaussian HWHM; 0.6 pc). Then the visibility has been measured to go down to 0.4 at a long baseline of 46 m at PA 45° with VLTI/VINCI (Wittkowski et al. 2004). When combined together, a multi-component model is favored for the K-band emission where a significant part is coming from spatial radial scales clearly smaller than 2.5 mas (HWHM; 0.16 pc; see Fig.2 of Wittkowski et al. 2004).
These measurements are plotted in Fig.4 and 5, where the estimation for the intrinsic luminosity is taken from Pier et al. (1994). Although there is inevitable uncertainty in the luminosity estimation, the 2.5 mas upper limit for the compact component from the VINCI measurement appears to fall between (for =1500K and =0.05 m) and the time-lag radius. The former is 4.3 mas for NGC 1068 (0.27 pc), while the latter is 1.6 mas (0.098 pc). The physical interpretation for the compact component critically depends on the correct innermost torus radius to adopt. It might correspond to e.g. the clumpiness of the torus if is (Wittkowski et al. 2004; Hönig et al. 2006). However, if is the time-lag radius, then the small-scale component (2.5 mas) might nicely correspond to the inner boundary region, extincted and partly seen through a clumpy torus.
6 Conclusions
The high-spatial-resolution observations of Type 1 AGN tori in the near-IR involves a contribution from the near-IR part of the big blue bump emission, or the putative accretion disk emission. We quantified this contribution for the nuclear point sources in the HST/NICMOS images of nearby Type 1 AGNs. At least for the available sample, the K-band point-source flux appears to be dominated by a blackbody-like emission from the innermost region of a torus, with only a small contribution from the accretion disk. For the sample studied, the latter fraction is roughly 25% or less. We also used our clumpy torus model to simulate the near-IR torus spectra, and conclude that the estimation for the accretion disk component stays essentially the same.
A theoretical prediction for the inner torus boundary size can be given as a dust sublimation radius. We have shown that the time-lag radius from the near-IR reverberation measurements is systematically smaller by a factor of 3 than the predicted sublimation radius with a reasonable assumption for graphite grains of sublimation temperature 1500 K and size 0.05 m in radius. If the time-lag radius is the correct innermost torus radius, this might indicate a much higher sublimation temperature, but this appears to be disfavored by the observed colors of the HST point sources studied here. In this case, the time-lag radius would suggest a dominance of much larger grains in the innermost torus. Alternatively the central engine radiation might intrinsically be highly anisotropic, or there might be a significant extinction in the equatorial plane between the central engine and torus.
Based on the inferred dominance of the torus emission in K-band and the expected innermost torus radius, we quantified the current expectations for the near-IR interferometric observations of Type 1 nuclei. These observations, with a long baseline of 100 m, including the observations of NGC 4151 with different baselines, should provide independent measurements for the innermost torus radius. This will be important for the physical interpretation of the current and future data obtained for AGN tori.
Acknowledgements.
Authors would like to thank Robert Antonucci and Ari Laor for their helpful comments and discussions. This research used the facilities of the Canadian Astronomy Data Centre operated by the National Research Council of Canada with the support of the Canadian Space Agency. This research has made use of the NASA/IPAC Extragalactic Database (NED) which is operated by the Jet Propulsion Laboratory, California Institute of Technology, under contract with the National Aeronautics and Space Administration. This research is partly based on observations made with the NASA/ESA Hubble Space Telescope, obtained from the Data Archive at the Space Telescope Science Institute, which is operated by the Association of Universities for Research in Astronomy, Inc., under NASA contract NAS 5-26555.References
- Alonso-Herrero et al. (2001) Alonso-Herrero, A., Quillen, A. C., Simpson, C., Efstathiou, A., & Ward, M. J. 2001, AJ, 121, 1369
- (2) Barvainis R., 1987, ApJ, 320, 537
- (3) Barvainis R., 1992, ApJ, 400, 502
- (4) Beckert T., Duschl W. J., 2004, A&A, 426, 445
- (5) Clavel J., Wamsteker W., Glass I. S., 1989, ApJ, 337, 236
- (6) Davies R., Mueller Sanchez F., Genzel R., Tacconi L., Hicks E, Friedrich S, Sternberg A., 2007, ApJ in press, arXiv, 704, arXiv:0704.1374
- (7) Elvis M., et al., 1994, ApJS, 95, 1
- (8) Francis P. J., Hewett P. C., Foltz C. B., Chaffee F. H., Weymann R. J., Morris S. L., 1991, ApJ, 373, 465
- (9) Gaskell C. M., Goosmann R. W., Antonucci R. R. J., Whysong D. H., 2004, ApJ, 616, 147
- Glass et al. (2004) Glass, I. S. 2004, MNRAS, 350, 1049
- (11) Hines D. C., Wills B. J., 1995, ApJ, 448, L69
- (12) Hönig S. F., Beckert T., Ohnaka K., Weigelt G., 2006, A&A, 452, 459
- Huffman (1977) Huffman D. R., 1977, AdPhy, 26, 129
- Kishimoto et al. (2005) Kishimoto, M., Antonucci, R., & Blaes, O. 2005, MNRAS, 364, 640
- (15) Kobayashi Y., Sato S., Yamashita T., Shiba H., Takami H., 1993, ApJ, 404, 94
- Kukula et al. (2001) Kukula M. J., Dunlop J. S., McLure R. J., Miller L., Percival W. J., Baum S. A., O’Dea C. P., 2001, MNRAS, 326, 1533
- Krist et al. (1998) Krist J. E., Golimowski D. A., Schroeder D. J., Henry T. J., 1998, PASP, 110, 1046
- (18) Lacy J. H., et al., 1982, ApJ, 256, 75
- (19) Laor A., Draine B. T., 1993, ApJ, 402, 441
- Mathis, Rumpl, & Nordsieck (1977) Mathis J. S., Rumpl W., Nordsieck K. H., 1977, ApJ, 217, 425
- (21) Maiolino R., Marconi A., Salvati M., Risaliti G., Severgnini P., Oliva E., La Franca F., Vanzi L., 2001a, A&A, 365, 28
- (22) Maiolino R., Marconi A., Oliva E., 2001b, A&A, 365, 37
- (23) Neugebauer G., Green R. F., Matthews K., Schmidt M., Soifer B. T., Bennett J., 1987, ApJS, 63, 615
- (24) Pier E. A., Antonucci R., Hurt T., Kriss G., Krolik J., 1994, ApJ, 428, 124
- Salpeter (1977) Salpeter E. E., 1977, ARA&A, 15, 267
- Scoville et al. (2000) Scoville, N. Z., et al. 2000, AJ, 119, 991
- (27) Suganuma M., et al., 2006, ApJ, 639, 46
- (28) Sitko M. L., Sitko A. K., Siemiginowska A., Szczerba R., 1993, ApJ, 409, 139
- Suchkov & Krist (1998) Suchkov, A., Krist, J. 1998, Instrument Science Report NICMOS 98-018
- Swain et al. (2003) Swain M., et al., 2003, ApJ, 596, L163
- Tomita et al. (2006) Tomita, H., et al. 2006, ApJ, 652, L13
- (32) Tristram K. R. W., et al. 2007, A&A in press, arXiv:0709.0209
- (33) Veilleux S., et al., 2006, ApJ, 643, 707
- (34) Véron-Cetty M.-P., Véron P., 2006, A&A, 455, 773
- (35) Weinberger A. J., Neugebauer G., Matthews K., 1999, AJ, 117, 2748
- (36) Weigelt G., Wittkowski M., Balega Y. Y., Beckert T., Duschl W. J., Hofmann K.-H., Men’shchikov A. B., Schertl D., 2004, A&A, 425, 77
- (37) Winkler H., Glass I. S., van Wyk F., Marang F., Jones J. H. S., Buckley D. A. H., Sekiguchi K., 1992, MNRAS, 257, 659
- (38) Wu H., Zou Z. L., Xia X. Y., Deng Z. G., 1998, A&AS, 132, 181