Evidence for Accretion in the High-resolution X-ray Spectrum of the T Tauri Star System Hen 3-600
Abstract
We present high-resolution X-ray spectra of the nearby, multiple T Tauri star (TTS) system Hen 3-600, obtained with the High Energy Transmission Grating Spectrograph (HETGS) aboard the Chandra X-ray Observatory (CXO). Both principle binary components of Hen 3-600 ( and , separation ) were detected in the zeroth-order CXO/HETGS X-ray image. Hen 3-600- — the component with a large mid-infrared excess — is a factor fainter in X-rays than Hen 3-600-, due to a large flare at Hen 3-600- during our observation. The dispersed X-ray spectra of the two primary components overlap significantly, so spectral analysis was performed primarily on the first-order spectrum of the combined system, with analysis of the individual dispersed spectra limited to regions where the contributions of and can be disentangled via cross-dispersion profile fitting. This analysis results in two lines of evidence indicating that the X-ray emission from Hen 3-600 is derived, in part, from accretion processes: (1) The line ratios of He-like O vii in the spectrum of Hen 3-600 indicate that the characteristic density of its X-ray-emitting plasma is significantly larger than those of coronally active main sequence and pre-main sequence stars. (2) A significant component of low-temperature (2–3 MK) plasma is present in the Hen 3-600 spectrum; this “soft excess” appears somewhat stronger in component . These results for Hen 3-600 are consistent with, though less pronounced than, results obtained from X-ray gratings spectroscopy of more rapidly accreting TTS systems. Indeed, all of the emission signatures of Hen 3-600 that are potential diagnostics of accretion activity — from its high-resolution X-ray spectrum, through its UV excess and H emission line strengths, to its weak near-infrared excess — suggest that its components (and component in particular) represent a transition phase between rapidly accreting, classical T Tauri stars and non-accreting, weak-lined T Tauri stars.
1 Introduction
X-ray observations of star formation regions have established that low-mass, pre-main sequence (T Tauri) stars are luminous X-ray sources (Feigelson & Montmerle, 1999). Such high-energy radiation may exert a profound influence over the process of planet formation (e.g. Glassgold, Najita & Igea, 2004; Feigelson et al., 2005). The origin of pre-main sequence (pre-MS) X-ray emission is still the subject of debate, however. Although most recently formed, low-mass stars likely emit X-rays as a consequence of solar-like coronal activity (Kastner et al., 2004a; Preibisch et al., 2005; Telleschi et al., 2007a) we and others have suggested that the X-ray emission from certain actively accreting pre-main sequence stars may be a direct result of mass accretion from a circumstellar disk onto the forming star (Kastner et al., 2002; Kastner et al., 2004b; Kastner et al., 2006; Stelzer & Schmitt, 2004; Schmitt et al., 2005; Günther et al., 2006; Argiroffi, Maggio & Peres, 2007; Telleschi et al., 2007b).
To improve our understanding of the physical conditions within X-ray emitting regions of both actively accreting, classical T Tauri stars (cTTS) and apparently non-accreting, weak-lined T Tauri stars (wTTS), we are conducting a high-resolution X-ray spectroscopic study of the TW Hya Association (TWA; Kastner et al., 1997; Webb et al., 1999; Zuckerman et al., 2001; Song, Zuckerman & Bessell, 2004, 2003) with the Chandra X-ray Observatory’s High Energy Transmission Grating Spectrometer (HETGS; Canizares et al., 2005). The TWA is uniquely well suited to this study, due to its proximity (typical member distances pc) and lack of intervening cloud material, as well as its status as an evolutionary “missing link” between embedded pre-MS stars and the zero-age main sequence (Kastner et al. (2003); de la Reza, Jilinski & Ortega (2006); also see the review by Zuckerman & Song (2004)).
Observations of TWA members with HETGS provide unique plasma diagnostics that have generated insight into the X-ray emission mechanisms of T Tauri stars. In particular, the density-sensitive line ratios of He-like ions (O vii, Ne ix) detected in the Chandra/HETGS X-ray spectrum of TW Hya indicated plasma densities in the range (Kastner et al., 2002; Testa, Drake & Peres, 2004). This is roughly an order of magnitude larger than all active main sequence stars that have been observed at high spectral resolution (Testa, Drake & Peres, 2004; Ness et al., 2004). Similar results for density-sensitive line ratios subsequently have been obtained from X-ray gratings spectroscopy of the cTTS BP Tau (Schmitt et al., 2005), V4046 Sgr (Günther et al., 2006), and MP Mus (Argiroffi, Maggio & Peres, 2007). Furthermore, the plasma temperature measured from HETGS and XMM-Newton spectra of TW Hya, MK, is consistent with adiabatic shocks arising in gas at free-fall velocities expected for accretion onto the star (Kastner et al., 2002; Stelzer & Schmitt, 2004).
In stark contrast, the HETGS spectrum of the wTTS system HD 98800, a member of the TWA and which is apparently non-accreting, closely resembles those of active main sequence stars (Kastner et al., 2004a). In particular, its He-like Ne ix and O vii triplet line ratios and, hence, plasma densities are well within the range characteristic of “classical” coronal sources, and its plasma temperature distribution is significantly hotter than that of TW Hya.
Typical signatures of active accretion are strong H emission, ultraviolet excess from an accretion disk boundary layer, and a near-infrared excess from hot dust in the inner disk. To fully understand the dependence of high energy emission on accretion rate – if any – we need high resolution X-ray spectra from objects which span a large range in the optical, UV, and IR diagnostics. Here we describe the results of HETGS observations of TWA member Hen 3-600, a multiple pre-MS star system whose principle components are separated by (Webb et al., 1999; Jayawardhana et al., 1999). Like HD 98800, one primary component of Hen 3-600 evidently is surrounded by a dusty disk, based on its IR spectral distribution (Jayawardhana et al., 1999). The mid-infrared spectrum of Hen 3-600, like that of TW Hya, displays evidence for crystalline silicate dust grains (Honda et al., 2003; Uchida et al., 2004), suggesting material in the circumstellar disk of Hen 3-600- has undergone considerable processing and evolution.
The presence and strength of H emission and UV excesses in the spectra of TW Hya and Hen 3-600- (Table 1) indicate that accretion is ongoing in each case. Indeed, apart from TW Hya itself, Hen 3-600- is the strongest H emission source in the TWA (Webb et al., 1999). Based on H line profile analysis, both stars are accreting at rates significantly lower than those of Myr-old TTS that are still found in their nascent dark clouds, with the accretion rate of Hen 3-600- about an order of magnitude lower than that of TW Hya (Muzerolle et al., 2000). This is consistent with the relatively small UV excess of Hen 3-600, as UV excess is also widely used as an indicator of TTS accretion rate. TW Hya is known to have a nearly face-on disk (Krist et al., 2000; Kastner et al., 1997) and is thus ideal for probing accretion since there is no intervening local X-ray absorption by neutral hydrogen, and because the high-latitude accretion region (if directed by bipolar magnetic fields) is in full view. We have no direct measurement of the inclination of the Hen 3-600 components to our line-of-sight, but we infer that it is also low, given its combination of large mid-IR excess and negligible optical reddening; its measured value of is nearly that of an unreddened M3 photosphere (Johnson, 1966). The contrasts in accretion diagnostics apparent in Table 1, and the status of Hen 3-600 as an intermediate case between TW Hya and HD 98800, make Hen 3-600 a key TWA system for further study with Chandra/HETGS. Both components, , are considered members of the TWA based on photometric, spectroscopic, and kinematic criteria (Torres et al., 2003; Reid, 2003; Webb et al., 1999).
2 Observations, Data Reduction, and Results
We observed Hen 3-600 with Chandra/HETGS for 101 ks starting on 2004 March 16 (observation identifier 4502) in the default configuration (timed exposure, ACIS-S detector array) and under nominal operating conditions. Data were re-processed with Chandra Interactive Analysis of Observations software (CIAO, version 3) to apply updated calibrations (CALDB 3.2). Events were also cleaned of the detector artifacts on CCD 8 (“streaks”). The effective exposure time after data reprocessing is 99.4 ks. Spectral responses, including corrections for ACIS contamination, were generated with CIAO.
The resulting Chandra/HETGS spectral image of the Hen 3-600- binary yielded 883 and 1610 zeroth order counts from and , respectively, and 3420 combined (MEG and HEG) first order counts. The dispersed spectra are not well resolved spatially over the entire spectral range (see § 3.2). To estimate count rates for the individual components of the Hen 3-600 binary, we extracted separate dispersed spectra within cross-dispersion regions centered on and , with the corresponding zeroth-order centroids as the wavelength reference. We thus estimate combined MEG and HEG plus and minus first order count rates of 0.010 s-1 and 0.024 s-1 for components and , respectively; these estimates are subject to some uncertainty, however, given the overlap between the dispersed spectra of and in the cross-dispersion direction.
Line positions and fluxes were measured with ISIS111ISIS is available from http://space.mit.edu/CXC/ISIS (Houck & Denicola, 2000; Houck, 2002) by convolving Gaussian profiles with the instrumental response. Determination of an accurate continuum is important. Even at HETGS resolution, there are portions of the spectrum for which the local minima are a poor approximation to the true continuum. Hence, we adopt an iterative procedure whereby we first use a low order polynomial to fit the local continuum knowing it to be in error in some spectral regions. After we obtain a plasma model from line fluxes, we evaluate a global continuum and re-fit the lines and continue to iterate in this fashion if required.
2.1 Zeroth-order image, light curves, and CCD spectra
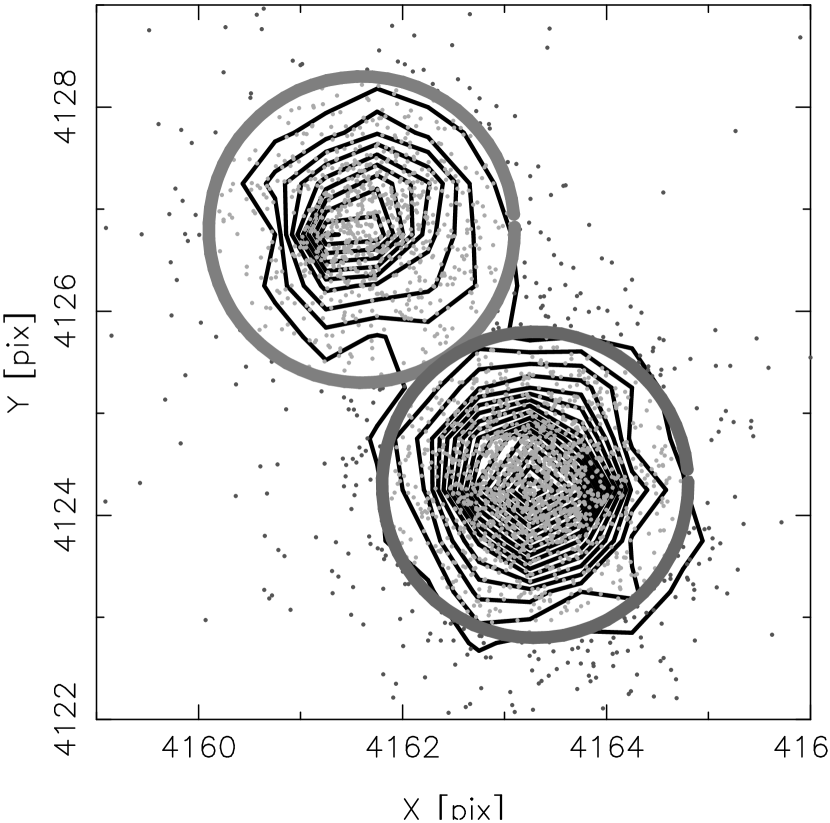
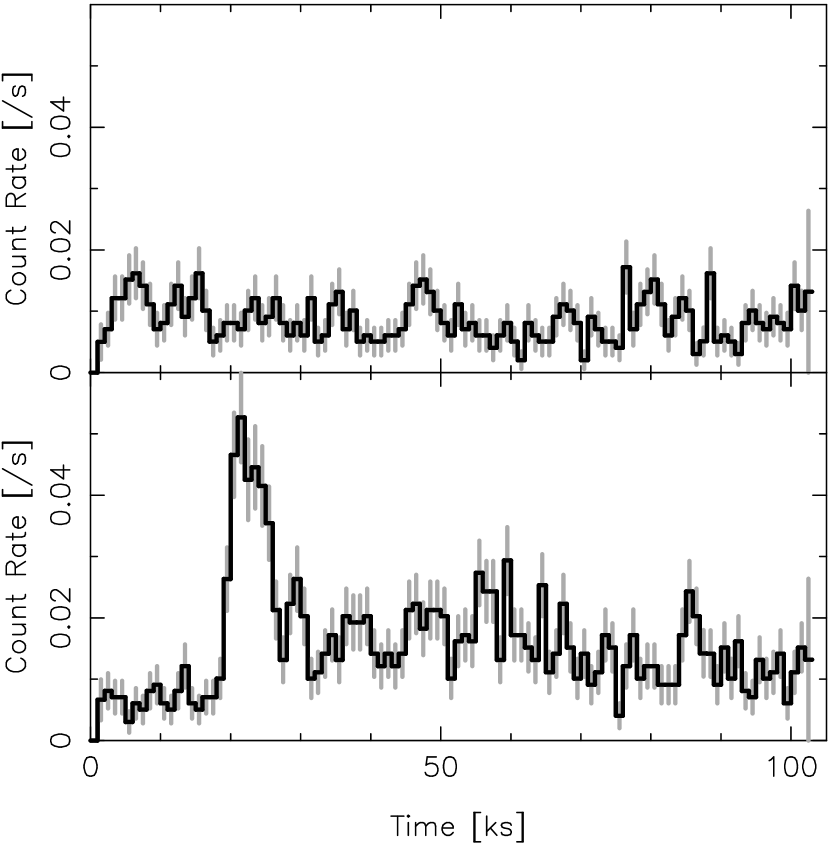
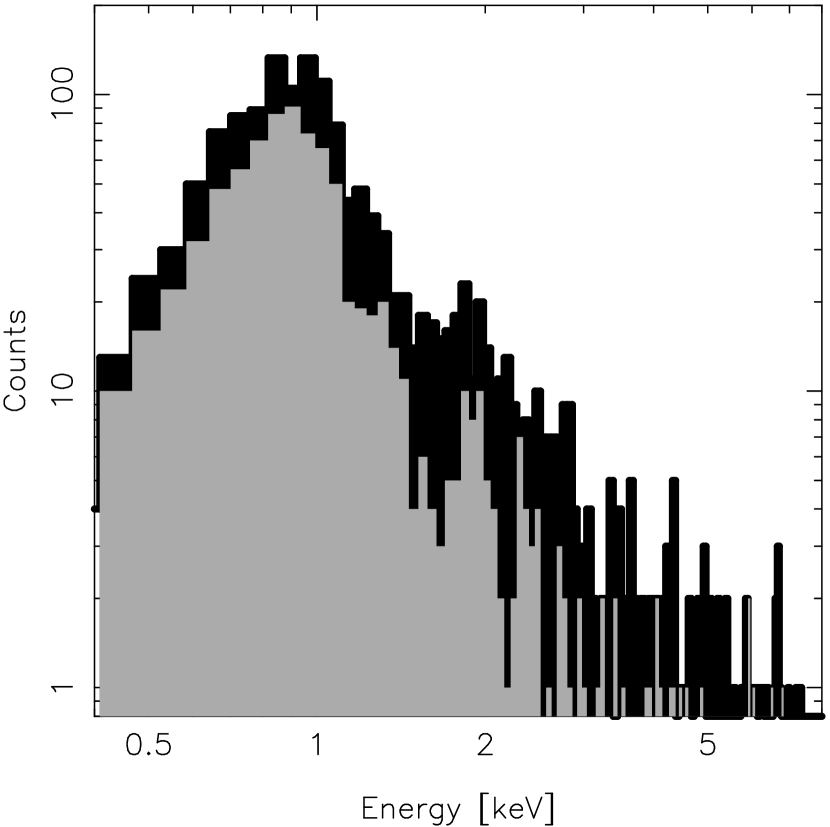
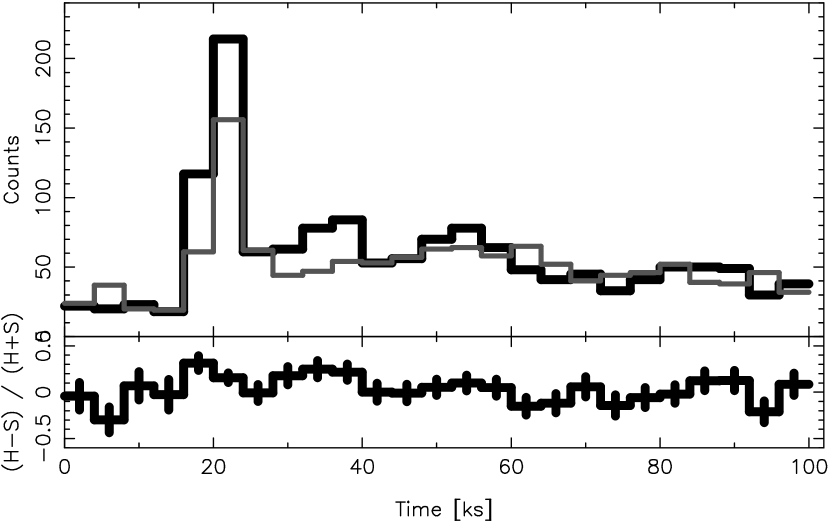
In Figure 1 we display the zeroth-order HETGS image, light curves, and CCD energy spectra of the Hen 3-600 system. Both primary components were detected, with separation () and orientation in excellent agreement with earlier infrared imaging (Jayawardhana et al., 1999). Hence, there is no ambiguity in attributing the X-ray emission to components and . However, the X-ray flux ratio of the pair is the reverse of that in the optical and infrared. In those wavelength regimes, component is brighter — indeed, its infrared excess likely dominates that of the Hen 3-600 system (Jayawardhana et al., 1999). During our observations, however, was the brighter X-ray source.
The light curve shown in Figure 1 reveals that this X-ray mean flux difference in Hen 3-600 is due to a large flare that occurred on component , ks after the start of the observation. This flare displayed a steep ( ks) rise and large amplitude, achieving a count rate a factor above pre-flare rate. The flare decays abruptly over ks, but did not return to the pre-flare level, but to one about two times higher.
The count rate of component remained at a low level with small fluctuations throughout our observation. It was actually the brighter of the two main components during the initial ks of the HETGS observation. A similar reversal in X-ray to optical and IR occurred in HD 98800 in which the component surrounded by a dusty disk, defined by presence of a strong IR excess, was also the weaker and steadier X-ray source of the system (Kastner et al., 2004a).
Component appears to be the harder of the two components in the zeroth-order CCD spectra, which are also shown in Figure 1. In particular, the zeroth-order spectral energy distributions of and peak near keV, but component drops off more rapidly at higher energies. Component has a weak but significant Fe K line at keV.
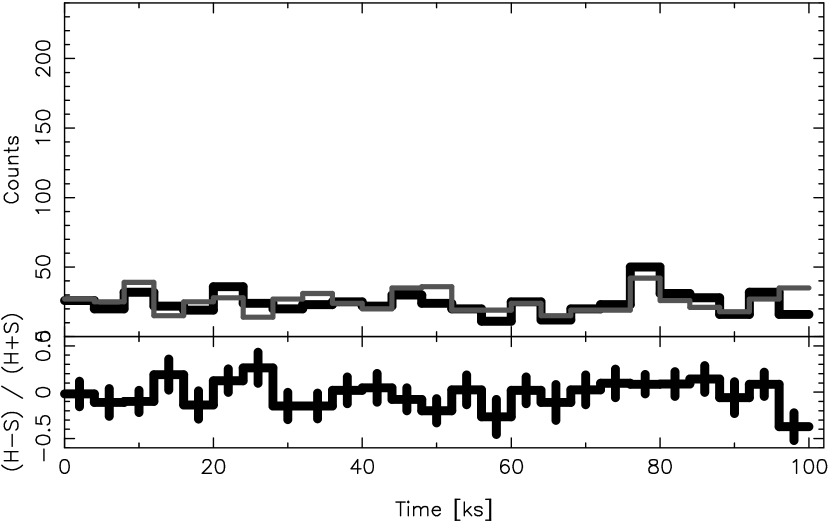
There is little evidence that the spectrum of hardened during the flare. The hardness increased only marginally from 15–40 ks from observation start (Figure 2). This behavior appears distinct from that of coronal sources, which usually show much more obvious hardening during flares, as in the case of HD 98800 (Kastner et al., 2004a) and other coronally active stars (e.g. Güdel et al., 2004; Huenemoerder, Testa & Buzasi, 2006). The hardnesses of and outside the flare (excluding the 15–40 ks interval) are similar. This suggests that excluding the flare, that the spectral energy distributions are similar. High resolution spectral diagnostics (discussed later) reveal some differences between and .
We did not use the zero order for detailed spectral modeling, but deferred to the high resolution spectrum. We did evaluate the high resolution-derived model for the sum of with the zero order response to examine consistency with the sum of the zero order spectra, but calibration systematic residuals make comparison difficult. We thus only used the zero orders for variability and qualitative assessment of the individual components.
2.2 First Order Spectrum

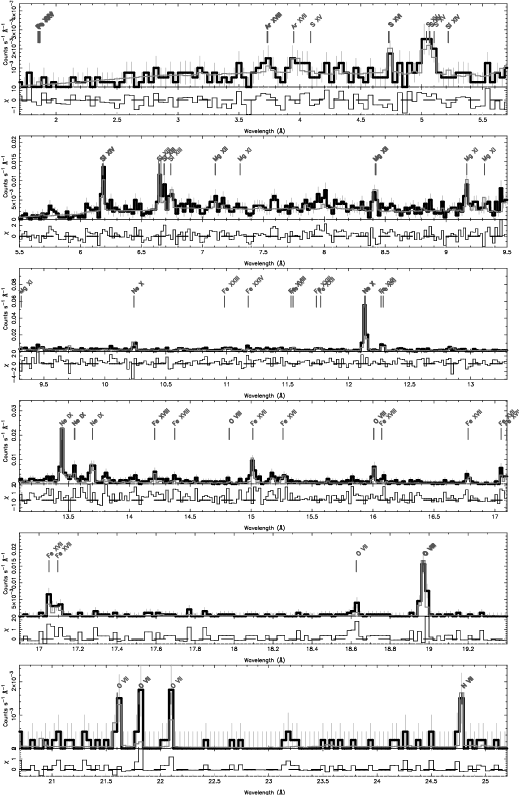
The combined, first-order MEG and HEG spectrum of Hen 3-600 is displayed in Figure 3. As is also the case in HETGS spectra of fellow TWA members TW Hya and HD 98800 (Kastner et al., 2002; Kastner et al., 2004a), the most prominent lines in the HETGS spectrum of Hen 3-600 are those of highly ionized Ne and O, while lines of Fe are relatively weak. We have measured line fluxes by fitting the combined counts (Table 2); for stronger lines we have determined the relative contribution of each component (Table 3). In the following sections, we describe these determinations in more detail.
3 Spectral Analysis
3.1 Emission measure distribution
To ascertain the ranges of temperature and elemental abundances that characterize the X-ray-emitting plasma of the Hen 3-600 system, we fit its combined () dispersed HETGS spectrum with an emission measure distribution () model. The is a one-dimensional characterization of a multi-thermal plasma. It is a weighting function which relates the line emissivities () to flux () via an integral equation,
for ion of element atomic number and abundance ; is the plasma (electron) temperature, the volume, and are the electron and hydrogen densities, and is source distance. The quantity in square brackets is the (also commonly called the differential emission measure []). We have ignored any density dependence on , which in principle exists and which would introduce another differential term into the equation. The few strongly density-sensitive lines of the He-like triplets are handled independently. We also assume uniform abundances, such that appears outside the integral.
We applied methods similar to those described in Huenemoerder, Testa & Buzasi (2006) to perform a regularized fit of the emission measure and abundances to line fluxes. There are many caveats to emission measure modeling (see Huenemoerder, Testa & Buzasi, 2006, for discussion and further citations). Here we have the added complication that components and are not fully resolved, so we must fit their summed emission. The results for the of Hen 3-600 hence implicitly rely on the assumption that the abundances are homogeneous and identical in each component. Lines used in the fitting are listed in Table 2. Those lines with measured flux but which are known to be density sensitive (He-like triplet intercombination and forbidden lines) or which had large residuals (due to some systematic error, such as misidentification) have their predicted flux enclosed in parentheses.
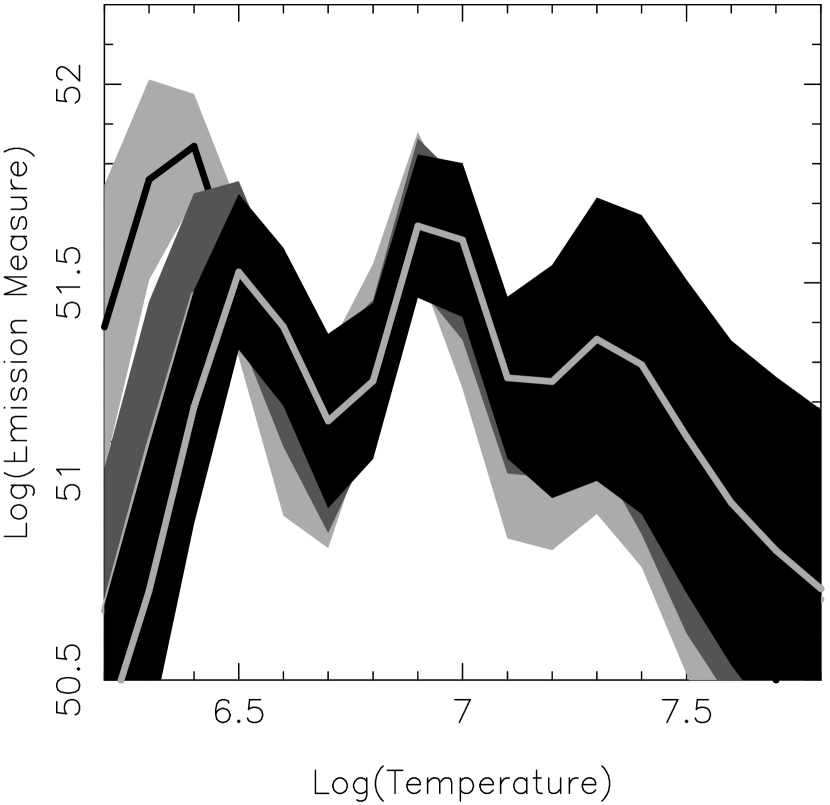
Figure 4 shows the resulting for different assumed values of the absorbing column (). The upper and lower bounds of the shaded regions result from 100 Monte-Carlo iterations in which the line fluxes were randomly perturbed within their measured uncertainties. Regardless of the assumed value of , we find a broad distribution with strong peaks at and , and a “hot tail” above . The longest wavelength (and characteristically cooler) lines are most sensitive to the assumed . Because there are few counts in this long-wavelength regime, we obtain effectively identical solutions for values of cm-2. If we assume a value of cm-2, then the rises strongly below ; however, in this case the required N abundance is unrealistically large, at 4.7 times Solar. Hence, we adopt a value of cm-2. This value has effect on line fluxes in the HETGS bandpass, and is consistent with the apparent lack of interstellar reddening toward the TWA (Kastner et al., 2003) and with the apparently negligible toward and Hen 3-600 in particular. The small inferred value of (see also §3.4) furthermore suggests we observe the dust-disk-enshrouded component, (Jayawardhana et al., 1999), at low inclination
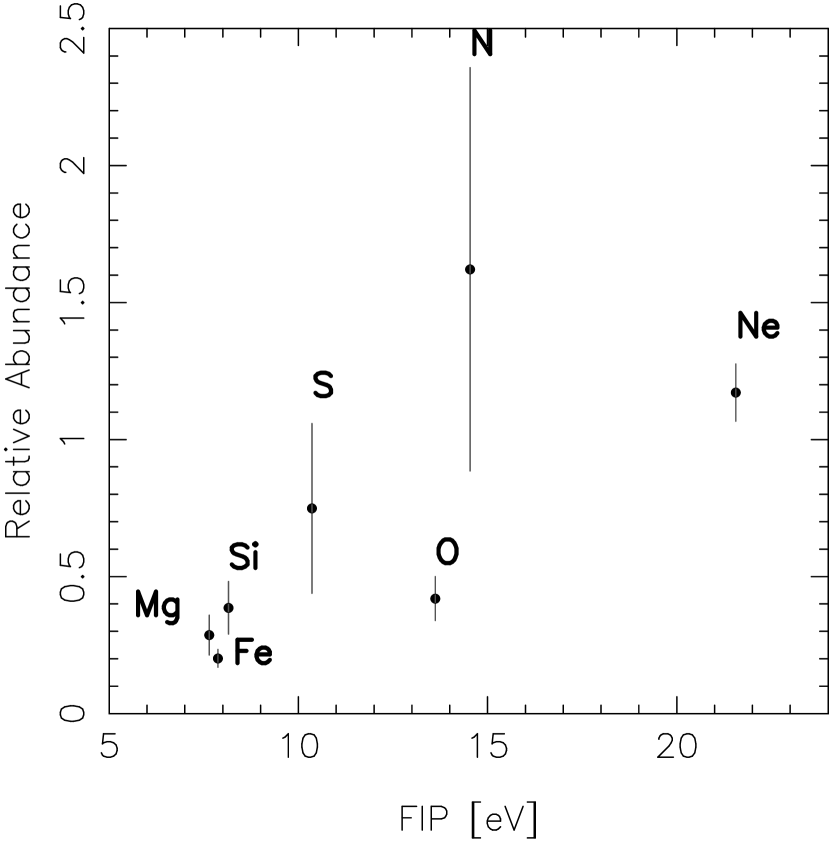
The abundances obtained from the fitting under the assumption cm-2 are listed in Table 4 and displayed in Figure 5. We have adopted the abundances of Anders & Grevesse (1989) for our ratios to Solar values. Figure 6 shows the observed spectrum overlaid with the synthetic spectrum predicted by the emission measure distribution and abundance model.
Assuming , the integrated flux (1.5-25 Å) obtained from the -reconstructed model is ( ), corresponding to a luminosity at the estimated distance to Hen 3-600 of 45 pc, the mean of the values derived by Kastner et al. (1997) ( pc, a “photometric” distance) and Webb et al. (1999) (50 pc, an assumed value, based on Hipparcos distances of 47–67 pc measured for other TWA members).
3.2 Cross-dispersion decomposition

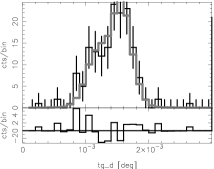
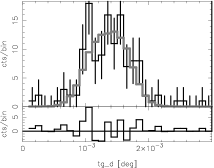
Though the main components of the Hen 3-600 binary system are well resolved in the zeroth-order image (see Figure 1), the dispersed spectra of the two components are only marginally resolved spatially in the cross-dispersion direction (Figure 7). The degree of cross-contamination of the spectrum increases with wavelength due to the astigmatism inherent in a Rowland spectrometer. To obtain emission line fluxes and ratios in a consistent manner across the entire spectrum we have modeled the cross-dispersion profiles in the first-order spectra as a function of wavelength to quantify the relative contribution of each source to the brighter emission lines.
Templates for cross-dispersion profiles were based on the same MARX simulations from which the Chandra calibration database line spread fuctions were derived (Marshall, Dewey & Ishibashi, 2004). The cross-dispersion profile of a single source is characterized by the sum of two Gaussian plus two Lorentzian distributions whose parameters depend on the grating type and wavelength.
The Hen 3-600 cross-dispersion profiles were fit with the sum of two cross-dispersion calibration profiles, each corresponding to a single source at the wavelength range of interest. These wavelength ranges were selected to be as narrow as feasible — to extract information on the relative strength of the two sources in individual spectral lines where possible — but wide enough to include counts sufficient to allow a reliable fit. For each selected wavelength range, the observed cross-dispersion profile generally shows two peaks which correspond to the two main components of the Hen 3-600 binary. The separation between the two centroids was set equal to the known separation between and (, or degrees) and not allowed to vary. The Gaussian and Lorentzian width parameters were also frozen at their known calibration values. The only free interesting parameters of the fit were the relative normalizations of each component. Figure 8 shows a collection of the cross-dispersion fits for several line regions.
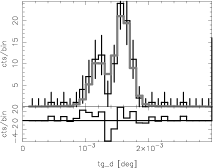
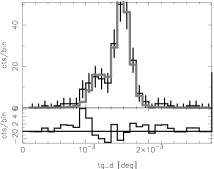
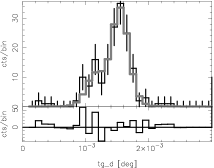
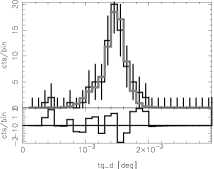
To derive the fluxes of individual spectral lines for each of the two stars, we first determined the line fluxes in the combined (), dispersed spectrum. We then partitioned the combined line flux on the basis of the weights derived from the best fit to the cross-dispersion profiles in the corresponding wavelength region. The results are listed in Table 3. For individual bright lines such as Ne x and O viii , the cross-dispersion profile fitting can be performed over a narrow wavelength range, and the fluxes are well determined for each binary component. For weaker lines like Si xiii or the Ne ix intercombination and forbidden lines, broad wavelength ranges were required for the profile fitting, and we are only able to obtain the mean line and continuum contributions from each component across a line complex. Other line fluxes that we measured but which were used only in the emission measure analysis (§ 3.1) are listed in Table 2.
3.2.1 Temperature sensitive line ratios of H-like and He-like ions
In Section 3.1 we have used analysis to derive thermal structure and element abundances for the composite spectrum of , using the fluxes of a large set of spectral lines. Spectral diagnostics based on a few strong spectral lines can be used as independent checks on these results. For instance, the He-like to H-like Ly line ratios can be used to derive an estimate of the temperature of the emitting plasma. Even though the accurate temperature determination from these ratios strictly holds only for isothermal plasma, whereas the actual temperature distributions of X-ray emitting plasma in stars are far from isothermal, these diagnostics can provide useful comparisons between sources (see, e.g., Testa et al., 2007; Ness et al., 2004).
In Table 5, we summarize results for key line ratios that are diagnostic of plasma temperature. Following the cross-dispersion decomposition, a handful of these temperature-sensitive line ratios are available separately for and . These ratios — in particular, Ly/He-r line ratios of Ne — indicate that there were sharp plasma temperature differences between and during our observations, with the hotter component. The ratios of the H-like Ly to He-like resonance lines of Ne and O are indicative of plasma temperatures of MK for component and MK for component . This is consistent with the results from cross-dispersion profile analysis of the He-like Ne ix and O vii triplet regions, which indicate (albeit with a high degree of uncertainty) that is the fainter of the two components in the former region but is comparable to component in the latter, longer-wavelength spectral region.
3.2.2 Elemental abundances
Using the cross-dispersion profile analysis, we can estimate the abundances of Ne, Fe, Mg, and Si with respect to O for each stellar component individually — independently of (and in contrast to) the analysis, in which the derived abundances (Table 4) represent an average of the two components. These diagnostics use the ratio of two combinations of lines of two different elements whose combined emissivity curves have very similar temperature dependence. Therefore their ratio is largely independent of the specific thermal distribution of the plasma and provides an estimate of the ratio of the abundances of the relevant elements (see e.g. Drake & Testa, 2005; García-Alvarez et al., 2005).
The cross-dispersion decomposition results for abundances are listed in Table 6. Consistent with the analysis, we find both components of Hen 3-600 display anomalously high Ne/O ratios and Fe deficiency, with component slightly less extreme in terms of the latter. The Ne and Fe abundances and ratios to O of both components are very similar to those of HD 98800 (Kastner et al., 2004a) or BP Tau (Robrade & Schmitt, 2006). The Ne/O ratios, though, are not as extreme as in the case of TW Hya (Kastner et al., 2002; Robrade & Schmitt, 2006).
Component displays evidence for enhanced abundances of Mg and Si relative to O. These anomalies, if confirmed, are similar to patterns in TW Hya, whose high-resolution X-ray spectrum (Kastner et al., 2002) reveals a relative overabundance of about 3 (compared to Solar ratios) for both elements relative to oxygen.
3.3 Density-sensitive line ratios of He-like ions
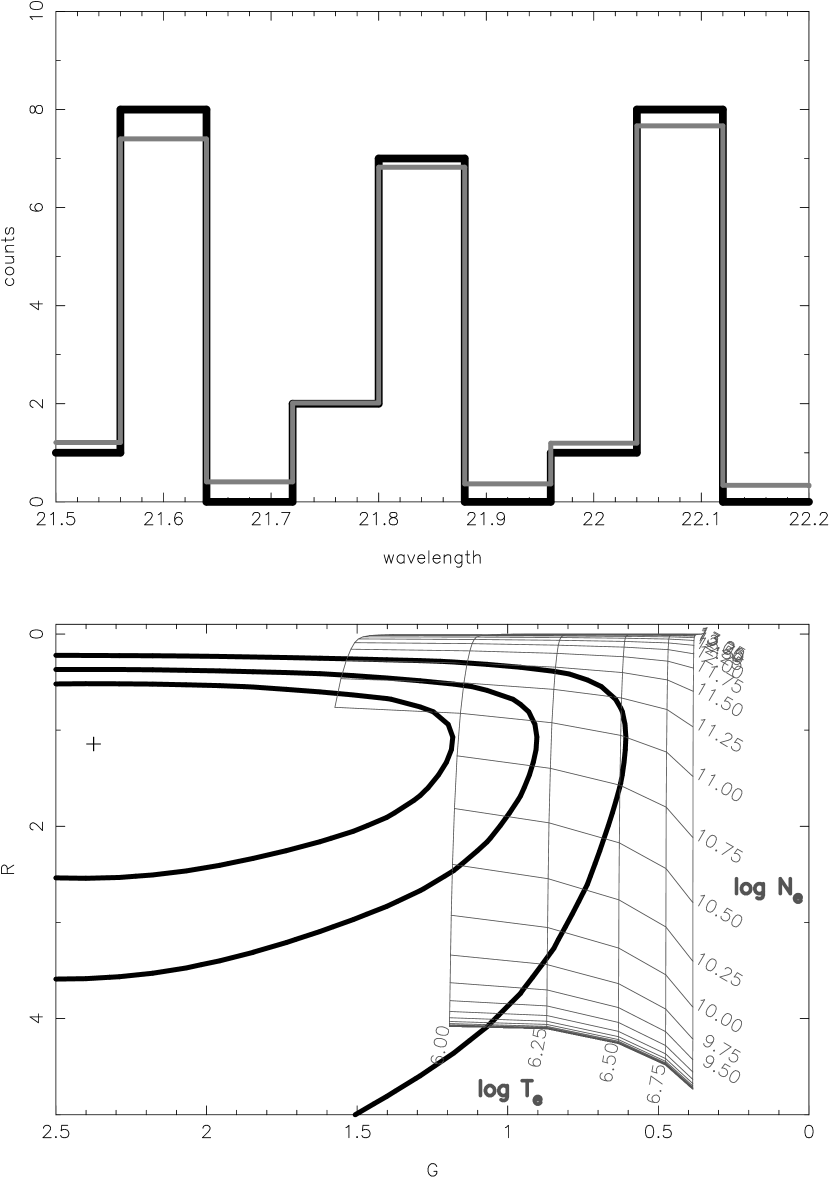
Ratios of the forbidden () to intercombination () line intensities within the triplet line complexes of He-like ions (e.g., Mg xi, Ne ix, O vii) are potential diagnostics of plasma density. For the combined () spectrum of Hen 3-600, the ratio for the O vii triplet is significantly smaller than the low-density limit of 3.9. The measured value, , lies between the O vii line ratios displayed by HD 98800 () and TW Hya (). It is not possible to infer plasma densities independently and unambiguously for the two main binary components of Hen 3-600, as the relatively poor photon counting statistics limit the cross-dispersion profile fitting to broad wavelength ranges that average over these triplet line complexes. Table 3 and Figures 1 and 8 suggest that components and contribute roughly equally to the photon count rate in the O vii triplet wavelength range, with perhaps the brighter component in this line complex.
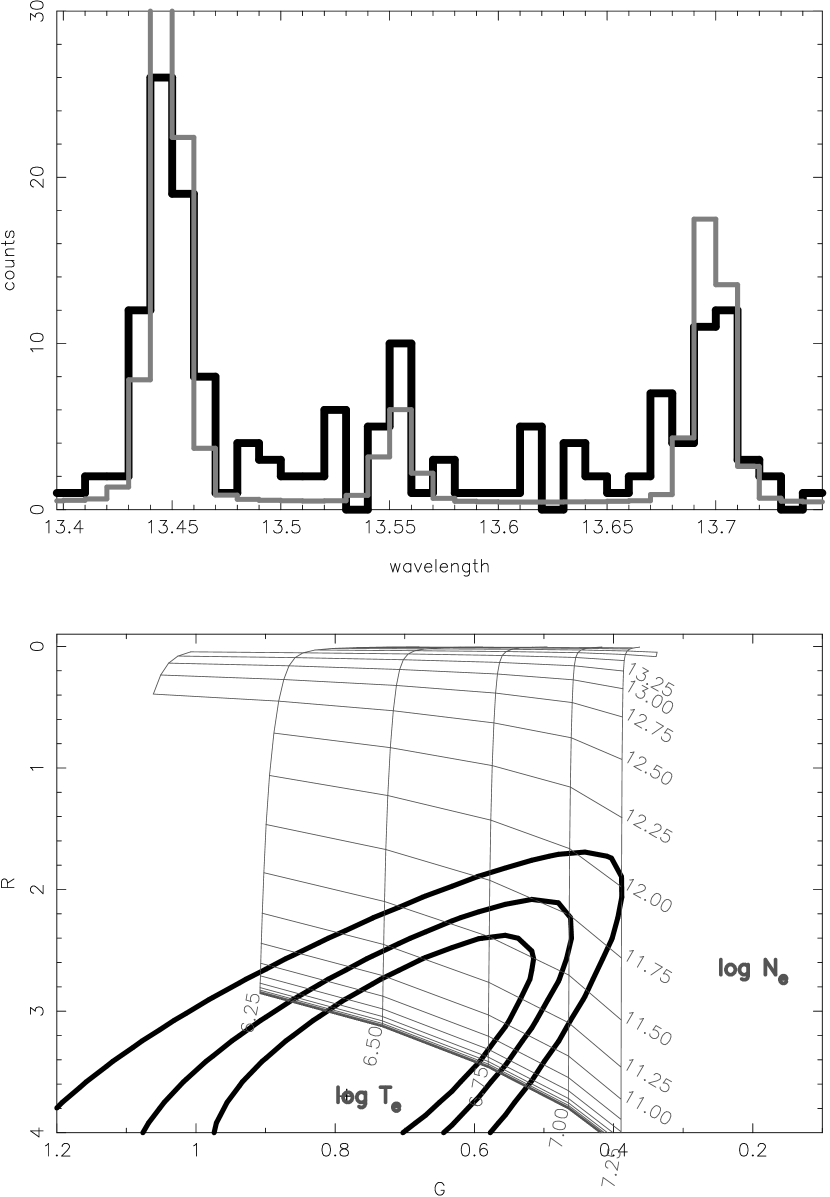
We computed confidence contours in the ratios and (where is the intensity of the triplet resonance line) directly from the Hen 3-600 spectrum (Figure 9). The results show that the 90% confidence limit extends to near the low density limit (middle contour), but is still significantly above this limit. However, the ratio is unrealistically large, extending to temperatures outside the theoretical range of sensitivity, indicating some peculiarity in the emission, or a problem with the atomic data. If we consider only the ratio (), then , with the 90% confidence interval at ranging from 10.25 to 11.25. The Ne ix line ratio indicates an upper limit of (90% confidence), consistent with O vii (Figure 10). The Ne ix triplet region has Fe line blends, but since Fe is relatively weak in the spectrum of Hen 3-600, the ratio for Ne ix is essentially uncontaminated. The Mg xi triplet is compromised by weak signal, Ne x H-Ly series blends which bracket the intercombination line, and significant continuum.
3.4 O vii ratios: , abundances, and binarity
In principle, given the theoretical ratio of flux in O vii He-Ly (18.63 Å) to the flux in the triplet complex (22 Å), we should be able to determine the line-of-sight absorbing column of neutral hydrogen . As increases, the ratio of 18.63 Å to 22 Å apparent flux should increase above the theoretical value of 0.06, due to preferential absorption of longer-wavelength photons. Indeed, the ratio we observe for He-Ly to the sum of the triplet is about 2.5-3 times the theoretical value of 0.06. The measurement uncertainty is large, however; the 90% confidence interval reaches into the range 0.04-0.08 in the ratio defined by its temperature dependence over the peak emissivity of O vii (approximately to 6.5).
The binarity of the system introduces complications, however, since the dispersed spectra of components and are blended. There is no reason a priori that any local be the same for the two components; indeed, we would expect toward to be larger than that toward , given that only the former component has a detectable mass of circumstellar dust. In addition, the line fluxes are determined by the product of the emission measure and the oxygen abundance, either of which could also differ between the two stars.
One empirical constraint, from the cross-dispersion profile fitting (§3.2), is that the emergent flux near 20 Å is about equal for and . Assuming that this reflects similar flux in the O vii transitions from each star, the ratio of O vii fluxes to the ratio of theoretical emissivities is then only a function of for each stellar component. Contours of constant ratios vs. and (not shown) indicate that must be for either component to drive the observed ratio to values . However, such a large value of is inconsistent with the relatively strong N vii line, as discussed earlier (3.1). We conclude that the deviation of the observed ratio of 18.63 Å to 22 Å flux from the theoretical value is most likely due to poor photon counting statistics.
4 Discussion
4.1 He-like triplet line ratios
Both TW Hya and Hen 3-600 exhibit H emission line equivalent widths and UV excesses (Table 1) that are larger than typically observed for chromospherically active stars. Such large H emission intensities and UV excesses are generally interpreted as evidence for accretion. In Figures 11 and 12, respectively, we plot the equivalent widths of H and ultraviolet excesses vs. ratios of triplet lines of He-like ions for pre-main sequence stars and (in Figure 12) for chromospherically active main sequence stars. These figures make clear that:
-
1.
for T Tauri stars, H equivalent widths and X-ray line ratios are well correlated;
-
2.
the cTTS systems (TW Hya, BP Tau, V4046 Sgr, and MP Mus) have anomalously small values of ;
-
3.
the properties of the apparently nonaccreting (wTTS) systems AU Mic and HD 98800 more closely resemble those of coronally active main sequence stars than actively accreting pre-main sequence stars (as also noted by Kastner et al., 2004a);
-
4.
the weakly accreting Hen 3-600 appears as an intermediate case, lying between the cTTS on the one hand, and wTTS and coronally active main sequence stars on the other.


The presence of intense UV fields generated in accretion shocks that lie in close proximity to the X-ray-emitting regions of cTTS may affect the ratios of such systems, via radiative pumping of ions out of the metastable state that leads to forbidden line emission. If such radiative pumping is important, clearly this would compromise the utility of the ratio as a density diagnostic. However, models suggest that that such UV pumping contributes negligibly to the observed line ratios of He-like ions for TW Hya and Hen 3-600. Specifically, to produce the ratios observed for Hen 3-600 (O vii) and TW Hya (Ne ix), the UV fields would have to be characterized by temperatures of K and K, respectively (Porquet et al., 2001). In contrast, the extant UV continuum data for these stars indicates temperatures well below K in both cases (Costa et al., 2000; Muzerolle et al., 2000). Furthermore, there is no apparent correlation between and ultraviolet excess, among cTTS systems (Figure 12). Hence it appears the plasma densities characterizing cTTS systems and Hen 3-600 are anomalously high among X-ray-emitting, late-type stars observed thus far at high spectral resolution. Recent results reported by Ness & Schmitt (2005) concerning anomalous Fe line ratios in the X-ray spectrum of TW Hya support this assertion.
4.2 X-ray temperatures and origins in and
Strong low- () emission is apparent in the HETGS spectrum of Hen 3-600. This result is obtained both from the modeling results for the combined () system and from temperature sensitive Ne and O line ratios for component as derived from cross-dispersion decomposition (Table 5). The similarly low plasma temperatures measured for Hen 3-600- and TW Hya point to the possibility that, in both cases, the X-ray emission is derived (at least in part) from shocks. In this regard, we note that the X-ray flux from Hen 3-600- was relatively constant during our observation, consistent with a shock origin. Furthermore, the temperature derived from O vii line ratios in the spectrum of ( MK) is similar to that measured for other accreting TTS, whereas the Ne ix and O vii line ratio temperatures of ( MK) more closely resembles those of non-accreting TTS (Telleschi et al., 2007b).
There is additional evidence that the X-ray emission from component is dominated by magnetically heated (as opposed to shock-heated) plasma. Specifically, it displayed a hotter spectrum than as determined both in the continuum and in line ratios, and it displayed a large flare. The flare was somewhat peculiar, however, in that the spectral hardness showed no strong change as is typical for coronally active stars. This circumstantial evidence may simply be due to statistics; further observations may detect a flare on . In the Taurus molecular cloud, cTTS and wTTS do show similar variability (Stelzer et al., 2007). This implies that even strongly accreting sources still probably have a significant emission component from magnetically heated plasma. As any accretion-generated emission component weakens, magnetic coronal activity will become more apparent. In this middle regime, high-resolution (line-based) diagnostics of temperatures and abundances are needed.
4.3 Abundances
Whereas TW Hya displays evidence for metal (O, Fe, Mg, Si) depletion that has been attributed to grain growth in its circumstellar disk (Stelzer & Schmitt, 2004; Drake, Testa & Hartmann, 2005), the abundance patterns found in the X-ray spectrum of Hen 3-600 are ambiguous in this regard: Fe is depleted, but the absolute abundance ratio Ne/O is ( relative to the solar Ne/O ratio), very much in line with the mean Ne/O ratio of coronally active stars (Drake & Testa, 2005).
If, however, we consider only the results from high-resolution X-ray spectroscopy, it is not at all clear that there is such strong evidence for depletion. The Si and Mg abundances in TW Hya are about Solar according to Kastner et al. (2002), and while those authors stated problems regarding the Mg xi model, Si xiv, Si xiii, and Mg xii are well described by their adopted emission measure and abundances. Thus, the largest difference between Hen 3-600 and TW Hya is in their Ne/O ratios which are about 3 for Hen 3-600 (as well as for HD 98800, BP Tau, and CR Cha), and about half that of TW Hya (using the Anders & Grevesse (1989) scale). The abundances of Mg and Si themselves appear to be substantially lower in Hen 3-600 than in TW Hya.
The pattern for Hen 3-600- is similar to that found in other active stars from high resolution spectra, but which are also seen in the much younger Orion Nebula Cluster stars from analysis of low-resolution CCD spectra by Maggio et al. (2007). The large sample of Orion stars allowed those authors to apply independent statistical tests. Our values for Hen 3-600- fall within the boxes shown in their Figure 12, which in turn overlap values for other stars.
Considering the decomposition by component star, the Si and Mg abundances relative to O in component are, if anything, enhanced with respect to Solar ratios, and are more like TW Hya than is component . Indeed, in light of the fact that the two most rapidly accreting stars in the TWA, TW Hya and Hen 3-600, both display evidence for grain processing (Uchida et al., 2004), that only TW Hya displays an anomalous Ne/O ratio, and that both TW Hya and Hen 3-600- have high Si/O and Mg/O values, it appears that circumstellar dust grain evolution may play an important role in determining X-ray abundance patterns, but these patterns do not seem to be what was previously expected for Si and Mg. It is clear that better high-resolution spectra are required to provide much better statistics and models for the important Mg and Si features. Our uncertainties on the - decomposition are quite large due primarily to the overall signal level, but are not limited by the spatial separation of the two stars.
5 Conclusions
The results presented here establish that Hen 3-600, like TW Hya, stands out from classical coronal sources, in terms of both its O vii triplet spectrum and its soft X-ray (low temperature emission measure) excess. Specifically, among the several dozen stars with O vii triplet line ratios thus far measured by Chandra/HETGS or XMM-Newton/RGS, Hen 3-600, TW Hya, BP Tau, V4046 Sgr, and MP Mus – all cTTS systems — are the only stars with less than (Kastner et al., 2002; Testa, Drake & Peres, 2004; Ness & Schmitt, 2005; Robrade & Schmitt, 2006; Günther et al., 2006; Argiroffi, Maggio & Peres, 2007). Meanwhile, soft X-ray excesses have been detected in the spectra of a number of accreting TTS systems and are not observed in non-accreting systems (Telleschi et al., 2007b). While the O vii ratio and the peak at measured for Hen 3-600 are not as extreme as those found for TW Hya (Kastner et al., 2002), it is notable that these two objects — the only TWA stars known to be actively accreting — share these unusual X-ray spectral properties.
Hence, it seems that the soft X-ray emission from Hen 3-600-, like that from TW Hya and few other cTTS observed to date at high spectral resolution in X-rays, may be directly attributable to accretion shocks (Kastner et al., 2002; Stelzer & Schmitt, 2004; Günther et al., 2006). Indeed — while conclusions concerning Hen 3-600 are somewhat tentative at present, due to the poor photon counting statistics in our HETGS spectroscopy — the X-ray-derived plasma densities of TW Hya and Hen 3-600 ( and , respectively) appear to scale with their accretion rates as derived from H line profiles and UV continuum fluxes: yr-1 and yr-1, respectively (Muzerolle et al., 2000). Alternatively, this low- emission perhaps may be the result of shocks in collimated, disk-driven outflows from these stars. Such soft, constant X-ray emission components have recently been detected in Chandra and XMM-Newton CCD spectroscopy of a handful of cTTS disk/jet systems, such as the Beehive proplyd in Orion (Kastner et al., 2005) and DG Tau (Güdel et al., 2007; Güdel et al., 2005).
All of the emission signatures of Hen 3-600- that are potential diagnostics of accretion activity — from its X-ray line ratios, through its UV excess and H emission line strengths, to its weak near-infrared excess — are fully consistent with its status as a transition object, placed roughly midway between rapidly accreting, classical T Tauri stars and non-accreting, weak-lined T Tauri stars. These results speak to the need for additional high-resolution X-ray spectroscopy of T Tauri stars spanning a wide range of accretion states.
References
- Anders & Grevesse (1989) Anders, E., & Grevesse, N., 1989, Geochim. Cosmochim. Acta, 53, 197
- Argiroffi, Maggio & Peres (2007) Argiroffi, C., Maggio, A., & Peres, G., 2007, A&A, 465, L5
- Barrado y Navascués et al. (1999) Barrado y Navascués, D., Stauffer, J. R., Song, I., & Caillault, J.-P., 1999, ApJ, 520, L123
- Byrne (1986) Byrne, P. B., 1986, Irish Astronomical Journal, 17, 294
- Canizares et al. (2005) Canizares, C. R., et al., 2005, PASP, 117, 1144
- Costa et al. (2000) Costa, V. M., Lago, M. T. V. T., Norci, L., & Meurs, E. J. A., 2000, A&A, 354, 621
- de la Reza, Jilinski & Ortega (2006) de la Reza, R., Jilinski, E., & Ortega, V. G., 2006, AJ, 131, 2609
- de la Reza et al. (1989) de la Reza, R., Torres, C. A. O., Quast, G., Castilho, B. V., & Vieira, G. L., 1989, ApJ, 343, L61
- Drake & Testa (2005) Drake, J. J., & Testa, P., 2005, Nature, 436, 525
- Drake, Testa & Hartmann (2005) Drake, J. J., Testa, P., & Hartmann, L., 2005, ApJ, 627, L149
- Feigelson et al. (2005) Feigelson, E. D., et al., 2005, ApJS, 160, 379
- Feigelson & Montmerle (1999) Feigelson, E. D., & Montmerle, T., 1999, ARA&A, 37, 363
- Güdel et al. (2004) Güdel, M., Audard, M., Reale, F., Skinner, S. L., & Linsky, J. L., 2004, A&A, 416, 713
- García-Alvarez et al. (2005) García-Alvarez, D., Drake, J. J., Lin, L., Kashyap, V. L., & Ball, B., 2005, ApJ, 621, 1009
- Glassgold, Najita & Igea (2004) Glassgold, A. E., Najita, J., & Igea, J., 2004, ApJ, 615, 972
- Gregorio-Hetem et al. (1992) Gregorio-Hetem, J., Lepine, J. R. D., Quast, G. R., Torres, C. A. O., & de La Reza, R., 1992, AJ, 103, 549
- Güdel et al. (2005) Güdel, M., Skinner, S. L., Briggs, K. R., Audard, M., Arzner, K., & Telleschi, A., 2005, ApJ, 626, L53
- Güdel et al. (2007) Güdel, M., Telleschi, A., Audard, M., L. Skinner, S., Briggs, K. R., Palla, F., & Dougados, C., 2007, A&A, 468, 515
- Günther et al. (2006) Günther, H. M., Liefke, C., Schmitt, J. H. M. M., Robrade, J., & Ness, J.-U., 2006, A&A, 459, L29
- Honda et al. (2003) Honda, M., Kataza, H., Okamoto, Y. K., Miyata, T., Yamashita, T., Sako, S., Takubo, S., & Onaka, T., 2003, ApJ, 585, L59
- Houck (2002) Houck, J. C., 2002, in High Resolution X-ray Spectroscopy with XMM-Newton and Chandra, ed. G. Branduardi-Raymont
- Houck & Denicola (2000) Houck, J. C., & Denicola, L. A., 2000, in ASP Conf. Ser. 216: Astronomical Data Analysis Software and Systems IX, Vol. 9, 591
- Huenemoerder, Testa & Buzasi (2006) Huenemoerder, D. P., Testa, P., & Buzasi, D. L., 2006, ApJ, 650, 1119
- Hutchinson et al. (1990) Hutchinson, M. G., Evans, A., Winkler, H., & Spencer Jones, J., 1990, A&A, 234, 230
- Jayawardhana et al. (1999) Jayawardhana, R., Hartmann, L., Fazio, G., Fisher, R. S., Telesco, C. M., & Piña, R. K., 1999, ApJ, 520, L41
- Johnson (1966) Johnson, H. L., 1966, ARA&A, 4, 193
- Kastner et al. (2003) Kastner, J. H., Crigger, L., Rich, M., & Weintraub, D. A., 2003, ApJ, 585, 878
- Kastner et al. (2005) Kastner, J. H., Franz, G., Grosso, N., Bally, J., McCaughrean, M. J., Getman, K., Feigelson, E. D., & Schulz, N. S., 2005, ApJS, 160, 511
- Kastner et al. (2004a) Kastner, J. H., Huenemoerder, D. P., Schulz, N. S., Canizares, C. R., Li, J., & Weintraub, D. A., 2004a, ApJ, 605, L49
- Kastner et al. (2002) Kastner, J. H., Huenemoerder, D. P., Schulz, N. S., Canizares, C. R., & Weintraub, D. A., 2002, ApJ, 567, 434
- Kastner et al. (2004b) Kastner, J. H., et al., 2004b, Nature, 430, 429
- Kastner et al. (2006) Kastner, J. H., et al., 2006, ApJ, 648, L43
- Kastner et al. (1997) Kastner, J. H., Zuckerman, B., Weintraub, D. A., & Forveille, T., 1997, Science, 277, 67
- Krist et al. (2000) Krist, J. E., Stapelfeldt, K. R., Ménard, F., Padgett, D. L., & Burrows, C. J., 2000, ApJ, 538, 793
- Maggio et al. (2007) Maggio, A., Flaccomio, E., Favata, F., Micela, G., Sciortino, S., Feigelson, E. D., & Getman, K. V., 2007, ApJ, 660, 1462
- Marshall, Dewey & Ishibashi (2004) Marshall, H. L., Dewey, D., & Ishibashi, K., 2004, in X-Ray and Gamma-Ray Instrumentation for Astronomy XIII. Edited by Flanagan, Kathryn A.; Siegmund, Oswald H. W. Proceedings of the SPIE, Volume 5165, pp. 457-468 (2004)., ed. K. A. Flanagan, O. H. W. Siegmund, Vol. 5165, 457
- Muzerolle et al. (2000) Muzerolle, J., Calvet, N., Briceño, C., Hartmann, L., & Hillenbrand, L., 2000, ApJ, 535, L47
- Ness et al. (2004) Ness, J.-U., Güdel, M., Schmitt, J. H. M. M., Audard, M., & Telleschi, A., 2004, A&A, 427, 667
- Ness & Schmitt (2005) Ness, J.-U., & Schmitt, J. H. M. M., 2005, A&A, 444, L41
- Porquet et al. (2001) Porquet, D., Mewe, R., Dubau, J., Raassen, A. J. J., & Kaastra, J. S., 2001, A&A, 376, 1113
- Preibisch et al. (2005) Preibisch, T., et al., 2005, ApJS, 160, 401
- Reid (2003) Reid, N., 2003, MNRAS, 342, 837
- Robrade & Schmitt (2006) Robrade, J., & Schmitt, J. H. M. M., 2006, A&A, 449, 737
- Schmitt et al. (2005) Schmitt, J. H. M. M., Robrade, J., Ness, J.-U., Favata, F., & Stelzer, B., 2005, A&A, 432, L35
- Smith et al. (2001) Smith, R. K., Brickhouse, N. S., Liedahl, D. A., & Raymond, J. C., 2001, ApJ, 556, L91
- Song, Zuckerman & Bessell (2003) Song, I., Zuckerman, B., & Bessell, M. S., 2003, ApJ, 599, 342
- Song, Zuckerman & Bessell (2004) Song, I., Zuckerman, B., & Bessell, M. S., 2004, ApJ, 603, 804
- Stelzer et al. (2007) Stelzer, B., Flaccomio, E., Briggs, K., Micela, G., Scelsi, L., Audard, M., Pillitteri, I., & Güdel, M., 2007, A&A, 468, 463
- Stelzer & Schmitt (2004) Stelzer, B., & Schmitt, J. H. M. M., 2004, A&A, 418, 687
- Telleschi et al. (2007a) Telleschi, A., Güdel, M., Briggs, K. R., Audard, M., & Palla, F., 2007a, A&A, 468, 425
- Telleschi et al. (2007b) Telleschi, A., Güdel, M., Briggs, K. R., Audard, M., & Scelsi, L., 2007b, A&A, 468, 443
- Testa, Drake & Peres (2004) Testa, P., Drake, J. J., & Peres, G., 2004, ApJ, 617, 508
- Testa et al. (2007) Testa, P., Drake, J. J., Peres, G., & Huenemoerder, D. P., 2007, ApJ, in press
- Torres et al. (2003) Torres, G., Guenther, E. W., Marschall, L. A., Neuhäuser, R., Latham, D. W., & Stefanik, R. P., 2003, AJ, 125, 825
- Uchida et al. (2004) Uchida, K. I., et al., 2004, ApJS, 154, 439
- Webb et al. (1999) Webb, R. A., Zuckerman, B., Platais, I., Patience, J., White, R. J., Schwartz, M. J., & McCarthy, C., 1999, ApJ, 512, L63
- Zuckerman & Song (2004) Zuckerman, B., & Song, I., 2004, ARA&A, 42, 685
- Zuckerman et al. (2001) Zuckerman, B., Webb, R. A., Schwartz, M., & Becklin, E. E., 2001, ApJ, 549, L233
| EW(H) | ||||
|---|---|---|---|---|
| Object | Sp. Type | (Å) | (mag) | (mag) |
| HD 98800 | K5aaHierarchical quadruple system. | 0 | 1.1 | 0.0 |
| Hen 3-600 | M3bbSpectroscopic binary.,M3.5 | 0.7 | ||
| TW Hya | K7 |
| Ion | aa Measured line fluxes for first orders, with uncertainties. Fluxes are for . | bb Line fluxes predicted by the emission measure and abundance model. Lines which are known to be density sensitive (He-like and lines), or which had very large residuals, were not used in the emission measure fit and are enclosed in parentheses. | ||
|---|---|---|---|---|
| [K] | [Å] | |||
| Fe xxv | 7.8 | 1.850 | 0.80 (0.60) | 0.28 |
| Ar xviii | 7.7 | 3.749 | 0.36 (0.32) | 0.17 |
| Ar xvii | 7.4 | 3.935 | 0.39 (0.32) | 0.31 |
| S xv | 7.3 | 4.075 | 0.23 (0.30) | 0.05 |
| S xvi | 7.6 | 4.739 | 0.70 (0.60) | 0.77 |
| S xv | 7.2 | 5.026 | 1.94 (0.60) | 1.19 |
| S xv | 7.2 | 5.060 | 0.60 (0.50) | 0.28 |
| S xv | 7.2 | 5.101 | 0.90 (0.50) | 0.41 |
| Si xiv | 7.4 | 5.242 | 0.00 (0.10) | (0.19) |
| Si xiv | 7.4 | 6.182 | 1.93 (0.50) | 1.38 |
| Si xiii | 7.0 | 6.648 | 2.34 (0.80) | 1.77 |
| Si xiii | 7.0 | 6.687 | 1.60 (0.70) | (0.34) |
| Si xiii | 7.0 | 6.740 | 1.30 (0.57) | 0.73 |
| Mg xii | 7.2 | 7.109 | 0.32 (0.22) | 0.23 |
| Mg xi | 6.9 | 7.305 | 0.06 (0.13) | (0.03) |
| Mg xii | 7.2 | 8.421 | 2.18 (0.60) | 1.74 |
| Mg xi | 6.8 | 9.169 | 2.20 (0.70) | 1.45 |
| Mg xi | 6.8 | 9.314 | 1.33 (0.50) | (0.69) |
| Ne x | 7.0 | 10.239 | 3.50 (0.90) | 3.49 |
| Fe xxiii | 7.2 | 10.979 | 1.19 (0.58) | 0.61 |
| Fe xxiv | 7.4 | 11.177 | 2.36 (0.70) | 0.81 |
| Fe xviii | 6.8 | 11.533 | 0.28 (0.97) | (0.41) |
| Ne ix | 6.6 | 11.543 | 1.60 (0.96) | 2.09 |
| Fe xxiii | 7.2 | 11.741 | 1.84 (0.74) | 1.32 |
| Fe xxii | 7.1 | 11.774 | 1.38 (0.67) | 1.45 |
| Ne x | 6.9 | 12.134 | 33.35 (3.49) | 26.31 |
| Fe xvii | 6.7 | 12.269 | 1.20 (0.90) | 1.35 |
| Fe xxi | 7.1 | 12.281 | 5.08 (1.30) | 3.25 |
| Ne ix | 6.6 | 13.447 | 22.55 (3.19) | 17.51 |
| Ne ix | 6.6 | 13.553 | 3.69 (2.99) | (2.84) |
| Ne ix | 6.6 | 13.699 | 10.58 (2.99) | (9.03) |
| Fe xviii | 6.8 | 14.205 | 5.75 (1.90) | 4.48 |
| Fe xviii | 6.8 | 14.377 | 4.31 (1.92) | 1.15 |
| O viii | 6.7 | 14.809 | 2.31 (1.79) | 1.22 |
| Fe xvii | 6.7 | 15.014 | 15.85 (4.98) | 14.38 |
| Fe xvii | 6.7 | 15.261 | 5.98 (2.99) | 4.06 |
| O viii | 6.7 | 16.006 | 10.96 (4.48) | 8.89 |
| Fe xviii | 6.8 | 16.071 | 5.18 (4.18) | 1.63 |
| Fe xvii | 6.7 | 16.780 | 9.36 (3.98) | 6.52 |
| Fe xvii | 6.7 | 17.051 | 14.44 (5.68) | 7.73 |
| Fe xvii | 6.7 | 17.096 | 8.37 (5.88) | 7.25 |
| O vii | 6.4 | 18.627 | 18.25 (5.09) | 3.16 |
| O viii | 6.7 | 18.969 | 82.75 (11.96) | 68.28 |
| O vii | 6.3 | 21.605 | 25.50 (9.56) | 25.14 |
| O vii | 6.3 | 21.805 | 31.18 (11.46) | (3.41) |
| O vii | 6.3 | 22.092 | 34.66 (11.85) | (14.03) |
| N vii | 6.5 | 24.780 | 33.87 (13.03) | 25.07 |
| Ion | aa and refer to the photon fluxes of the stellar components. | ||||
|---|---|---|---|---|---|
| [K] | [Å] | flux ( ) | |||
| Fe xxvbbFlux measured from the 0th order spectrum of source B; the feature is not detected in the 0th order spectrum of source A. | 7.8 | 1.854 | … | … | 0.8 (0.6)ccQuantities in parentheses are the confidence intervals. |
| Si xiv | 7.2 | 6.182 | 0.55 (0.15) | 0.68 (0.18) | 1.25 (0.32) |
| Si xiii | 7.0 | 6.648 | 0.55 (0.15) | 0.83 (0.27) | 1.51 (0.48) |
| Si xiii | 7.0 | 6.687 | 0.55 (0.15) | 0.57 (0.25) | 1.03 (0.45) |
| Si xiii | 7.0 | 6.740 | 0.55 (0.15) | 0.46 (0.20) | 0.84 (0.38) |
| Mg xii | 7.0 | 8.421 | 0.30 (0.13) | 0.50 (0.14) | 1.68 (0.45) |
| Mg xi | 6.8 | 9.169 | 0.30 (0.13) | 0.51 (0.18) | 1.69 (0.55) |
| Mg xi | 6.8 | 9.314 | 0.30 (0.13) | 0.31 (0.12) | 1.02 (0.36) |
| Ne x | 6.8 | 10.239 | 0.30 (0.14) | 0.73 (0.21) | 2.76 (0.70) |
| Ne x | 6.8 | 12.134 | 0.15 (0.13) | 4.40 (0.40) | 29.0 (3.0) |
| Ne ix | 6.6 | 13.447 | 1.0 (0.9) | 11.3 (2.0) | 11.3 (2.0) |
| Ne ix | 6.6 | 13.553 | 0.66 (0.27) | 1.5 (1.3) | 2.2 (1.9) |
| Ne ix | 6.6 | 13.699 | 0.66 (0.27) | 4.2 (1.3) | 6.4 (1.9) |
| Fe xvii | 6.7 | 15.014 | 0.50 (0.19) | 5.3 (1.7) | 10.6 (3.5) |
| Fe xvii | 6.7 | 15.261 | 0.50 (0.19) | 2.0 (0.9) | 4.0 (2.0) |
| O viii | 6.5 | 16.006 | 0.50 (0.19) | 3.7 (1.5) | 7.3 (2.8) |
| Fe xviii | 6.8 | 16.071 | 0.50 (0.19) | 1.7 (1.2) | 3.5 (2.3) |
| Fe xvii | 6.7 | 16.780 | 0.50 (0.19) | 3.1 (1.5) | 6.3 (2.5) |
| Fe xvii | 6.7 | 17.051 | 0.50 (0.19) | 4.8 (1.9) | 9.7 (3.7) |
| Fe xvii | 6.7 | 17.096 | 0.50 (0.19) | 2.8 (1.9) | 5.6 (3.8) |
| O viii | 6.5 | 18.969 | 0.75 (0.40) | 34.0 (6.0) | 49.0 (7.0) |
| O vii | 6.3 | 21.602 | 2.0 (1.5) | 13 (7) | 6.5 (3) |
| O vii | 6.3 | 21.804 | 2.0 (1.5) | 21 (7) | 11 (4) |
| O vii | 6.3 | 22.098 | 2.0 (1.5) | 19 (8) | 9.7 (4) |
| Element | aaAbundance relative to Solar values of Anders & Grevesse (1989). | bbAbundance ratio relative to Solar oxygen abundance ratio, or . |
|---|---|---|
| N | 1.62 (0.74)ccValues in parentheses are uncertainties. | 3.86 (1.90) |
| O | 0.42 (0.08) | 1.00 … |
| Ne | 1.17 (0.10) | 2.79 (0.59) |
| Mg | 0.29 (0.07) | 0.68 (0.22) |
| Si | 0.39 (0.10) | 0.92 (0.29) |
| S | 0.75 (0.31) | 1.78 (0.81) |
| Fe | 0.20 (0.03) | 0.48 (0.12) |
| Element | Feature | ratio() | ratio() | ||
|---|---|---|---|---|---|
| () | () | [MK] (90% confidence) | |||
| Si | Ly/He- | 0.82 (0.34) | 7.8 (6.2–8.2) | ||
| Mg | Ly/He- | 0.99 (0.42) | 8.0 (6.2–9.0) | ||
| Ne | Ly/He- | 0.39 (0.08) | 2.56 (0.50) | 3.8 (3.4–4.0) | 6.7 (6.0–7.0) |
| O | Ly/He- | 2.6 (1.5) | 7.5 (3.6) | 3.2 (2.6–3.8) | 5.0 (3.8–5.8) |
| Ratio | aaRatio of abundances relative to the Solar ratio from Anders & Grevesse (1989). | ||
|---|---|---|---|
| Ne/O | 3.68 (0.89)bbValues in parenthesis are uncertainties. | 3.43 (0.67) | 3.56 (0.56) |
| Mg/O | 2.02 (0.82) | 1.13 (0.40) | 1.26 (0.46) |
| Si/O | 4.79 (2.65) | 1.47 (0.93) | 2.02 (1.40) |
| Fe/O | 0.69 (0.26) | 0.31 (0.12) | 0.39 (0.14) |