Anti-phase Modulation of Electron- and Hole-like States in Vortex Core of Probed by Scanning Tunneling Spectroscopy
Abstract
In the vortex core of slightly overdoped \bi, the electron-like and hole-like states have been found to exhibit spatial modulations in anti-phase with each other along the Cu-O bonding direction. Some kind of one-dimensionality has been observed in the vortex core, and it is more clearly seen in differential conductance maps at lower biases below 9 mV.
The electronic states of vortex cores in type-II superconductors are closely related with the nature of the superconductivity. As superconductivity is suppressed near the vortex, in BCS superconductors, quasi-particles are confined in the vortex core by a pair potential reflecting the orbital symmetry of a Cooper pair, or in highly correlated electron system superconductors other ordered states competing with superconductivity may appear. As scanning tunneling microscopy and spectroscopy (STM/STS) are able to measure the quasi-particle density of states in atomic length scale, microscopic STM/STS studies of vortex cores will give us valuable information to understand superconductivity. In BCS superconductors, the vortex core bound states have been detected in 2H-NbSe2 [1] and YNi2B2C [2] and can be interpreted in terms of the Bogoliubov-de Gennes equation. In high-Tc cuprate superconductors, vortex core states have been detected in YBa2Cu3O7 [3] and \bi[4, 5] by STM/STS, but they cannot be interpreted in terms of BCS -superconductors. In \bi, it has been found that the vortex core state exhibits a spatial modulation of STM conductance with a period of about 4 [6, 5] and the modulation is nondispersive [7]. Other competing orders might occur in the vortex core. Even in a zero magnetic field, STM/STS have revealed the tendency to exhibit a charge order in high-Tc superconductors: Above , the pseudo-gap state in slightly underdoped \bi has been found to exhibit a spatial modulation with an incommensurate periodicity (4.7) [8]. In very underdoped and insulating regions, spatial modulations have been observed: an incommensurate one (4.5) in \bi[9] and a commensurate one (4) in Ca2-xNaxCuO2Cl2 [10]. For the present it is not clear how the conductance modulations in different situations are related with one another. In this paper, we report high-resolution STS measurements of vortex cores in slightly overdoped \bi. Anti-phase modulation of electron-like and hole-like core states has been discovered and some kind of one-dimensionality has been found in the vortex core.
The STS measurements were carried out by using a laboratory-made scanning tunneling microscope which is able to be operated at temperatures down to 2.2 K in magnetic fields up to 17 T. A mechanically-sharpened PtIr tip was used. A single crystal sample of \bi was grown by the traveling solvent floating zone method. It is slightly overdoped and the critical temperature is 86 K. A clean surface was prepared by cleaving the sample at 4.2 K in a He atmosphere. We have measured a spatial distribution of the superconducting energy gap by STS; the average value was 37.8 meV and the variance was 4.8 meV. A degree of disorder in ref. [11] was 0.126.
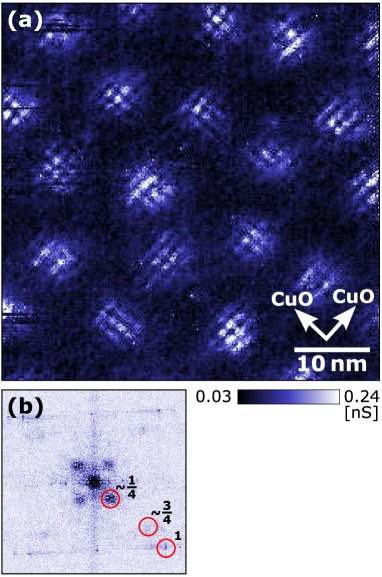
We have observed vortex cores at 4.2 K in 14.5 T in five regions of 50 nm 50 nm on the cleaved surface of \bi by STS; a typical result is shown in Fig. 1 (a). The data taking procedure is as follows: an STM image of 256 256 points is obtained by scanning the tip on the sample surface at a tunneling current of 0.1 nA and a sample bias of +191 mV. Simultaneously, a differential conductance is measured by using a lock-in amplifier with a modulation bias of 1 . Previously we reported that vortex core states are situated at 9 meV in the energy gap [5]. By mapping with a color scale, the core can be imaged as shown in Fig. 1 (a). The vortices have been clearly imaged as white regions. A periodic structure along Cu-O bonding directions has been observed in each core. This pattern was called ‘checkerboard’ in ref. [6]. We would rather call this a ‘tile and joint’ pattern, as will be explained later. The Fourier transform is shown in Fig. 1 (b). Three kinds of important spots are seen, as indicated by circles: the spots with are due to Bi atoms of the BiO surface and the other two with and are from the vortex core. The average periods of the periodic structure are (4.3 0.2) and (1.34 0.02).
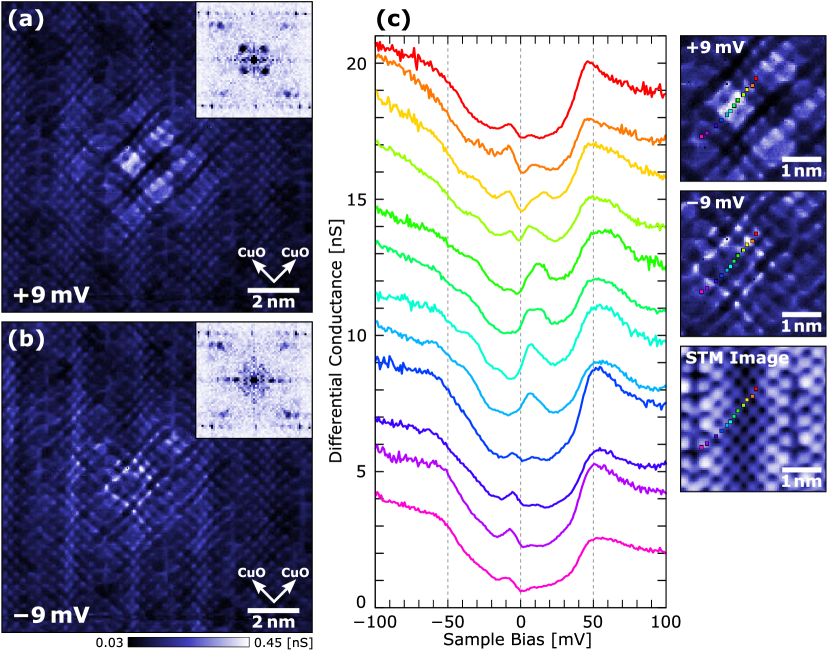
We have scrutinized five vortices at 4.2 K in 14.5 T by STM/STS with a spatial resolution of 0.47 Å. The typical results for one vortex are shown in Fig. 2: (a) a d/d image of the electron-like core state at +9 mV and (b) that of the hole-like core state at 9 mV. The modulated pattern of the vortex core at 9 mV looks like ‘tile and joint’ rather than ‘checkerboard’. Looking at Figs. 2 (a) and (b) carefully, you will notice that the bright positions of coincide with the dark positions of . It means that in the vortex core the electron-like and hole-like states exhibit anti-phase spatial variation in intensity. The vortex core has been more clearly imaged at the positive bias than at the negative one, as is reported before [5]. Outside the vortex, the in-phase variations of d/d have been observed at both positive and negative biases. The atoms and the superstructure have been observed. The Fourier transforms of one vortex image in Figs. 2 (a) and (b) are shown in the insets. At +9 mV, the spots of 1/4 and 3/4 have been recognized. The 1/4 spots have been found to be two-fold symmetric. This will be discussed later. At 9 mV, the 3/4 spots are observed clearly, but those of 1/4 are found to be very weak, compared to at the positive bias.
Tunneling spectra have been measured in the vortex core along the Cu-O bonding direction with spacings of about 2 Å (Fig. 2 (c)): The measured positions are shown with square marks in maps and the atomic STM image; the colors indicate the corresponding spectra. The vortex core states are recognized as peaks at about 9 mV inside the energy gap. From the top, in the first to third spectra, the peak at a negative bias is more outstanding than that at a positive bias. In the next fourth to eighth spectra, a reverse situation is seen; the intensity at a positive bias is higher than the other. In the last four spectra, the situation has been reversed again. The anti-phase spatial variation of electron-like and hole-like core states has been confirmed. The 3/4 modulation has been found to be in-phase, because 3/4 peaks vanish in the Fourier transform of the normalized by . The results of the other four vortices investigated in the same manner are summarized as follows: Three vortices have exhibited the same anti-phase variation. In the other vortex where the insulating tunneling spectra have been observed around the center, the tile and joint pattern was not observed and similar d/d images were obtained at positive and negative biases; the core states are found to be much influenced by defects. We have concluded that the anti-phase correlation is intrinsic to a vortex core in \bi. In the tunneling spectra of Fig. 2 (c), it is noticed that the peak energy of the core states fluctuates from site to site over a length scale of a few angstroms. We speculate that the peak energy might be influenced by the excess oxygen atoms found by McElroy et al. [12].
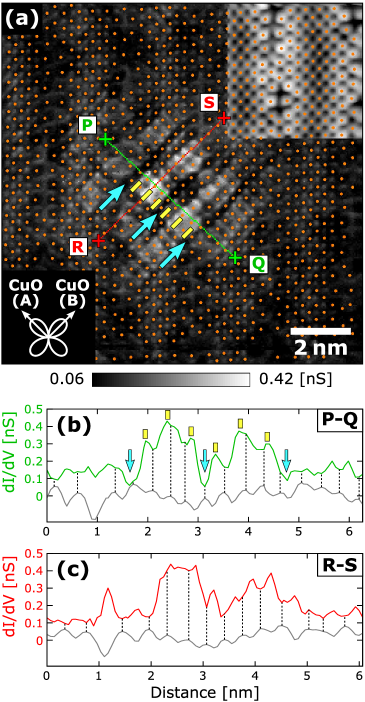
In Fig. 2 (a), the one-dimensional nature will be noticed in the tile and joint pattern of the vortex; the joints along one Cu-O direction are more clearly seen than those along the other. In order to know more clearly the situation, the same image is shown in Fig. 3 (a) with Bi atom positions marked by orange dots; the STM atomic image is shown in the upper right corner. The d/d line profiles along the green and red lines are shown in Figs. 3 (b) and (c) with the atomic profiles. As indicated by blue arrows, three dark lines have been observed along the atomic rows: the spacing is exactly 4. The tile and joint pattern is found to have commensurate modulation along the CuO(A) direction. Three peaks of d/d are observed between the dark lines, as shown by yellow bars. This fine structure corresponds to the 3/4 spot in the Fourier transform. Along the CuO(B) direction, as it is difficult to get a precise period from the real space image, the modulation period is determined to be 4.3 from the Fourier transform (Fig. 2 (a)), indicating incommensurate variation along the CuO(B) direction. It should be noted that different commensurability is observed in the two Cu-O bonding directions. In the other vortex investigated, the dark lines were observed along the CuO(A) direction. In the vortex core, two Cu-O bonding directions have become non-equivalent. In fact, looking at Fig. 1 (a) carefully, you can see some directionality along different Cu-O bonding directions from vortex to vortex. A similar directional feature has been observed at a negative bias of 9 mV.
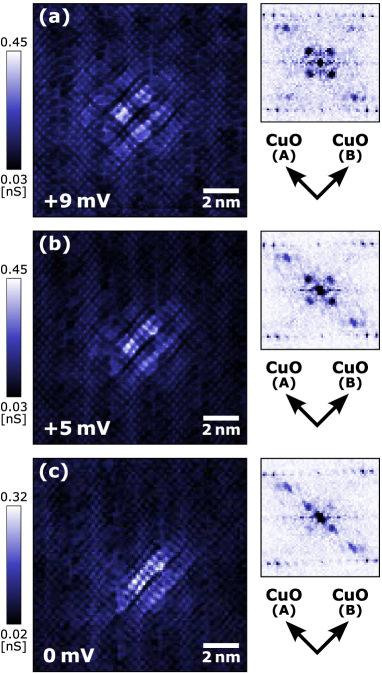
At different biases lower or higher than +9 mV, the same vortex core was imaged by mapping d/d; the results at 0 and +5 mV are shown in Figs. 4 with that of +9 mV; the Fourier transforms are also shown. With decreasing a bias down to +5 and 0 mV [Figs. 4 (b) and (c)], the one-dimensional nature has become more outstanding; at +5 mV [Fig. 4 (b)], the dark line along the CuO(B) direction between two tiles become clearer. The 3/4 spots have become vague along the CuO(B) direction, while the 1/4 spots are still observed in the two directions. At 0 mV [Fig. 4 (c)], the 1/4 spots have become vague along the CuO(B) direction and the 3/4 spots have disappeared. Similar features were observed at negative biases. Thus, it has been found that the vortex core state exhibits a two-fold symmetry at low energy rather than a four-fold one. The origin of these features is unknown, but the results will give valuable information to understand the conductance modulation in the vortex core.
The results at higher biases are described briefly: the tile and joint pattern became unclear at 17 mV and it was invisible at 20 mV. In the center region of the vortex core, only low energy states are present and the states above 20 mV are not present.
In order to explain the electronic states of a vortex core in high temperature cuprate superconductors, many theoretical proposals have been made. The theories [13, 14, 15] based on the BCS superconductor have failed in explaining the experimental findings of vortex core states, especially those revealed by STM/STS experiments. When the superconductivity is weakened, similar modulated patterns were observed in a zero magnetic field [8, 10, 9, 17]. These ordered states may appear in the vortex core. Vershinin et al. found a modulation in \bi above , that is, in the pseudo-gap state [8]. The modulation is observed inside an energy gap ( 40 meV). The energy of the vortex core states, which we have observed with spatial modulation, is restricted to 20 meV; at high temperatures, they are smeared out by thermal fluctuations. In order to relate the core states with a pseudo-gap state, we need more theoretical considerations, though it was proposed that the core states correspond to the pseudo-gap state at low temperatures [16, 7]. Hanaguri et al. and McElroy et al. found spatial modulations in very underdoped cuprates: [10] and \bi[9]. They are observed at 100 meV in and at 65 100 meV in \bi. These electronic states seem to be different from the core states, as the energy range where modulations have been observed is very different. Machida et al. found a conductance modulation at 0 15 meV in a single layer cuprate [17] ( 34 K). The tunneling spectra are very similar to those in the vortex core. The close similarity is interesting. In order to compare the above-mentioned states with the vortex core states, it is necessary to study the phase relation of the modulation in electron-like and hole-like states.
In summary, in the vortex core of slightly overdoped \bi, it has been found that the electron-like and hole-like states exhibit the anti-phase spatial modulation along the Cu-O bonding directions and that at low energy below 9 meV, the two Cu-O bonding directions are non-equivalent and the vortex core states have a two-fold symmetry rather than a four-fold one of outside. The modulation period along one Cu-O direction is 4.3 (incommensurate) and that along the other is 4.0 (commensurate). Some ordered state must be realized in the vortex core at low energy.
We acknowledge T. Okumura, Y. Kiuchi, Y. Kikuchi, T. Ogawa and N. Kosugi for data taking and analyses in the early stage of the experiment. This work was supported in part by a Grant-in-Aid for Scientific Research of the Ministry of Education, Culture, Sports, Science and Technology (grant No.14204035) and a 21st Century COE Program at Tokyo Tech “Nanometer-Scale Quantum Physics.” One of the authors (K.M.) acknowledges Research Fellowships of the Japan Society for the Promotion of Science for Young Scientists.
References
- [1] H. F. Hess, R. B. Robinson, R. C. Dynes, J. M. Valles, Jr. and J. V. Waszczak: Phys. Rev. Lett. 62 (1989) 214.
- [2] H. Nishimori, K. Uchiyama, S. Kaneko, A. Tokura, H. Takeya, K. Hirata and N. Nishida: J. Phys. Soc. Jpn. 73 (2004) 3247.
- [3] I. Maggio-Aprile, Ch. Renner, A. Erb, E. Walker and Ø. Fischer: Phys. Rev. Lett. 75 (1995) 2754.
- [4] S. H. Pan, E. W. Hudson, A. K. Gupta, K.-W. Ng, H. Eisaki, S. Uchida and J. C. Davis: Phys. Rev. Lett. 85 (2000) 1536.
- [5] K. Matsuba, H. Sakata, N. Kosugi, H. Nishimori and N. Nishida: J. Phys. Soc. Jpn. 72 (2003) 2153.
- [6] J. E. Hoffman, E. W. Hudson, K. M. Lang, V. Madhavan, H. Eisaki, S. Uchida and J. C. Davis: Science 295 (2002) 466.
- [7] G. Levy, M. Kugler, A. A. Manuel, and Ø. Fischer: Phys. Rev. Lett. 95 (2005) 257005.
- [8] M. Vershinin, S. Misra, S. Ono, Y. Abe, Y. Ando and A. Yazdani: Science 303 (2004) 1995.
- [9] K. McElroy, D.-H. Lee, J. E. Hoffman, K. M. Lang, J. Lee, E. W. Hudson, H. Eisaki, S. Uchida and J. C. Davis: Phys. Rev. Lett. 94 (2005) 197005.
- [10] T. Hanaguri, C. Lupien, Y. Kohsaka, D.-H. Lee, M. Azuma, M. Takano, H. Takagi and J. C. Davis: Nature 430 (2004) 1001.
- [11] K. Matsuba, H. Sakata, T. Mochiku, K. Hirata and N. Nishida: Physica C 388-389 (2003) 281.
- [12] K. McElroy, J. Lee, J. A. Slezak, D.-H. Lee, H. Eisaki, S. Uchida and J. C. Davis: Science 309 (2005) 1048.
- [13] Y. Wang and A. H. MacDonald: Phys. Rev. B 52 (1995) R3876.
- [14] M. Franz and Z. Tešanović: Phys. Rev. Lett. 80 (1998) 4763.
- [15] K. Yasui and T. Kita: Phys. Rev. Lett. 83 (1999) 4168.
- [16] Ch. Renner, B. Revaz, K. Kadowaki, I. Maggio-Aprile and Ø. Fischer: Phys. Rev. Lett. 80 (1998) 3606.
- [17] T. Machida, Y. Kamijo, K. Harada, T. Noguchi, R. Saito, T. Kato and H. Sakata: J. Phys. Soc. Jpn. 75 (2006) 083708.