Exhaustive exploration of Prisoner’s Dilemma parameter space in one-dimensional cellular automata
Abstract
The Prisoner’s Dilemma (PD) is one of the most popular games of the Game Theory due to the emergence of cooperation among competitive rational players. In this paper, we present the PD played in cells of one-dimension cellular automata, where the number of possible neighbors that each cell interacts, , can vary. This makes possible to retrieve results obtained previously in regular lattices. Exhaustive exploration of the parameters space is presented. We show that the final state of the system is governed mainly by the number of neighbors and there is a drastic difference if it is even or odd.
I Introduction
Due to the emergence of cooperation between competitive rational players stauffer2004 ; bouchaud2002 ; anteneodo2002 ; turner1999 , the Prisoner’s Dilemma (PD) dresher ; poundstone1992 is one of the most popular games of the Game Theory neumann1947 . When it is played repeatedly, one has the Iterated Prisoner’s Dilemma axelrod1981 ; axelrod1984 . If the PD is played in a group of players with spatial structure, this version is known as Spatial Prisoner’s Dilemma (SPD) nowak1992 . These spatial structures may generate chaotically changing spatio-temporal patterns. Cooperators and defectors coexist, and cooperator proportion oscillates indefinitely. This occurs when each player interacts with the nearest neighbors, for instance, in a square lattice. Moreover, adding the interaction with the next nearest neighbors (corresponding to the chess king possible moves) the spatial patterns are smoother. During the game, cooperators and defectors organize themselves in clusters. The most interesting dynamics occurs on the borders of these clusters, causing the oscillating behavior of the proportion of cooperators.
The final proportion of cooperators and defectors in the chaotic phase depends on the initial configuration and the magnitude of the parameter (temptation). Moreover, the connectivity among players also plays an important role in the dynamics of the clusters duran2005 . Studies about PD had been carried out in different topologies such as square lattice nowak1992 , graphs nowak2005 and also in complex networks as random graphs duran2005 , scale-free networks wu2007 , small-word networks abramson2001 . We have used the simplest lattice topology, i.e. one-dimensional lattice to represent regular lattices at any dimensionality marcelo2007 . The computational implementation of PD in the one-dimensional case is simpler than in other topologies, and it requires less computational time to run the numerical codes. In one-dimensional cellular automata, it is simpler to understand the way that oscillations in the cooperator proportion take place marcelo2007 . Beyond the topologies, it is also possible to consider the mobility of players arenzon2007 .
In this paper we present an exhaustive exploration of the parameter space for the IPD in the one-dimensional cellular automata with a variable number of interacting neighbors. After introducing the model in Section II, we show the results in Section III. Final remarks are presented in the Section IV.
II The Model
Consider a cellular automaton in a one-dimensional lattice, with cells, where each cell represents one player, who has two possible states: () for cooperator (defector). The automaton has no empty cells, so the cooperator proportions, , and defectors, , leads to . The initial proportion of cooperators, , , is an important parameter. The state of players, which are chosen randomly by a uniform distribution, are set as cooperators and the remaining ones are set as defectors. The neighborhood of the -th player is defined by . If is even, there are adjacent interacting players to the right and to the left hand side of this player. If is odd, each side has players and player interacts with his/her own state (self-interaction) marcelo2007 ; ricardo2006 ; alves2000 . In addition to and the other free parameter in this model is the temptation in the conflict range .
Consider two players and playing the PD. The payoff of player due to interaction with player is given by , where is the state of player , with . The total payoff, , of player is: , , where is the neighborhood of the -th agent. Since the payoff of each player depends on , the macroscopic regime, , also depends on it. Player will compare to , where is the payoff of set of players. If , player copies the state of the player with the highest payoff, otherwise player does not change his/her current state. The dynamics of the model is totally deterministic. This strategy of copying the state of the neighbor that had the highest payoff is the Darwinian Evolutionary Strategy. Others evolutionary strategies can be adopted, like the Pavlovian one fort2005 . The states of the players are updated synchronously and they play until the system reaches a stationary or dynamical equilibrium regime.
The cooperator proportion, , depends on time, temptation, initial proportion of cooperators, and the number of interacting players. The dependence of as a function of and is commonly neglected, possibly due to the fixed lattice restriction in a -dimensional space.
The asymptotic cooperator proportion, , is obtained when the system reaches the steady state, which represents the final phase for the set of parameters . The dependence of on can be understood due to the number of interacting cooperators, , with , in the neighborhood of each player. When player interacts with cooperators out of neighbors, his/her payoff is duran2005 ; ricardo2006 : . Some useful relations follow immediately: for a cooperator , while for a defector . For , and . Transitions in occur when temptation crosses threshold values. In the conflict range, , these transitions are controlled by duran2005 : , where and are integers.
III Results
We have used a one-dimensional cellular automaton with cells, with cells set as cooperators and the remaining ones as defectors. The asymptotic cooperator proportion, , is obtained from the mean values of an ensemble of 1,000 configurations for the same initial parameters. The parameter increases in steps in the range and increases in steps and the intermediate values are linearly interpolated.
It could seem meaningless to consider , as the cooperators and defectors have the same payoff, when one plays against the other. However, the total payoff of each player depends on the neighborhood, then, if the player belongs to a cooperative cluster he/she has a higher payoff than the player from a defective one. In the cooperative/defective clusters border, the differences among payoffs are essential to determine the system dynamics marcelo2007 .
Results for and are the trivial cases due to the Darwinian Evolutionary Strategy. In a population of cooperators (defectors) it is not possible to emerge a defector (cooperator), because the players only can copy the states of their neighbors. Mutations are not allowed in our model, i.e. the noise of the system is null mukherji1996 .
Our results are equivalent to those obtained in the square lattices, which are briefly reviewed in the following. Consider four scenarios. First, defectors can dominate the system and determine the complete extinction of cooperators, leading the system to a defective phase (). Second, defectors can increase and domain the system, but cooperators are not extinguished, resulting in a defective phase as well (). Third, cooperators may domain the system forming a cooperative phase (). And finally, cooperators can extinguish the defectors determining a cooperative phase ().
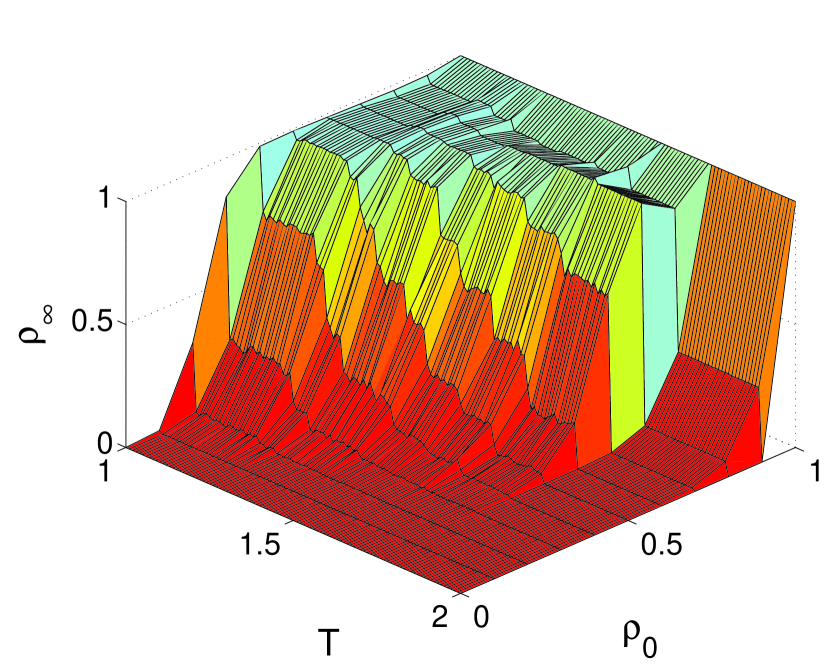
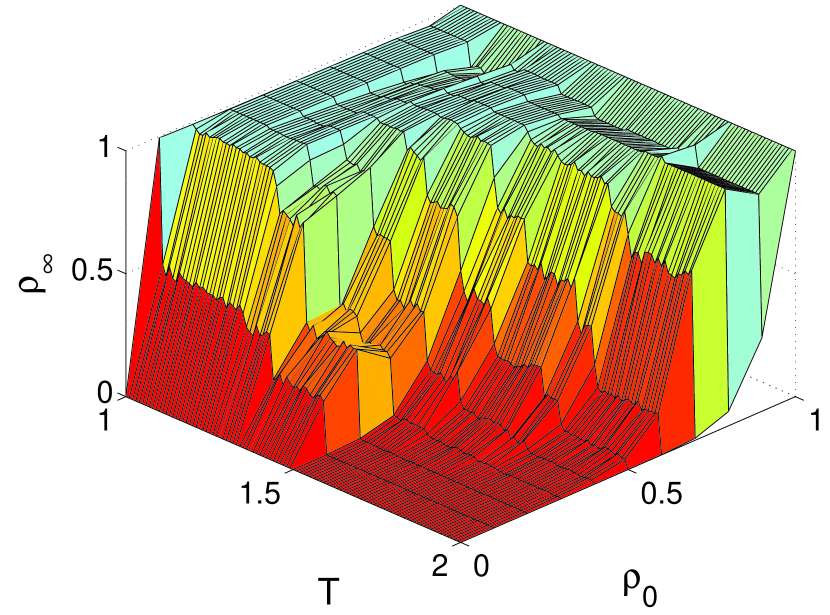
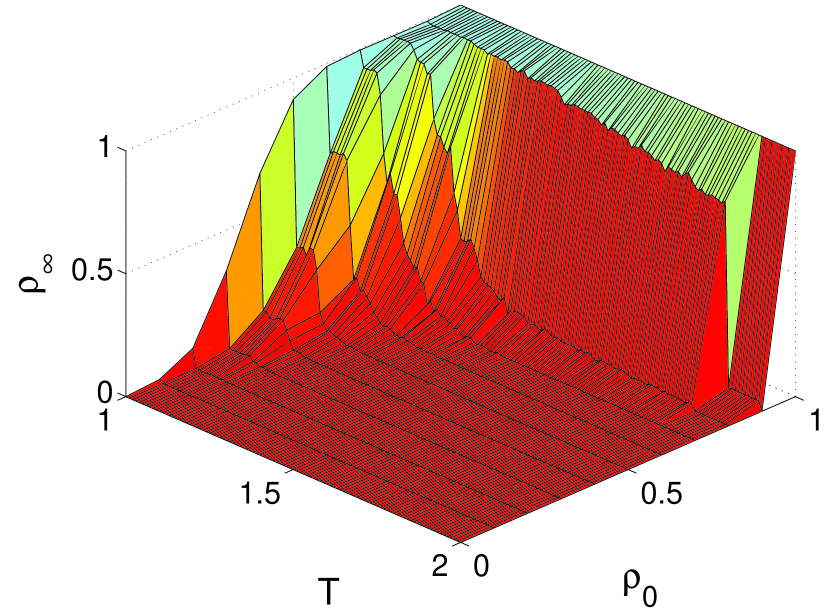
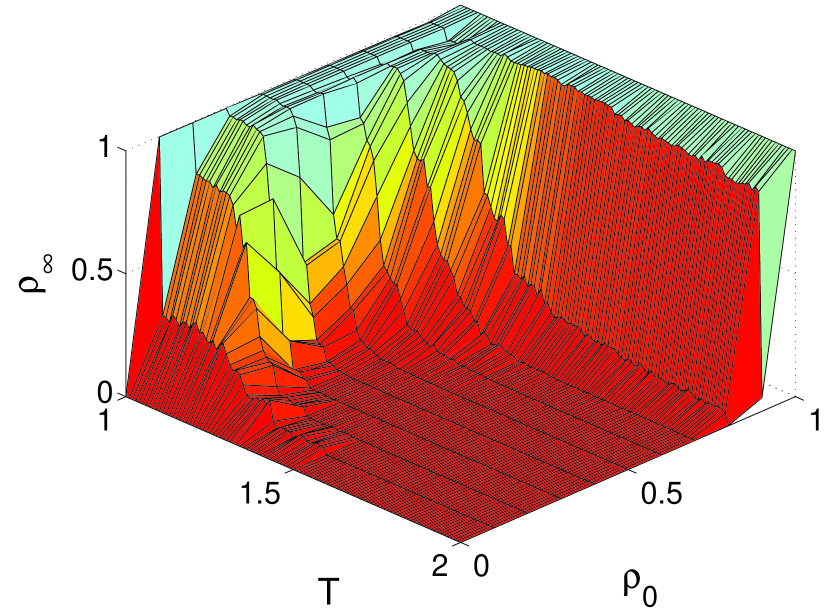
Figures 1a and 1b show the surface of plotted as a function of and , for (without self-interaction) and (with self-interaction), respectively. Differences between the presence/absence of self-interaction are clear. The region of low values of and high values of is a cooperative phase. The region of high values of and low values of is a defective phase. The other two regions, low and low or high and high , the value of is different and depends strongly whether is even or odd. The valleys for are due to the system dynamics. For higher values of , the defective clusters formed are tiny in comparison to the cooperative ones. These defectors exploit theirs cooperator neighbors, but they neither do not invade the cooperative cluster nor are extinguished by the cooperative neighborhood during time evolution.
(a)
(b)
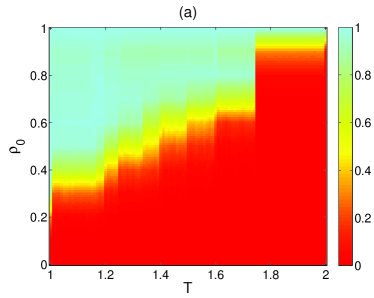
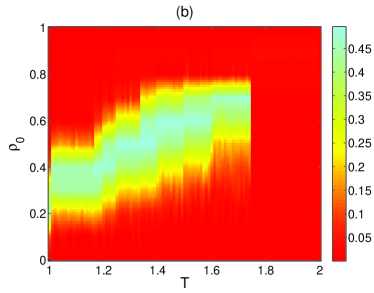
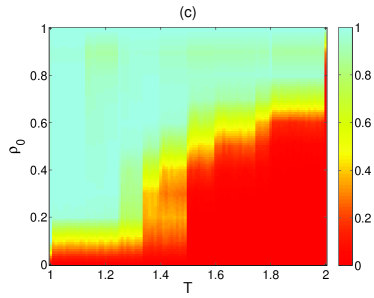
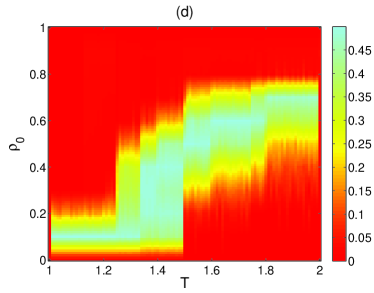
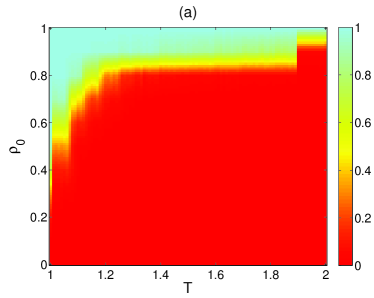
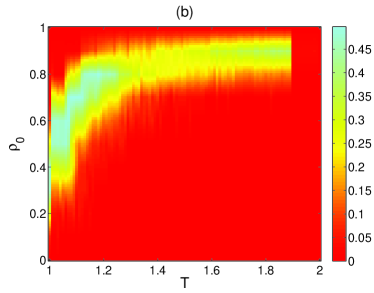
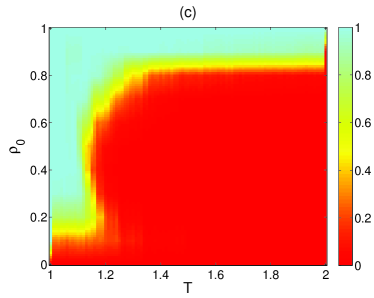
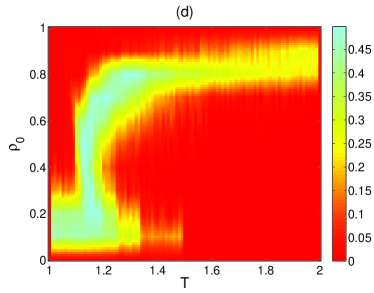
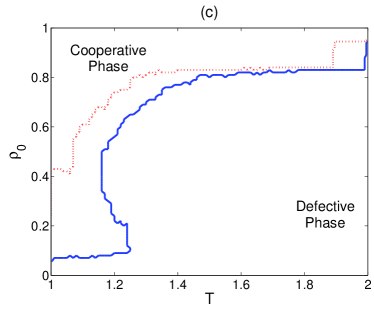
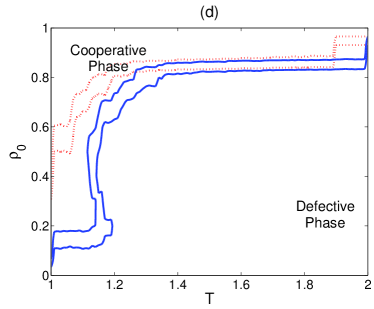
Another visualization of for is given in Figures 2a and 2b, and for in Figures 2c and 2d. It is equivalent to observe the phase diagram plotted as surface in Figures 1a and 1b from the top view. The images 2b and 2d are the standard deviation of due to statistics to avoid the initial configuration dependence. Figures 2b and 2d, show very high values of standard deviation. In these regions, small changes in the initial configuration drastically modify from a cooperative phase, , to a defective phase, . Thus, in this region, it is not possible to define the system as cooperative or defective, and this region is considered as the coexistence of cooperative/defective phases. In other words, the chaotic phase. The inclusion of self-interaction implies in larger cooperation area in the phase diagram as shown in Figures 2a and 2c. This means that cooperation prevails when self-interaction is included. In Figure 2a, drops abruptly for , this rapid decay does not occur in Figure 2c, because self-interaction shifts to higher values. In Figure 2d, the higher values of standard deviation fulfill a larger area, especially for , for the same reasons. When is shifted, a region that should be cooperative, when the self-interaction is present, becomes defective in the absence of the self-interaction.
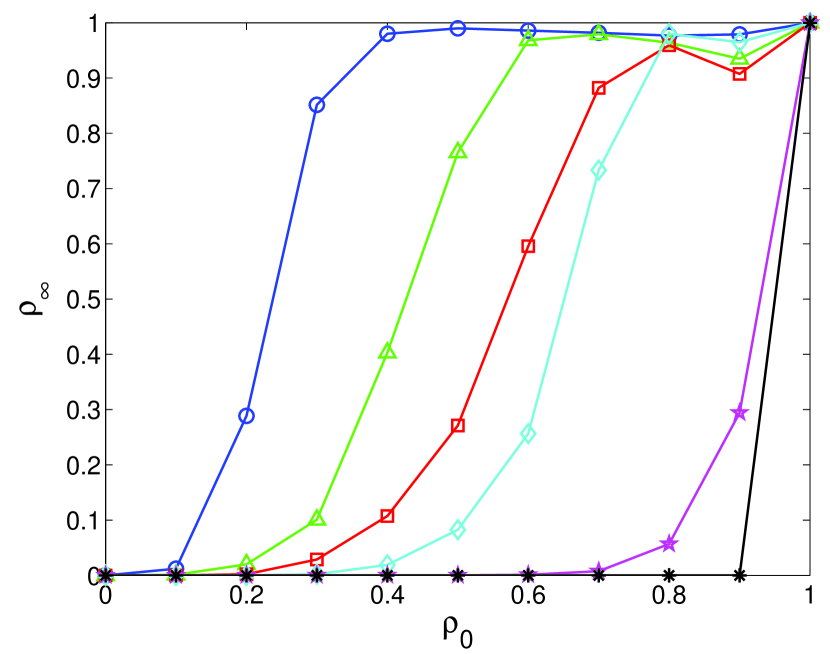
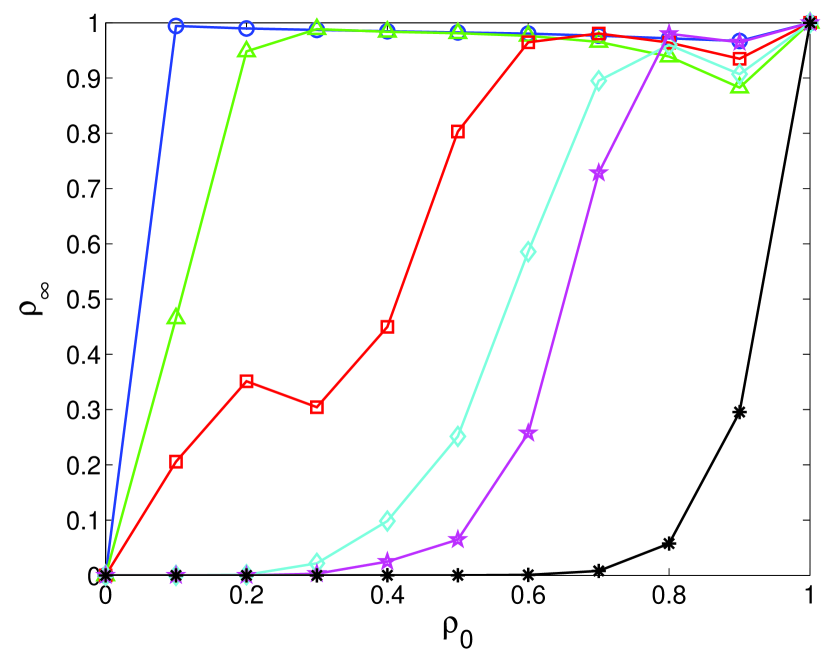
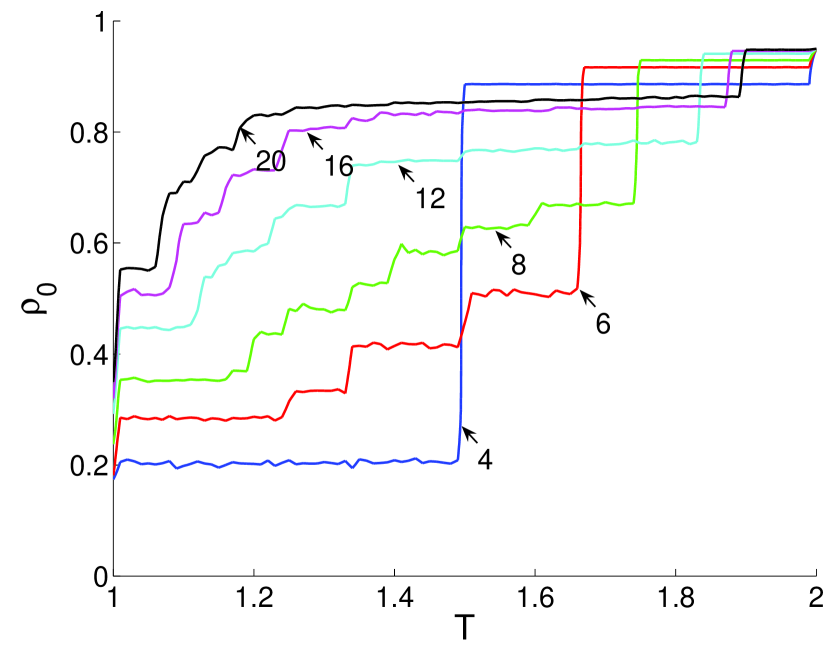
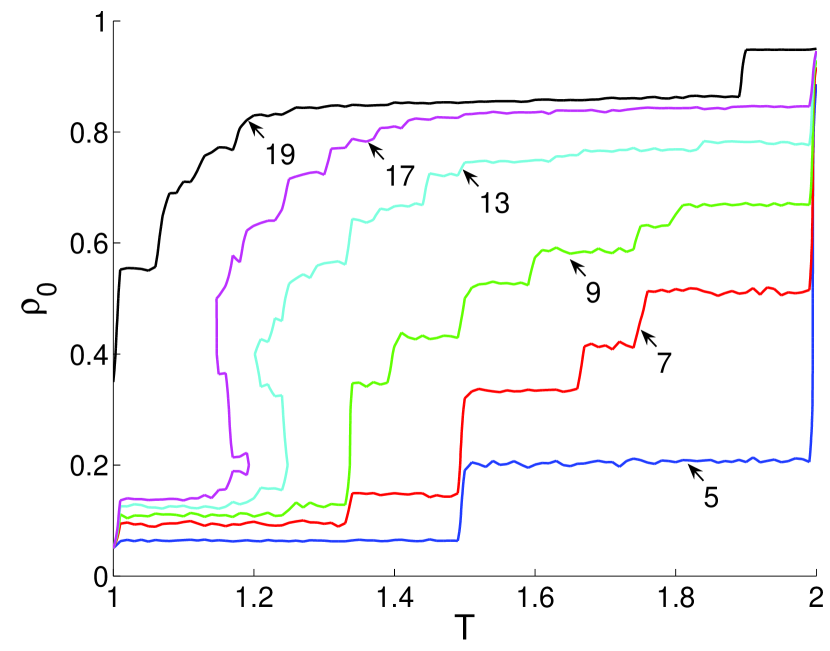
The slice of Figure 1 shows as a function of . The curves are plotted for , in Figures 3a for , and Figure 3b for . The value of increases in presence of self-interaction in the region , for . Self-interaction also shifts the emergence of cooperation to lower values of , when compared to a system without self-interaction. In Table 1, one sees the values of , where occurs for the first time for different values of . Notice the strong difference concerning the parity of .
The non-monotonous behavior for intermediate values of presented in Figures 1 and 3, in the region and are due to the coexistence phases. In this region, the standard deviation of is higher than in the remaining regions.
(a)
(b)
| 1.0 | 0.3 | 0.1 |
| 1.2 | 0.5 | 0.2 |
| 1.4 | 0.6 | 0.5 |
| 1.6 | 0.7 | 0.6 |
| 1.8 | 1.0 | 0.7 |
| 2.0 | 1.0 | 1.0 |
To observe the behavior of , when increases, see the surfaces of for , in Figures 4a, and , Figure 4b. Comparing Figures 1a and 1b, one observes that if is increased, the surfaces become more similar.
(a)
(b)
Figures 5a and 5c are the top view of the surfaces for and , respectively. They show the convergence of for even and odd . Figures 5b and 5d are the standard deviation for and , respectively. A relevant difference between even and odd is that the cooperative phase persists for in the range of in the presence of self-interaction (see Figure 5c). If self-interaction is present the shift in to higher values remains in higher values of .
A slice of the plane of the surface in Figures 1a and 1b at , may represent a phase diagram. In Figures 6a and 6c, the contours separate the cooperative/defective phases, i.e. the phase-diagram. Figures 6b and 6d are the contours that take into account the standard deviation. Since there is the phase coexistence, these contours separate the cooperative/coexistence/defective phases.
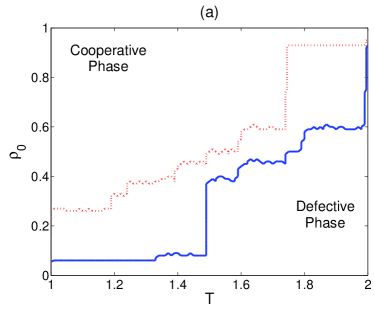
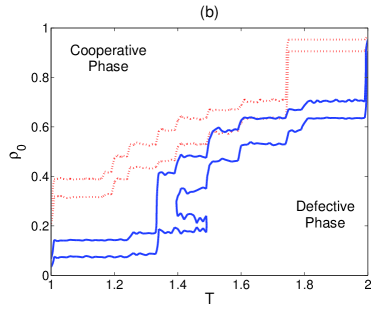
In Figures 7a and 7b, there are the contours of the cooperative/defective phase for different values. When increases the contours converge to the same pattern independently if is even or odd as shown in Figure 6c and 6d. For small values, the parity generates remarkable differences in the contours, if increases, the contours converge and present a similar form and the phase coexistence region is narrower than for small values.
(a)
(b)
IV Conclusion
The Prisoner’s Dilemma in the one-dimensional cellular automata yields results according to the results obtained previously for regular lattices in dimensions. The exhaustive exploration of the parameter space allows us to observe that the parameter plays the main role in the dynamics. For low values, the influence of self-interaction is remarkable. Some studies about the PD with variable coordination number, i.e. the neighborhood size , have been carried out. However, these studies adopt lattice topologies that are different from the one-dimensional lattice used here, e.g. square lattice ifti2004 , complex networks as random graphs duran2005 , scale-free networks ifti2004 ; santos2005 , small-world networks abramson2001 . Another difference in comparison to these studies is that the state update of the players is asynchronous ifti2004 ; santos2005 , but in our case is synchronous. Despite these differences, the main features due to the variation remain, such as the dependence on the asymptotic cooperator proportion on the neighborhood size. Our results are similar to those obtained by Durán and Mulet duran2005 considering the neighboorhood with self-interaction (odd ). Comparing our results to those found in the literature, it is possible to see that the way the connection among the players is settled plays another important role in this problem independently of the space dimensionality or network structure.
For intermediate values of and the chaotic phase occurs. In the chaotic phase the outcome can belong to the cooperative or defective phase due to only a small change in the initial distribution of the cooperators.
Acknowledgments
M. A. P. would like to thank CAPES for the fellowship. A. S. M. acknowledges the agencies CNPq (305527/2004-5) and FAPESP (2005/02408-0) for support. A. L. E. would like to thank CNPq for the fellowship and FAPESP and MCT/CNPq Fundo Setorial de Infra-Estrutura (06/60333-0) for the financial support.
References
- (1) D. Stauffer Physica A 336, 1-5 (2004).
- (2) J. P. Bouchaud Physica A 313, 238-251 (2002).
- (3) C. Anteneodo, C. Tsallis, A. S. Martinez Europhys. Lett. 59 5, 635-641 (2002).
- (4) P. E. Turner, L. Chao Nature 398, 441-443 (1999).
- (5) M. Dresher, The Mathematics of Games of Strategy: Theory and Applications (Prentice-Hall, Englewood Cliffs, NJ, 1961).
- (6) W. Poundstone, Prisoner’s Dilemma (Doubleday, New York, 1992).
- (7) J. Neumann and O. Morgenstern, Theory of Games and Economic Behavior (Princeton University Press, New York, 1947).
- (8) R. Axelrod and W. D. Hamilton, Science 211, 1390-1396 (1981).
- (9) R. Axelrod, The evolution of cooperation (Basic Books, New York, 1984).
- (10) M. A. Nowak and R.M. May, Nature 359, 826-829 (1992).
- (11) O. Durán and R. Mulet, Physica D 208, 257-265 (2005).
- (12) E. Lieberman, C. Hauert, M. A. Nowak, Nature 433, 312-316 (2005).
- (13) Z. Wu, J. Guan, X. Xu, Y. Wang, Physica A 379, 672-680 (2007).
- (14) G. Abramson and M. Kuperman, Phys. Rev. E 63, 030901 (2001).
- (15) M. A. Pereira, A. S. Martinez, A. L. Espíndola, arXiv:0708.3520v1 [physics.comp-ph] to appear in Int. J. of Modern Phys. C.
- (16) M. H. Vainstein, A. T. C. Silva, J. J. Arenzon J. Theor. Biol. 244 (4), 722-728 (2007)
- (17) S. Wolfram, Science 9, 2-21 (1983).
- (18) M. A. Nowak and R. M. May, Int. J. Bifurcat. Chaos 3, 35-78 (1993).
- (19) R. O. S. Soares and A. S. Martinez, Physica A 369, 823-829 (2006).
- (20) D. Alves, P. R. A. Campos, A. T. C. Silva, J. F. Fontanari, Phys. Rev. E 63 011911 (2000)
- (21) H. Fort, S. Viola J. Stat. Mech. 1, P01010 (2005).
- (22) A. Mukherji, V. Rajan, J. R. Slagle, Nature 379, 125-126 (1996).
- (23) G. Hardin Science 162, 1243-1248 (1968).
- (24) M. Gardner Scientific American 223, 120-& (1970).
- (25) M. Ifti, T. Killingback, M. Doebeli J. Theor. Biol. 231, 97-106 (2004).
- (26) F. C. Santos and J. M. Pahceco Phys. Rev. Lett. 95, 098104 (2005).