Atomic-charge distribution in glasses by terahertz spectroscopy
Abstract
It is demonstrated that the width of the uncorrelated atomic-charge distribution in glasses can be extracted from the frequency dependence of the coupling coefficient for the far-infrared absorption measured experimentally by the time-domain terahertz spectroscopy technique. This value for As2S3 glass is found to be (e). A density functional theory-based tight-binding molecular dynamics model of As2S3 glass qualitatively supports these findings.
pacs:
63.50.+x,61.43.Fs,78.30.LyI Introduction
Disordered solids, such as glasses, are characterized by a lack of structural order, which leads to disorder in many physical quantities. For example, atomic charges in glasses fluctuate in space. The origin and properties of such fluctuations are of considerable interest in the field of disordered systems. One such intriguing question concerns the scale of charge fluctuations and possible charge ordering in glasses Pasquarello and Car (1997); Massobrio et al. (2004); Blaineau and Jund (2004); Giacomazzi et al. (2006, 2007). Another intriguing question is related to the possibility of obtaining information about the charge distribution from experiment. It has been recently discussed how terahertz absorption spectroscopy can be used for this purpose Taraskin et al. (2006).
In this paper, we study the atomic charge distributions in glassy arsenic sulfide, As2S3, by means of first principle tight-binding molecular dynamics simulations and compare the characteristics of these distributions with those obtained from experimentally available far-infrared (FIR) absorption coefficient measurements.
II Theoretical background
First, we recall how the absorption coefficient in the FIR region is related to the atomic charge distribution Taraskin et al. (2006). The expression for the linear absorption coefficient of photons, , caused by the interaction with harmonic atomic vibrations in solids is given by the following expression (see e.g. Pasquarello and Car (1997)),
| (1) |
where and are the mass and the dynamical charge tensor for atom (, with being the number of atoms in a solid of volume ; and run over Cartesian coordinates), is the -component of the vibrational eigenvector of frequency corresponding to atom , stands for the high-frequency dielectric constant, is the atomic concentration and angular brackets denote configurational averaging. As follows from Eq. (1), the IR absorption coefficient is proportional to the self-averaging value of the vibrational density of states (VDOS),
| (2) |
where runs over all the eigenfrequencies, i.e.
| (3) |
The coefficient of proportionality, , is called the coupling coefficient between IR photons and atomic vibrations for linear light absorption. The VDOS behaves universally ( according to the Debye law) in the FIR regime and thus all interesting and possibly universal features can be attributed to the frequency dependence of the coupling coefficient.
The absorption coefficient given by Eq. (1) is temperature independent and some variations of with temperature found experimentally for microwave frequencies U.Strom and Taylor (1977), , which may possibly be attributed to excitations of two-level systems and/or to highly anharmonic atomic modes, are not considered here. The dynamical charge tensors are crucial for a correct description of the peak positions and their relative intensities in the bulk of the vibrational band (above the FIR region) Wilson and Madden (1996); Pasquarello and Car (1997) but are not so significant in the FIR regime and thus a simpler (rigid-ion) model Maradudin and Wallis (1961) can be used, so that
| (4) |
with being the temporally fixed but spatially fluctuating atomic charges and
| (5) |
In the well-studied case of ordered systems, where the charges do not fluctuate, and the eigenmodes are phonons, the coupling coefficient is non-zero only for optic modes at the centre of the Brillouin zone. In disordered systems, structural disorder leads to charge transfer between atoms, i.e. to disorder in atomic charges , and to intrinsic disorder in the components of the eigenvectors which lose their translational invariance. These two related sources of disorder, encoded in Eq. (4), are responsible for the peculiar behaviour of in amorphous systems, which actually has a universal functional form in the FIR regime Taraskin et al. (2006),
| (6) |
where and are material-specific constants.
In order to see this, we use two facts known about the structure of the eigenmodes in the FIR regime and about the distribution of atomic charges. First, the disordered eigenmodes in the FIR regime resemble plane waves Taraskin and Elliott (2000, 1998) characterized by pseudo-wavevectors and exhibiting pseudo-dispersion, (with being the sound velocity for branch ) and can be well approximated Taraskin et al. (2006) by a plane wave characterized by wavevector and unit polarization vector ,
| (7) |
with and being the position vector of atom .
The second useful fact concerns the distribution of charges in disordered systems. It has been found in simulations Pasquarello and Car (1997); Blaineau and Jund (2004); Giacomazzi et al. (2006, 2007) that the charges in the models of some amorphous materials preserve approximately charge neutrality within certain structural units. For example, the SiO4 structural units in vitreous silica are approximately electro-neutral Pasquarello and Car (1997) meaning that the positive charge on an Si atom is approximately equal in magnitude to half of the sum of the charges on the four nearest oxygen atoms. The values of silicon and oxygen charges vary strongly between structural units, depending on local structural characteristics such as the Si-O-Si bond angle. Moreover, the electro-neutrality within the structural units is maintained only approximately (see below) and there is always a stochastic component in the charge distribution due to intermediate and long-range fluctuations in the structure. These observations allow the values of atomic charges to be split into two components, , with representing uncorrelated charge components, and the random charges satisfying local charge neutrality.
The values of depend on the atomic coordinates in a complicated fashion so that we can approximately assume the absence of correlations between on different atoms, i.e.
| (8) |
where the variance can vary for different type of atoms, or for the same atoms but e.g. that are abnormally coordinated. Similarly, we assume no correlations between and atomic position vectors, so that
| (9) |
The random charges obeying local charge neutrality can be imagined as resulting from charge transfers between nearest-neighbour atoms, i.e. , where runs through all the nearest-neighbours of atom and () is the charge transfer from the originally neutral atom to the originally neutral atom . In heteropolar crystals, the values of are not random and finite. In disordered systems, the values of are distributed around mean value(s) which do not necessary coincide with those for crystalline counterparts (see e.g. Pasquarello and Car (1997)). Such fluctuations and deviations of means in are due to distortions in local structural units, e.g. in bond angles and bond lengths. We also assume that there are no correlations between randomly fluctuating charges and local charge transfers,
| (10) |
The configurationally averaged coupling coefficient can be recast in terms of correlated and uncorrelated charges in the following manner,
| (11) |
where (). In the absence of correlations between and (see Eq. (10)), the above formula for reduces to
| (12) |
The first component in Eq. (12) can be further simplified as,
| (13) |
where we have used Eqs. (8)-(9). In the case of a two-component system containing and atoms of different types, . Therefore, the first contribution in the coupling coefficient is frequency independent and depends only on the variance of uncorrelated charge distributions.
The second component in the coupling coefficient, , which is due to random and locally correlated charge fluctuations, does not contain the frequency-independent part and, in fact, is proportional to . This can be demonstrated using the bond representation for ,
| (14) |
with and , where the sum is taken over all the bonds in the system. In the absence of the plane wave (k=0), this sum equals zero, thus reflecting global charge neutrality of locally neutral units (the contribution from each bond is exactly zero due to the local charge neutrality). In the FIR regime, and Eq. (14) can be recast as
| (15) |
with . Consequently, the contribution from the correlated charges to the coupling coefficient is
| (16) |
so that (implying linear dispersion in the FIR regime). The double sum in Eq. (16) depends on precise structural details of the material but does not depend on in the FIR range () and thus the -dependence of the second contribution in the coupling coefficient is a general feature of the FIR absorption in disordered solids.
Therefore, we have demonstrated that uncorrelated atomic charges result in the frequency-independent part of the coupling coefficient, while locally correlated charges, maintaining the charge neutrality within local structural units, give rise to the quadratic frequency dependence of the coupling coefficient.
III Results
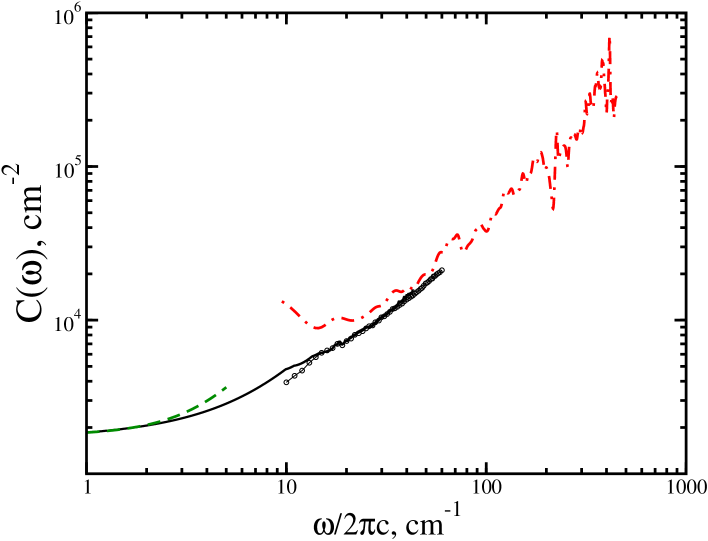
As follows from the previous section, the coupling coefficient for the FIR absorption has a universal frequency dependence (see Eq.(6)), containing a frequency-independent part and a frequency-dependent contribution (). The frequency dependence of the absorption coefficient, , can be measured experimentally using THz time-domain spectroscopy Grischkowsky et al. (1990); Taraskin et al. (2006). The VDOS can also be measured experimentally using, e.g. inelastic neutron scattering Fabiani et al. (2005); Isakov et al. (1993). Therefore, the frequency dependence of the coupling coefficient for the FIR absorption, , can be found experimentally (see Fig. 1). Fitting experimental data with theory (6) allows the values of constants and entering Eq.(6) to be estimated. We have done such a fitting to the experimental data for As2S3 glass (cf. the solid and dashed lines in Fig. 1) and found the values of these constants to be and Taraskin et al. (2006).
The constant depends on the structural characteristics of glass in quite a complicated fashion (see Eq. (16) and cannot be used straightforwardly for extracting the relevant charge distributions. However, the constant is directly related to the width of the uncorrelated charge distribution,
| (17) |
where the coefficient is given by Eq. (5). Using Eq. (17), we have estimated the value of for a-As2S3.
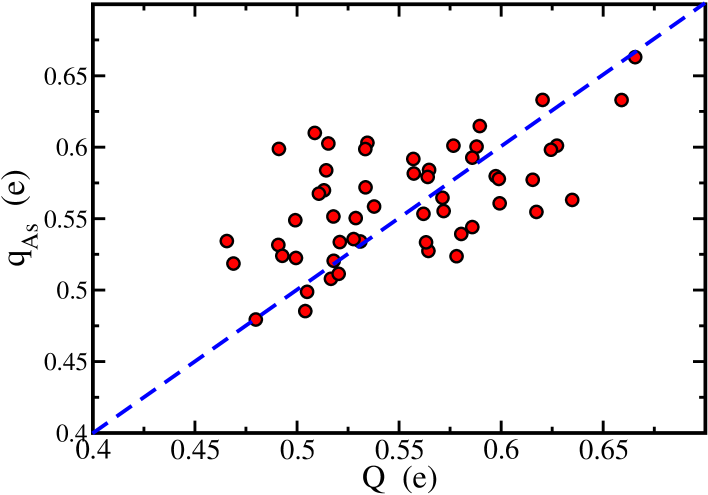
In order to verify and support the consistency of the presented model for the frequency dependence of the coupling constant, we have created a model of As2S3 glass using density functional theory-based tight-binding (DFTB) Porezag et al. (1995); Elstner et al. (1998) molecular-dynamics simulation Simdyankin et al. (2004). First, we checked the local charge neutrality within AsS3 pyramids, these being typical structural units in As2S3 glass. The results presented in Fig. 2 clearly demonstrate correlations between the charge at the central As atom and surrounding S atoms. As expected for such a covalent material, the local charge neutrality is not exact and the data points fluctuate around the bisector due to contributions from .
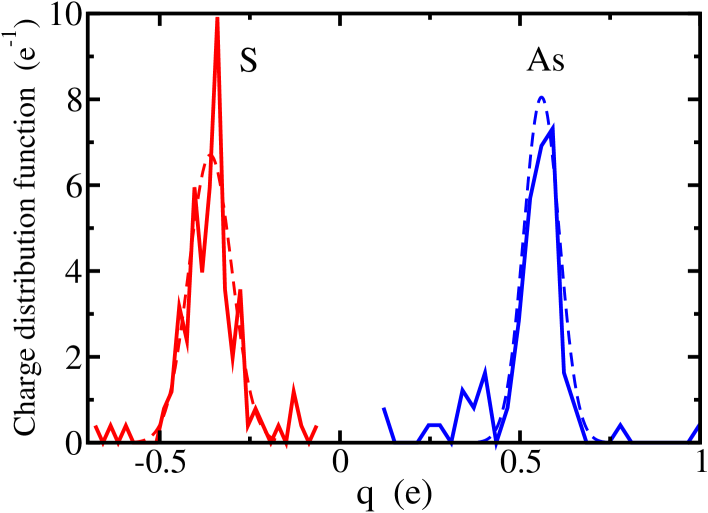
Second, we calculated the Mulliken charge distributions for As and S atoms in our DFTB model of As2S3 glass (see Fig. 3). The charges are distributed approximately normally (see the dashed lines in Fig. 3)) around the mean values and , with the standard deviations and . Therefore, the value of can be estimated as . This value is somewhat less than that estimated from the fit of the experimental data for by Eq. (6) (cf. the solid and dashed lines in Fig. 1), i.e. . Several possible effects could account for such a discrepancy. The Mulliken charges are an artificial way of assigning charge values to particular atoms within the DFTB scheme - a different population analysis may give different absolute values of the charges and thus different widths of the charge distributions. Another possible reason for the discrepancy is due to the experimental uncertainty in measuring the absorption coefficient at very low frequencies, , caused by parasitic secondary reflections of THz pulses of light which, after the Fourier transform, can contribute in this frequency range.
IV Conclusions
To conclude, it has been demonstrated that the frequency dependence of the coupling coefficient for far-infrared absorption can be used to extract characteristics of the atomic charge distribution in glasses. Namely, a fit of such an experimentally measured dependence by the theoretically predicted law, , allows the constants and to be extracted. The value of is simply proportional to the variance of the uncorrelated charge distribution, . In the case of As2S3 glass, we have estimated this value to be . A similar estimate of has been obtained from a first-principles molecular-dynamics model of the same glass.
References
- Pasquarello and Car (1997) A. Pasquarello and R. Car, Phys. Rev. Lett. 79, 1766 (1997).
- Massobrio et al. (2004) C. Massobrio, M. Celino, and A. Pasquarello, Phys. Rev. B 70, 174202 (2004).
- Blaineau and Jund (2004) S. Blaineau and P. Jund, Phys. Rev. B 70, 184210 (2004).
- Giacomazzi et al. (2006) L. Giacomazzi, P. Umari, and A. Pasquarello, Phys. Rev. B 74, 155208 (2006).
- Giacomazzi et al. (2007) L. Giacomazzi, C. Massobrio, and A. Pasquarello, Phys. Rev. B 75, 174207 (2007).
- Taraskin et al. (2006) S. N. Taraskin, S. I. Simdyankin, S. R. Elliott, J. R. Neilson, and T. Lo, Phys. Rev. Lett. 97, 055504 (2006).
- U.Strom and Taylor (1977) U.Strom and P. Taylor, Phys. Rev. B 16, 5512 (1977).
- Wilson and Madden (1996) M. Wilson and P. A. Madden, Phys. Rev. Lett. 77, 4023 (1996).
- Maradudin and Wallis (1961) A. A. Maradudin and R. F. Wallis, Phys. Rev. 123, 777 (1961).
- Taraskin and Elliott (2000) S. N. Taraskin and S. R. Elliott, Phys. Rev. B 61, 12017 (2000).
- Taraskin and Elliott (1998) S. N. Taraskin and S. R. Elliott, Phil. Mag. B 77, 403 (1998).
- Grischkowsky et al. (1990) D. Grischkowsky, S. Keiding, M. van Exter, and C. Fattinger, J. Opt. Soc. Am. B 7, 2006 (1990).
- Fabiani et al. (2005) E. Fabiani, A. Fontana, and U. Buchenau, cond-mat/0502207 (2005).
- Isakov et al. (1993) S. L. Isakov, S. N. Ishmaev, V. K. Malinovsky, V. N. Novikov, P. P. Parshin, S. N. Popov, A. P. Sokolov, and M. G. Zemlyanov, Solid State Commun. 86, 123 (1993).
- Porezag et al. (1995) D. Porezag, T. Frauenheim, T. Köhler, G. Seifert, and R. Kaschner, Phys. Rev. B 51, 12947 (1995).
- Elstner et al. (1998) M. Elstner, D. Porezag, G. Jungnickel, J. Elsner, M. Haugk, T. Frauenheim, S. Suhai, and G. Seifert, Phys. Rev. B 58, 7260 (1998).
- Simdyankin et al. (2004) S. I. Simdyankin, S. R. Elliott, Z. Hajnal, T. A. Niehaus, and T. Frauenheim, Phys. Rev. B 69, 144202 (2004).
- Ohsaka and Ihara (1994) T. Ohsaka and T. Ihara, Phys. Rev. B 50, 9569 (1994).