Simulating Reionization: Character and Observability
Abstract
In recent years there has been considerable progress in our understanding of the nature and properties of the reionization process. In particular, the numerical simulations of this epoch have made a qualitative leap forward, reaching sufficiently large scales to derive the characteristic scales of the reionization process and thus allowing for realistic observational predictions. Our group has recently performed the first such large-scale radiative transfer simulations of reionization, run on top of state-of-the-art simulations of early structure formation. This allowed us to make the first realistic observational predictions about the Epoch of Reionization based on detailed radiative transfer and structure formation simulations. We discuss the basic features of reionization derived from our simulations and some recent results on the observational implications for the high-redshift Ly- sources.
Keywords:
high-redshift—galaxies: formation—intergalactic medium—cosmology: theory—radiative transfer— methods: numerical:
95.30.Jx,95.75.-z,95.85.Bh,98.38.Gt,98.54.Kt,98.70.Vc,98.80.-k1 Introduction
The reionization of the universe was the last global transition of the Intergalactic Medium (IGM), caused by the radiation of the First Stars. It completely transformed the IGM, from fully-neutral and cold to almost fully-ionized and hot ( K). Reionization started with the formation of the first sources of ionizing radiation at very high redshifts and finished around . Currently there are still very few direct observational constraints on this epoch. The lack of Gunn-Peterson trough in the spectra of high-redshift sources implies low mean neutral fraction out to redshift , which appears to rise at higher redshifts, possibly indicating that at these redshifts we are seeing the tail-end of reionization. The second direct observable, the integrated electron-scattering optical depth, , was found to be based on the WMAP 3-year data (Spergel and et al. 2007). This range of values points to an early start and extended period of reionization. However, the error bars remain fairly large and thus the optical depth by itself does not put very stringent constraints on reionization.
This relative lack of observational data is set to change dramatically in the next few years, however. A number of large observational projects are currently under development, e.g. observations at the redshifted 21-cm line of hydrogen (e.g. Madau et al. 1997; Tozzi et al. 2000; Iliev et al. 2002; Mellema et al. 2006; Furlanetto et al. 2006), detection of small-scale CMB anisotropies due to the kinetic Sunyaev-Zel’dovich (kSZ) effect (e.g. Hu 2000; Santos et al. 2003; Iliev et al. 2007a), and surveys of high-redshift Ly- emitters (e.g. Stanway and et al. 2004; Bunker et al. 2006). The planning and success of these experiments relies critically upon understanding the large-scale topology of reionization, i.e. the size- and spatial distribution of the ionized and neutral patches, which is best derived by large-scale simulations. Recently we presented the first large-scale, high-resolution radiative transfer simulations of cosmic reionization (Iliev et al. 2006; Mellema et al. 2006; Iliev et al. 2007b). Here we summarize our basic conclusions about the character of the reionization process, along with some of our recent results on its observability.
2 Basic features of reionization
The key results for the nature and features of reionization could be summarized as follows:
-
•
Reionization proceeds in an inside-out fashion, whereby the high density regions are ionized first and the deepest voids - last, due to the galaxies preferentially forming in and around the high density peaks of the density distribution (Iliev et al. 2006).
-
•
The process is thus highly-inhomogeneous and patchy on large scales, with very complex geometry. It is strongly modulated by the long-wavelength density fluctuations. As a consequence, small-volume simulations, which do not include these large-scale fluctuations underestimate the source biasing and the reionization patchiness (Iliev et al. 2006; Mellema et al. 2006; Iliev et al. 2007c).
-
•
The reionization parameters, like source efficiencies (dependent on the stellar IMF, star formation efficiencies and escape fractions) and small-scale gas clumping, are only weakly constrained at present. Both the overlap epoch, and the integrated optical depth are readily reproduced by a wide range of reasonable reionization scenarios (Iliev et al. 2006; Mellema et al. 2006; Iliev et al. 2007b).
-
•
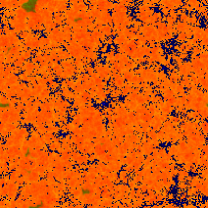
The H II regions have typical scales of 5-20 comoving Mpc (dependent on still-uncertain parameters). Although the high-redshift sources are typically very low-mass, their strong clustering results in the formation of such large ionized patches (see Figures 1 and 2). These characteristic scales are directly reflected in many of the predicted reionization observables (Mellema et al. 2006; Iliev et al. 2007a; Holder et al. 2007; Doré et al. 2007; Iliev et al. 2007c).
-
•
Reionization is strongly self-regulated through Jeans-mass filtering of the low-mass sources: more efficient low-mass sources (e.g. due to top-heavy IMF) result in more suppression of the same sources, thereby largely cancelling the effect of the higher efficiency, and vice versa (Iliev et al. 2007b).
-
•
This process of self-regulation has the effect that and , the overlap redshift are only loosely related and do not impose very strong constraints on the possible reionization scenarios. The reason for this is that depends on the abundances and efficiencies of the high-mass sources, whose formation is not suppressed by reionization, unlike , which depends on both types of sources. Varying the ionizing efficiencies of low-mass sources yields a wide range of values for the same (Iliev et al. 2007b).


3 High-redshift Ly- sources
Observations of the high-redshift Ly- sources, galaxies and QSO’s, have already provided us with a wealth of information about the state of the IGM and the nature of the luminous galaxies at the end of reionization and still hold a lot of promise for the future. In addition to probing the IGM and the source luminosity function (and thus, indirectly, the halo mass function and ionization source properties), they may also be used to constrain the reionization geometry. The first rare objects form in the highest peaks of the density field. The statistics of Gaussian fields predicts that density peaks are strongly clustered, especially at high redshift. As a consequence, each high-redshift, massive galaxy was surrounded by numerous smaller ionizing sources. Self-consistent simulations of such regions require following a large enough volume while at the same time resolving all the low-mass halos which drive reionization, which has not been possible until recently.
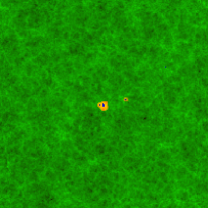
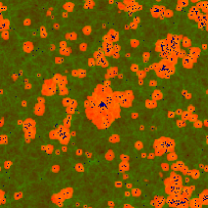
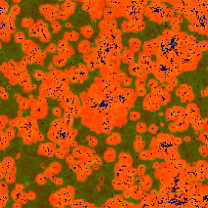
In Figure 2 we illustrate several stages of the reionization history of a high density peak. The most massive source in our volume (at ) is shifted to the centre using the periodicity of the computational box. At redshift the H II region is small and the source is invisible due to the damping wing due to the neutral gas outside. By redshift many more haloes have formed, most of them in large clustered groups. The H II region surrounding the central peak is among the largest, but the central source emission is still strongly affected by damping. Only by redshift is the ionized region large enough to render the source unaffected by damping and potentially visible. The reionization geometry becomes quite complex, most ionized bubbles are interconnected, but large neutral patches remain between them. Finally, by the nominal overlap all ionized regions have merged into one topologically-connected region, although substantial neutral patches remain interspersed throughout our volume, which remains largely optically-thick to both Ly- and ionizing continuum radiation. Only by this volume becomes on average optically-thin to ionizing radiation.
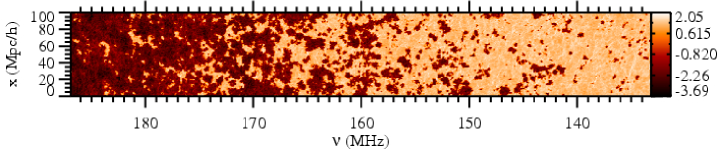
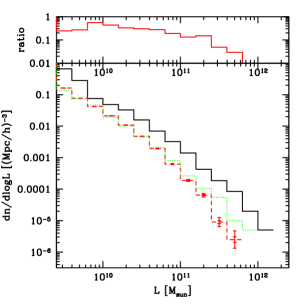
In Figure 3 (left and center) we show some sample spectra for the same luminous source. The spectra exhibit extended high-transmission (10-60% transmission) regions in the highly-ionized proximity zone of the luminous source, within 5 Mpc ( Å). The center of the peak itself is optically-thick due to its high density. The infall around the central peak blue-shifts photons, resulting in some absorption behind the redshift-space position of the source. Away from the proximity region the absorption is largely saturated, but there are a number of transmission gaps with up to a few per cent transmission. In Figure 3 (right) we show the Ly- source luminosity function at the same redshift. For the weaker sources roughly half of the intrinsic luminosity is transmitted (the red wing of the line), while the most luminous sources suffer from additional absorption due to the gas infall that surrounds them. Future work will quantify the statistics of these features and its evolution.
References
- Spergel and et al. (2007) D. N. Spergel, and et al., ApJS 170, 377–408 (2007), arXiv:astro-ph/0603449.
- Madau et al. (1997) P. Madau, A. Meiksin, and M. J. Rees, ApJ 475, 429–+ (1997).
- Tozzi et al. (2000) P. Tozzi, P. Madau, A. Meiksin, and M. J. Rees, ApJ 528, 597–606 (2000).
- Iliev et al. (2002) I. T. Iliev, P. R. Shapiro, A. Ferrara, and H. Martel, ApJL 572, L123–L126 (2002).
- Mellema et al. (2006) G. Mellema, I. T. Iliev, U.-L. Pen, and P. R. Shapiro, MNRAS 372, 679–692 (2006).
- Furlanetto et al. (2006) S. R. Furlanetto, S. P. Oh, and F. H. Briggs, Phys. Reports 433, 181–301 (2006), astro-ph/0608032.
- Hu (2000) W. Hu, ApJ 529, 12–25 (2000), astro-ph/9907103.
- Santos et al. (2003) M. G. Santos, A. Cooray, Z. Haiman, L. Knox, and C.-P. Ma, ApJ 598, 756–766 (2003).
- Iliev et al. (2007a) I. T. Iliev, U.-L. Pen, J. R. Bond, G. Mellema, and P. R. Shapiro, ApJ 660, 933–944 (2007a), arXiv:astro-ph/0609592.
- Stanway and et al. (2004) E. R. Stanway, and et al., ApJL 604, L13–L16 (2004), astro-ph/0312459.
- Bunker et al. (2006) A. Bunker, E. Stanway, R. Ellis, R. McMahon, L. Eyles, and M. Lacy, New Astronomy Review 50, 94–100 (2006), astro-ph/0508271.
- Iliev et al. (2006) I. T. Iliev, G. Mellema, U.-L. Pen, H. Merz, P. R. Shapiro, and M. A. Alvarez, MNRAS 369, 1625–1638 (2006), astro-ph/0512187.
- Iliev et al. (2007b) I. T. Iliev, G. Mellema, P. R. Shapiro, and U.-L. Pen, MNRAS 376, 534–548 (2007b).
- Iliev et al. (2007c) I. T. Iliev, G. Mellema, U.-L. Pen, J. R. Bond, and P. R. Shapiro, submitted to MNRAS (astro-ph/0702099) (2007c).
- Holder et al. (2007) G. P. Holder, I. T. Iliev, and G. Mellema, ApJL 663, L1–L4 (2007), arXiv:astro-ph/0609689.
- Doré et al. (2007) O. Doré, G. Holder, M. Alvarez, I. T. Iliev, G. Mellema, U.-L. Pen, and P. R. Shapiro, Phys. Rev. D 76, 043002–+ (2007), arXiv:astro-ph/0701784.