Evolution of the gaps through the cuprate phase-diagram
Abstract
The actual physical origin of the gap at the antinodes, and a clear identification of the superconducting gap are fundamental open issues in the physics of high- superconductors. Here, we present a systematic electronic Raman scattering study of a mercury-based single layer cuprate, as a function of both doping level and temperature. On the deeply overdoped side, we show that the antinodal gap is a true superconducting gap. In contrast, on the underdoped side, our results reveal the existence of a break point close to optimal doping below which the antinodal gap is gradually disconnected from superconductivity. The nature of both the superconducting and normal state is distinctly different on each side of this breakpoint.
In conventional superconductors, electrons bind into pairs and minimize their potential energy by a quantity known as the superconducting gap. Superconductivity arises when pairs are formed and condense in a phase-coherent state below the critical temperature Tinkham_book . According to standard BCS theory, the energy associated with pair breaking is proportional to and the larger the binding energy, the higher is.
In hole-doped high- cuprate superconductors, is strongly dependent on the charge carrier concentration (the doping level). It takes a dome like shape with two distinct regimes (overdoped and underdoped) on each side of the optimal doping where reaches its maximum. It is now established that the superconducting gap has a -wave symmetry across the entire phase diagram Tsuei_PRL04 , it reaches its maximum values along the antinodal directions and vanishes along nodal directions corresponding respectively to the principal axes and the diagonal in the Brillouin zone.
Among earlier investigations on the superconducting state, angle resolved photoemission spectroscopy (ARPES) Damascelli_RPM07 and electronic Raman scattering (ERS) Venturini_JPCS01 ; Sugai_PRB03 ; LeTacon_NaturePhysics06 ; Devereaux_RMP07 have shown that the gap at the antinodes, , increases continuously as one goes more deeply into the underdoped side. Although not resolved in momentum, tunnelling spectroscopies also support this experimental observation McElroy_PRL05 ; Fischer_RMP07 . In contrast, changes in the opposite way, in contradiction with the constant ratio of standard BCS theory. More surprisingly, ARPES has revealed that the fingerprint of this antinodal gap persists well above in the underdoped regime Damascelli_RPM07 ; Norman_Nature98 , and disappears only at a much higher temperature scale .
This persistence of the antinodal gap into the normal state has been named the pseudogap Timusk_RPP99 . It is also apparent (although not in a momentum-resolved manner) in Scanning Tunnelling Spectroscopy (STS) Fischer_RMP07 and in Nuclear Magnetic Resonant (NMR) experiments Timusk_RPP99 , which first revealed this phenomenon.
All these experimental observations raise a number of questions. What is the actual nature and physical origin of the antinodal gap in the underdoped regime? How to properly identify the superconducting gap? Is the normal-state pseudogap a precursor of the superconducting gap or not? The evolution of the antinodal gap inside and outside the superconducting dome from the overdoped to the underdoped side is therefore one of the most open and fundamental issues in the physics of high- superconductors Norman_adv05 ; MillisScience07 ; Hufner_condmat07 . Our ERS experiments have a direct bearing on these key issues.
We have performed a systematic study of the antinodal gap as a function of both doping level and temperature, throughout the cuprate phase diagram. Our experimental findings demonstrate that, in the deeply overdoped regime, the antinodal gap is clearly associated with superconductivity and can be identified with the superconducting gap. It has the same doping dependence than the critical temperature , its temperature dependence matches with a standard d-wave BCS form, and it disappears at leaving a well characterized metallic state.
In contrast, in the underdoped regime, each of these three observations become invalid. The antinodal gap becomes very weakly temperature dependent (it even increases slightly as the temperature is raised), it is no longer proportional to , and the ratio blows up as the doping level is reduced. Furthermore, the existence of the antinodal pseudogap well into the normal state and its disappearance at a higher temperature scale is clearly revealed here for the first time by ERS.
Our measurements also reveal that, in the underdoped regime, nodal properties become clearly distinct from antinodal ones. In particular, the characteristic scale associated with the superconducting gap amplitude near the nodes continuously tracks . Our observations strongly support that the antinodal gap is progressively disconnected from superconductivity as one goes from the overdoped to the underdoped side of the superconducting dome. The nature of the superconducting state is distinctly different on each side of a characteristic doping level which is located close to optimal doping.
ERS measurements have been performed on () single crystals in a large range of doping levels, from to . The single crystals have been grown by the flux method, and oxygen annealing has been carried out in order to overdope the crystals Bertinotti_PhysicaC96 . is a quite ideal cuprate material. It takes a pure tetragonal symmetry without any chain contrary to (Y-123) or buckling which alters the unit cell of (Bi-2212). We can then separately measure pure nodal and antinodal responses, without mixing effects. Hg-1201 is made of one single CuO2 layer which is a plane of symmetry in the unit cell. Raman active modes are therefore forbidden in the CuO2 layer. This allows us to investigate the low energy electronic Raman spectrum without being hindered by extra phonons lines LeTacon_PRB05 . The ERS experiments have been carried out using a triple grating spectrometer (JY-T64000) equipped with a nitrogen cooled CCD detector. The nodal () and antinodal () regions can be explored by using cross polarizations along the Cu-O bond directions and at 45o from them respectively Devereaux_RMP07 . In order to track the antinodal gap we have used the red () laser line which is particularly well adapted for enhancing the Raman signal MonsooKang ; LeTacon_PRB05 at low doping levels where the green (2.4 eV) or blue (2.5 eV) excitation lines are unable to detect effectively the signature of the antinodal gap.
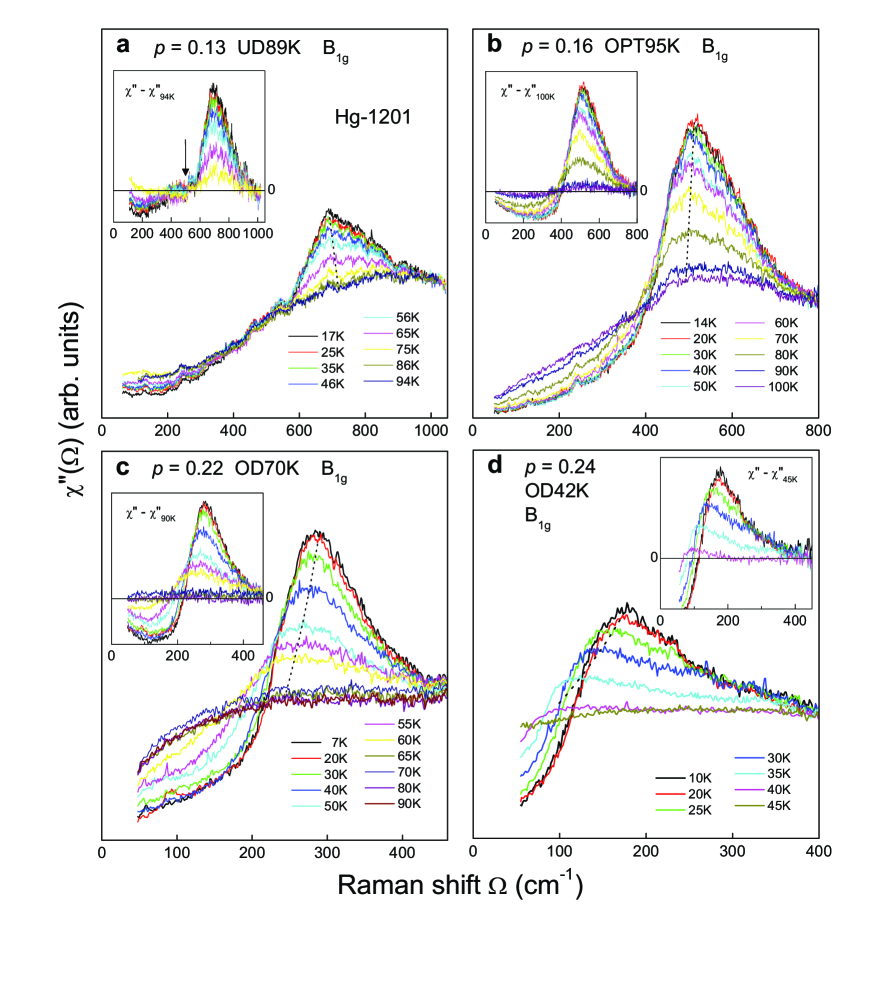
In Figure 1, we display the evolution of the anti-nodal Raman responses as a function of temperature, for four distinct doping levels: , , and (Fig. 1 a, b, c, and d respectively) among the fourteen doping levels that we have studied. There are several experimental facts that we are going to address.
Firstly, for each doping level, (starting from the lowest temperature), we observe a strong antinodal peak which decreases in intensity as the temperature is raised up to . Simultaneously, the low energy continuum grows. This transfer of spectral weight is clearly visible in the insets of Figure 1. Above , a well marked peak is no longer apparent.
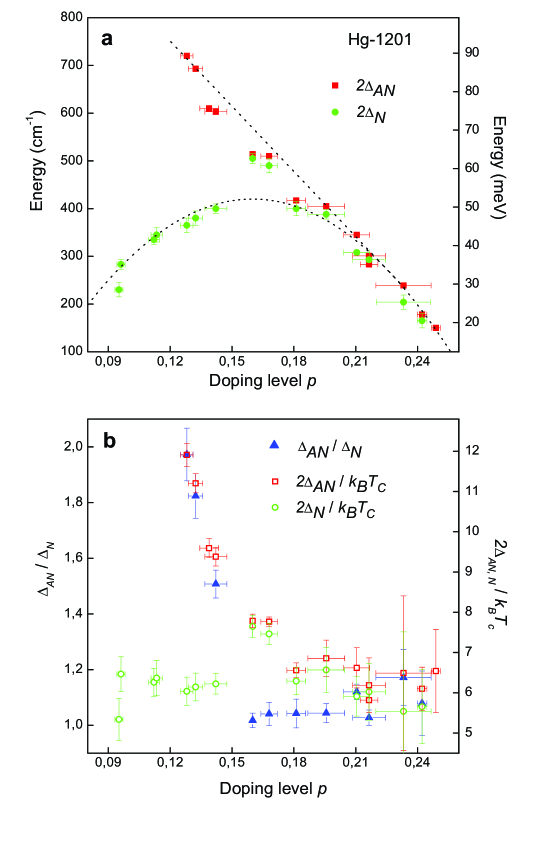
Secondly, the antinodal superconducting peak increases in energy as one goes from the overdoped to the underdoped side. An overview of the evolution of the antinodal peak energy is shown in Fig. 2a over a large doping range (from to ). The energy of the antinodal peak () increases essentially linearly as we enter more deeply in the underdoped regime NOTE1 , down to the lowest doping levels exhibited here. Such a behaviour has already been observed in previous Raman experiments LeTacon_NaturePhysics06 ; Devereaux_RMP07 . However our systematic study allows us to clearly point out a drastic change in the ratio as the doping is reduced (see Fig. 2 b). On the overdoped side, this ratio is nearly constant and takes its smallest values (), less than from the value () expected for a simple d-wave BCS gap. In contrast as one crosses the optimal doping and enters more deeply inside the underdoped regime, this ratio blows up and doubles for . This reveals a break in the relationship between the antinodal gap and . This contrasts with the amplitude of the gap near the nodes, , measured in the B2g geometry, which continuously follows throughout the superconducting dome (see Fig. 2 a and 2 b). The ratio is essentially constant for all doping levels, and equal to , to be compared with the d-wave BCS value . Accordingly, the ratio KK has a similar behaviour than the K ratio and exhibits a sharp break. This is shown in Fig. 2 b. This ratio is quasi-constant on the overdoped side and then blows up at optimal doping. On the overdoped side, its value () is in good agreement with the one expected from the antinodal and nodal Raman responses of a simple d-wave BCS superconductor () Devereaux_RMP07 .
Thirdly, Figure 1 reveals that the temperature dependence of the antinodal peak energy changes drastically as the doping level is reduced. For , it decreases in energy by approximately from K to K. As the doping level is reduced to , its energy softening becomes smaller (about 10 percent) and finally for , the antinodal energy is found to be quasi-constant up to (it even appears to slightly increase as the temperature raises). We can then detect an isosbestic point (marked by an arrow in Fig. 1 a) since the superconducting peak energy is quasi constant in this doping range. NOTE2
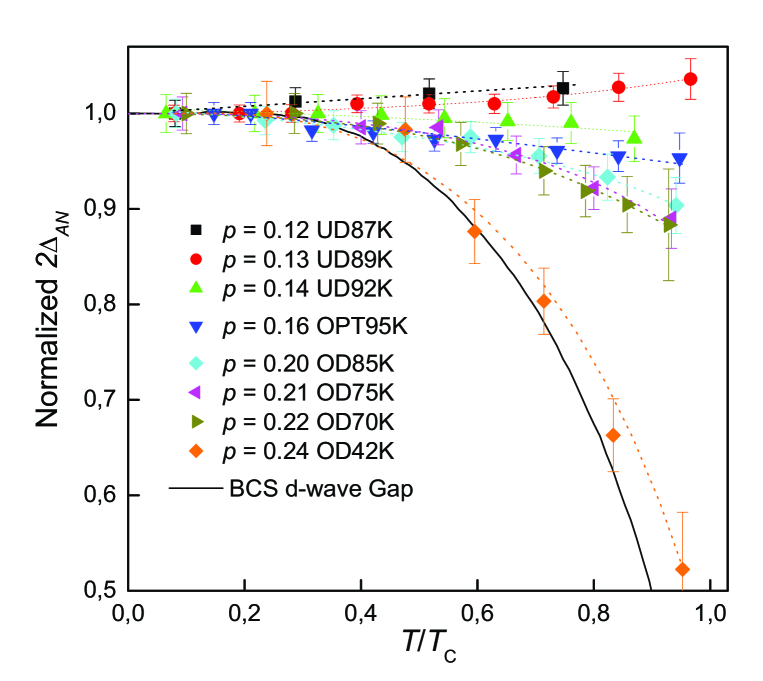
We therefore note that the temperature dependence of the anti-nodal gap changes in a radical manner as the doping level varies. To quantify this further, we performed a detailed mapping of the antinodal gap as a function of temperature over an extended range of doping levels, thus going further than earlier Raman experiments on Gasparov_PRB98 or Staufer_PRL92 compounds. The key point here is to see if there exists an intimate relationship between the clean break in the K ratio measured at low temperature and the antinodal gap evolution at higher temperatures inside the superconducting dome. In Figure 3, we display the temperature dependence of the anti-nodal peak energy renormalized to its value at the lowest temperature K, over a large doping range from to . In the deeply overdoped regime the energy of the antinodal peak is strongly temperature dependent and matches with the temperature evolution of the BCS d-wave superconducting gap Carbotte_PRB95 . As the doping level is reduced, the temperature dependence of the antinodal gap is weaker and we can then define a ”crossing zone” close to the optimal doping where the anti-nodal peak energy no longer depends on temperature. In the same doping range, both the K and the KK ratios discussed above blow up. This points out the strong link which exists between the temperature independence of the antinodal gap and its splitting-off from the dome.
Such a change in the evolution of the antinodal gap inside the superconducting dome raises the question of the existence of a break-point in the vicinity of optimal doping. We thus focus now on the normal state in order to see if there exists also a significant change in the antinodal Raman spectra in the normal state on each side of the optimal doping level. A first glance at Figure 1 immediately reveals that the shape of the ”normal” electronic background above is strongly modified as one goes from the overdoped to the underdoped side. The structure of the normal-state electronic background at low energy changes from a convex to a concave shape. As we shall show, this drastic change is the Raman signature of the pseudo gap. Up to now, no clear signature of the pseudo gap in the antinodal Raman response has been yet identified. Most of the earlier Raman experiments have tracked the pseudo gap in the nodal region ( channel) Nemetschek_97 . This seems paradoxical but the main reason is that the Raman signal in the deeply underdoped regime is much higher than the one in (the antinodal region). There was some attempts to detect the pseudo gap in channel, but due the presence of weak luminescence contribution, the spectra were not corrected from the Bose factor at low energy, which prevented these experiments Blumberg_97 to clearly see the evolution of the pseudo gap as a function of temperature and to identify .
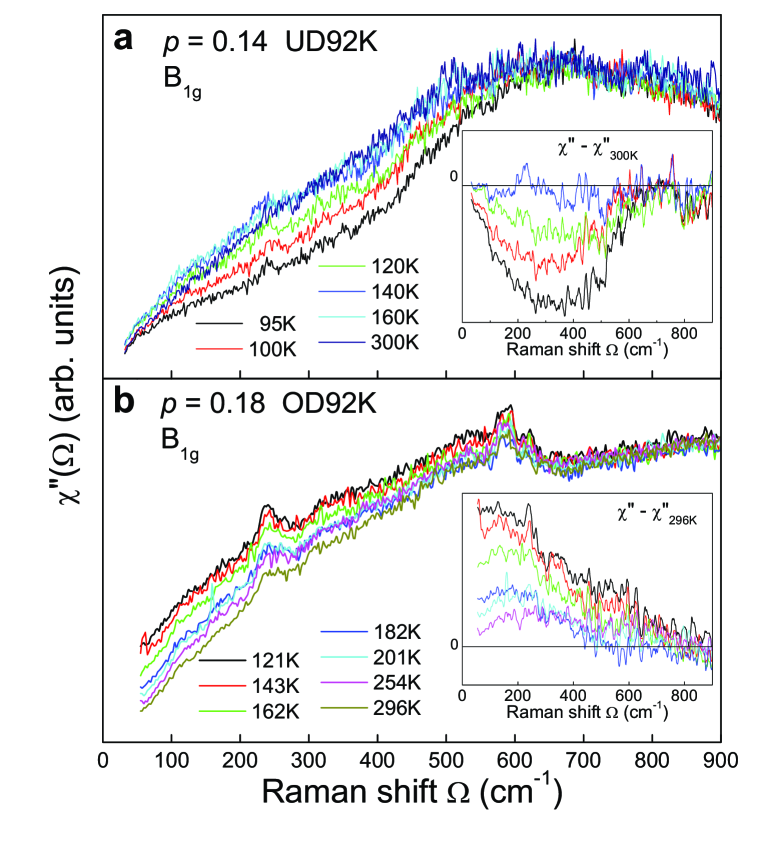
Here, we have performed Raman measurements on a slightly under-doped compound and K in order to preserve a significant Raman intensity and avoid spurious luminescence which occurs at low doping levels. The ERS spectra are shown in Fig. 4 a. The electronic background just above ( K) exhibits a positive curvature. As the temperature is raised, the low energy electronic background increases in intensity and we can define a depletion in the measured spectrum (extending up to cm-1) which ”is filling in”. This is illustrated in the inset of Fig. 4 a. Above K, the electronic background level remains nearly constant. Hence, our estimate of the pseudogap temperature for this compound is K.
This is consistent with the pseudo gap detected by thermoelectric power measurements on YamamotoPRB_00 as well as with earlier NMR experiments BobroffPRL_97 . Our observations are very similar to what is observed by ARPES for a slightly underdoped compound see for instance Norman_Nature98 . The sharp coherent peak at the antinodes disappears above and gives place to a broad feature (the pseudogap) above . As the temperature is raised, the leading edge midpoint becomes closer to the reference Fermi level and finally it coincides with it between K and K. This is in good agreement with our ERS estimate of in underdoped with a K. In the same manner, the tunnelling spectra of underdoped Bi-2212 compounds display far above a clear pseudo gap, which manifests itself by a ”V” shape feature in the STS spectra and also ”fills in” as temperature is raised Fischer_RMP07 .
On the more overdoped side (see Fig. 1 c or d) there is no sign of pseudogap in the normal state, and the curvature of the ERS spectrum is always negative. In Fig 4B, we display the Raman spectra of a slightly overdoped compound () for several different temperatures above . The low energy electronic background decreases as the temperature is raised. This corresponds to a conventional metallic behaviour. It has already been observed in previous Raman experiments Venturini_PRL02 ; Devereaux_RMP07 , where the low-frequency slope (not fully resolved in Fig.4 b) is proportional to the quasiparticle lifetime and decreases as the temperature is raised. Our Raman analysis just below and above the optimal doping reveal here unambiguously the existence of the antinodal pseudo gap in the underdoped side and its disappearance in the overdoped one.
In summary, our experimental findings reveal a clear change of the antinodal Raman response in both the normal and superconducting states, as one crosses a characteristic doping close to the optimal doping level. On the strongly overdoped side, the normal state behaves as a rather conventional metal. The antinodal gap follows , it is strongly temperature dependent and closes at in a very similar way as a BCS d-wave gap. On the underdoped side, the pseudo gap (the signature of the antinodal gap above ) is for the first time clearly detected by ERS and is identified. In contrast to the overdoped side, the antinodal gap in the superconducting state is no longer (or very weakly) temperature dependent, and it increases continuously as the doping level is reduced, while decreases. This leads to a dramatic increase of the K ratio and to a splitting-off of the antinodal K and nodal K gap scales. Our systematic ERS study of the antinodal gap as a function of both temperature and doping level allowed us to clearly identify a crossing zone in the vicinity of the optimal doping where all these changes occur. The physical nature of both the normal and the superconducting state is markedly different on each side of this characteristic doping.
A clear conclusion of our experimental investigations is that the nature of the antinodal gap changes through the cuprate phase diagram. It is a true superconducting gap in the deeply overdoped regime, where it gradually catches up with a d-wave BCS-like description as the doping level increases. In contrast, in the underdoped regime, the antinodal gap is progressively disconnected from superconductivity itself (as signaled by the blowing up of the ratio). Our results support the existence of two distinct gaps on the underdoped side of the cuprate phase diagram, as previously infered from various experiments Tallon_PhysicaC2001 such as Andreev-Saint James reflections Deutscher_Nature99 , ERS LeTacon_NaturePhysics06 , ARPES Tanaka ; kondo , or ellipsometry measurements Yu_condmat .
Many different theories have been put forward in order to explain the nature of the antinodal gap in the underdoped regime (see Refs. MillisScience07 ; Norman_adv05 for a discussion), and our experimental results put strong constraints on these theories. One point of view is that on the underdoped side, pairs are preformed in the normal state below and condense at (as e.g. on the BEC side of the BCS to BEC crossover). In this picture, the antinodal gap is associated with the pair binding (pair breaking) energy. It remains to be seen however whether such models can explain why a smaller energy scale proportional to shows up in several spectroscopies when probing the nodal direction (see e.g. Ref. Hufner_condmat07 for a recent discussion). In other theories, the normal-state pseudogap is associated with a phenomenon which is distinct from pairing. Various possibilities exist: magnetic correlations developing in the normal state (such as e.g. singlet formation close to a Mott insulator anderson ), or even long-range ordering competing with superconductivity such as orbital currents Varma_PRB97 or density-wave ordering Benfatto_EPJ2000 ; Chakravarty_PRB01 , possibly disappearing at a quantum critical point as the doping level is increased. In such theories, the presence of distinct energy scales associated with the normal-state pseudogap (dominating the antinodes) and with superconductivity (detectable in the nodal regions) is a natural possibility. Indeed, recent microscopic calculations based on quantum cluster methods appear to support a two-gap picture Aichhorn_condmat07 ; civelli_condmat07 (see also the phenomenological approach of Ref. Valenzuela_PRL07 ). Our experimental results do appear easier to interpret within theories in which the antinodal gap is not associated with superconductivity. However, such theories have to cope with the experimental observation that a sharp antinodal peak is only observed below (not ), most probably in connection with the sharpening up of quasiparticle excitations. Future experimental investigations and more refined theoretical calculations have to be performed and compared to each other in order to advance our understanding of these fundamental issues in the physics of high-temperature superconductivity.
References
- (1) Tinkham, M. Introduction to superconductivity, MacGraw Hill, New York, 1975.
- (2) Tsuei, C. C. et al. Robust d Pairing Symmetry in Hole-Doped Cuprate Superconductors. Phys. Rev. Lett. 93, 187004 (2004).
- (3) Damascelli, A., Hussain, Z. & Shen, Z.-X. Angle-resolved photoemission studies of the cuprate superconductors. Rev. Mod. Phys. 75, 473 (2003).
- (4) Venturini, F. et al. Doping dependence of the electronic Raman spectra in cuprates. Journ. Phys. Chem. Solids 63, 2345 (2002).
- (5) Sugai, S. et al. Carrier-density-dependent momentum shift of the coherent peak and the LO phonon mode in p-type high- superconductors. Phys. Rev. B 68, 184504 (2003).
- (6) Le Tacon, M. et al. Two energy scales and two distinct quasiparticle dynamics in the superconducting state of underdoped cuprates. Nat. Phys. 2, 537 (2006).
- (7) Devereaux, T. P. & Hackl, R. Inelastic light scattering from correlated electrons. Rev. of Mod. Phys. 79, 175-159 (2007).
- (8) McElroy, K. et al. Coincidence of Checkerboard Charge Order and Antinodal State Decoherence in Strongly Underdoped Superconducting Bi2Sr2CaCu2O8+δ. Phys. Rev. Lett. 94, 197005 (2005).
- (9) Fischer, O. et al. Scanning tunneling spectroscopy of high-temperature superconductors. Rev. Mod. Phys. 79, 353-367 (2007).
- (10) Norman, M. R. et al. Destruction of the Fermi surface in underdoped high- superconductors. Nature 392, 157 (1998).
- (11) Timusk, T. & Statt, B. W. The pseudogap in high-temperature superconductors: an experimental survey. Rep. Prog. Phys. 62, 61-122 (1999).
- (12) Norman,M.R., Pines, D. & Kallin, C., The pseudogap: friend or foe of high T-c? Adv. Phys. 54, 715-733 (2005).
- (13) Millis, A.J., Gaps and our understanding. Science 314, 1888 (2006).
- (14) Huefner, S., Hossain, M.A. , Damascelli, A. & Sawatzky, G.A. Two gaps make a high temperature superconductor. Preprint at http://arxiv.org/abs/0706.4282 (2007).
- (15) Bertinotti, A. et al. Synthesis, crystal structure and magnetic properties of superconducting single crystals of HgBa2CuO4+δ. Physica C 268, 257-265 (1996).
- (16) Le Tacon, M., Sacuto, A. & Colson, D. Two distinct electronic contributions in the fully symmetric Raman response of high- cuprates. Phys. Rev. B 71, 100504(R) (2005).
- (17) Kang, M., Blumberg, G., Klein, M. V. & Kolesnikov, N. N. Resonance Raman Study of the Superconducting Gap and Low Energy Excitations in Tl2Ba2CuO6+δ Superconductors. Phys. Rev. Lett. 77, 4434 (1996).
- (18) No more Raman signature of the superconducting gap opening is detected below Gallais_PRB05 .This is consistent with the reduction of the the antinodal quasiparticle spectral weight and the confinement of coherent quasiparticles near the nodal regions Norman_Nature98 which leads to the disappearance of the superconductivity signature below in the antinodal regions.
- (19) Gallais, Y., Sacuto, A., Devereaux, T. P. & Colson, D. Interplay between the pseudogap and superconductivity in underdoped HgBa2CuO4+δ single crystals. Phys. Rev. B 71, 012506 (2005).
- (20) It is then tempting to look for a sum rule in order to describe the electronic background redistribution. Unfortunately, attempts are until now unsuccessful. If we draw one’s inspiration from the Shastry-Shraiman relation Shastry_PRL90 , we find that the integrals of the Raman response function divided by the frequency taken from each part of the isosbestic point are distinct. Even if the Raman response functions of Hg-1201 underdoped compounds are here truncated at 70 cm-1, the low energy integral at low temperature are already larger than the higher one.
- (21) Shastry, S. & Shraiman, B. Theory of Raman scattering in Mott-Hubbard systems. Phys. Rev. Lett. 65, 1068 (1990).
- (22) Gasparov, L. V., Lemmens, P., Kolesnikov, N. N. & Guntherodt, G. Electronic Raman scattering in Tl2Ba2CuO6+δ : Symmetry of the order parameter, oxygen doping effects, and normal-state scattering. Phys. Rev. B 58, 11573 (1998).
- (23) Staufer, T. et al. Investigation of the Superconducting Order Parameter in Bi2Sr2CaCu2O8 Single Crystals. Phys. Rev. Lett. 68, 1069 (1992).
- (24) Branch, D. & Carbotte, J. P. Raman electronic continuum in a spin-fluctuation model for superconductivity. Phys. Rev. B 52, 0603 (1995).
- (25) Nemetschek, R. et al. Pseudogap and Superconducting Gap in the Electronic Raman Spectra of Underdoped Cuprates. Phys. Rev. Lett. 78, 4837 (1997).
- (26) Blumberg, G. et al. Evolution of Magnetic and Superconducting Fluctuations with Doping of High- Superconductors. Science 278, 1427 (1997).
- (27) Yamamoto, A., Hu, W. Z. & Tajima, S. Thermoelectric power and resistivity of HgBa2Cu04+δ over a wide doping range. Phys. Rev. B 63, 024504 (2000).
- (28) Bobroff, J. et al. 17O NMR Evidence for a Pseudogap in the Monolayer HgBa2CuO4+δ. Phys. Rev. Lett. 78, 3757 (1997).
- (29) Venturini, F. et al. Observation of an Unconventional Metal-Insulator Transition in Overdoped CuO2 Compounds. Phys. Rev. Lett. 89, 107003 (2002).
- (30) Tallon, J. L. & Loram, L. W., The doping dependence of what is the real high-Tc phase diagram?,Physica C 349, 53 (2001).
- (31) Deutscher, G., Coherence and single-particle excitations in the high-temperature superconductors, Nature 397, 410 (1999).
- (32) Tanaka, K. et al. Distinct Fermi-Momentum Dependent Energy Gaps in Deeply Underdoped Bi2212. Science 314, 1910 (2006).
- (33) Kondo, T. et al. Evidence for Two Energy Scales in the Superconducting State of Optimally Doped (Bi,Pb)2(Sr,La)2CuO6+δ. Phys. Rev. Lett. 98, 267004-267004 (2007).
- (34) Yu L., et al., Spectroscopic distinction between the normal state pseudogap and the superconducting gap of cuprate high superconductors. Preprint at http://arxiv.org/abs/0705.0111 (2007).
- (35) Anderson, P.W. The resonating valence bond state in La2CuO4 and superconductivity. Science 235, 1196 (1987).
- (36) Varma, C. M. Non-Fermi-liquid states and pairing instability of a general model of copper oxide metals. Phys. Rev. B 55, 14554 (1997).
- (37) Benfatto, L., Caprara, S. & Di Castro, C. Gap and pseudogap evolution within the charge-ordering scenario for superconducting cuprates. Eur. Phys. J. B 17, 95-102 (2000).
- (38) Chakravarty, S., Laughlin, R. B., Morr, D. K. & Nayak, C. Hidden order in the cuprates. Phys. Rev. B 63, 094503 (2001).
- (39) Aichhorn, M., Arrigoni, E., Huang, Z. B. & Hanke, W. The superconducting gap in the Hubbard model and the two gap energy scales in high-Tc cuprates. Preprint at http://arxiv.org/abs/0702.391 (2007).
- (40) M. Civelli et al., Nodal/Antinodal dichotomy and the energy-gaps of a doped Mott Insulator. Preprint at http://arxiv.org/abs/0704.1486 (2007).
- (41) Valenzuela, B. & Bascones, E. Phenomenological Description of the Two Energy Scales in Underdoped Cuprate Superconductors. Phys. Rev. Lett. 98, 227002-227004 (2007).
- (42) Presland, M. R. et al. General trends in oxygen stoichiometry effects on in Bi and Tl superconductors. Physica C 176, 95 (1991).
ACKNOWLEDGEMENTS
We are grateful to Ph. Monod, Y. Gallais, G. Kotliar and A. Millis for very helpful discussions.