Comment on “Limits on the Time Variation of the Electromagnetic Fine-Structure Constant…”
In their Letter Srianand et al. (2004) (also Chand et al. (2004)), Srianand et al. analysed optical spectra of heavy-elements in 23 absorbers along background quasar sight-lines, reporting limits on variations in the fine-structure constant, : . This would contradict previous evidence (e.g. Webb et al., 1999; Murphy et al., 2003) for a smaller in the absorption clouds compared to the laboratory: Murphy et al. (2004). Here we demonstrate basic flaws in the analysis of Srianand et al. (2004) using the same data and absorption profile fits.
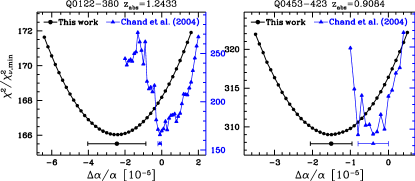
For each absorber, is measured using a minimization of a multiple-component Voigt profile fit to the absorption profiles of several transitions. The column densities, Doppler widths and redshifts defining the components are varied iteratively until the decrease in between iterations falls below a specified tolerance, . In our approach, we simply add as an additional free parameter whereas Srianand et al. (2004) keep it as an external one: for each fixed input value of the other, free parameters are varied to minimize . The functional form of implies that, in the vicinity of the best-fitting , the ‘ curve’ – the value of as a function of – should be near parabolic and smooth. That is, should be to ensure that fluctuations on the curve are also . This is crucial for deriving the 1- uncertainty in from the width of the curve at .
However, none of Srianand et al.’s curves – figure 2 in Srianand et al. (2004), 14 in Chand et al. (2004) – are smooth at the level; many fluctuations exceed unity. Two examples are reproduced in Fig. 1. The fluctuations can only be due to failings in the minimization: even when Chand et al. (2004) fit simulated spectra (their figure 2) jagged curves result, leading to a strongly non-Gaussian distribution of values and a large range of 1- uncertainties (their figure 6). Clearly, these basic flaws in the parameter estimation will yield underestimated uncertainties and spurious values.
To demonstrate these failings, we apply the same profile fits to the same data but with a robust minimization. The spectra were kindly provided by B. Aracil who confirmed that the wavelength and flux arrays are identical to those in Srianand et al. (2004). For each absorber, the best-fitting profile parameters of Chand et al. (2004) were treated as first guesses in our minimization procedure (detailed in Murphy et al. (2003)). The relationships between the Doppler widths of corresponding velocity components in different transitions were also the same, as were the relevant atomic data. The relative tolerance for halting the minimization was . All absorbers yield smooth curves in new our analysis; Fig. 1 shows two examples.
By-products of this analysis are revised values of and 1- errors. We find 14 of the 23 values deviate by from those of Srianand et al. (2004). Moreover, the errors are almost always larger, typically by a factor of 3. The formal weighted mean over the 23 absorbers becomes but the scatter in the values is well beyond that expected from the errors. This probably arises from many sources, including overly simplistic profile fits (see Murphy et al. (2007)). Allowing for additional, unknown random errors by increasing the error-bars to match the scatter (i.e. about the weighted mean), a more conservative result from the data and fits of Srianand et al. (2004) is – a 6-fold larger uncertainty than quoted by Srianand et al. (2004). We conclude that the latter offers no stringent test of previous evidence for varying ; this must await a future, extensive statistical approach.
M. T. Murphy,1,2 J. K. Webb,3 V. V. Flambaum3
1Centre for Astrophysics & Supercomputing, Swinburne
University of Technology, Victoria 3122, Australia
2Institute of Astronomy, University of Cambridge
Madingley Road, Cambridge CB3 0HA, UK
3School of Physics, University of New South Wales
Sydney, NSW 2052, Australia
References
- Srianand et al. (2004) R. Srianand et al., Phys. Rev. Lett. 92, 121302 (2004).
- Chand et al. (2004) H. Chand et al., Astron. Astrophys. 417, 853 (2004).
- Webb et al. (1999) J.K. Webb et al., Phys. Rev. Lett. 82, 884 (1999).
- Murphy et al. (2003) M.T. Murphy et al., Mon. Not. Roy. Soc. 345, 609 (2003).
- Murphy et al. (2004) M.T. Murphy et al., Lecture Notes Phys. 648, 131 (2004).
- Murphy et al. (2007) M.T. Murphy et al., arXiv:astro-ph/0612407.
Discussion of Srianand et al.’s Reply to our Comment
Our Comment (arXiv:0708.3677) sought to demonstrate that the results of Srianand et al. Srianand et al. (2004) (also Chand et al. (2004)) were not robust and were based on a measurement technique which failed in a fundamental way. The numbers emerging from the failed algorithm are meaningless, as discussed again below; they cannot even be considered approximately correct. Indeed, when we apply the same measurement technique (without the failure) to the same data, using the same profile fits as Srianand et al. (2004); Chand et al. (2004), we find very different values of and errors which are typically a factor of 3 larger. We present much more detail of that analysis in Murphy et al. (2007).
In their Reply (arXiv:0711.1742), Srianand et al. state or argue several points, all of which we dismiss below either because they are demonstrably incorrect or because they rely on a flawed application of simple statistical arguments. In order of importance:
Point (i): Despite demonstrating in our Comment that the measurement procedure used by Srianand et al. (2004); Chand et al. (2004) failed, their Reply argued that indeed their “procedure is robust as shown in” Chand et al. (2004). Much of the discussion and Fig. 1 in our Comment – and, indeed, Srianand et al.’s own figures (2 in Srianand et al. (2004), 14 in Chand et al. (2004)) – demonstrate the precise opposite, i.e. that large fluctuations on the curves are clearly present. This means that at any given point on a curve (i.e. for a given input value of ), the true minimum of cannot have been reached. Therefore, the true curve must lie entirely beneath that derived by Srianand et al. (2004); Chand et al. (2004) for most absorbers. That is to say, the curves of Srianand et al. (2004); Chand et al. (2004) simply cannot be used to infer any values of or their 1- errors whatsoever. Nor can values of (or uncertainties) one chooses to infer from them even be considered ‘approximately correct’ in any meaningful way. These basic and fundamental aspects of fitting cannot be overemphasized: curves with large fluctuations provide no meaningful measurement of any kind.
In their Reply, Srianand et al. also “point out that fluctuations in curves get indeed smoothed after a large number of iterations but the results from the first and last iterations are found to be very similar”. It must again be strongly emphasized that fluctuations on a curve indicate nothing but the simple fact that has not been reduced to its true minimum value at some, if not all points on the curve. One can not “smooth” these fluctuations in any way, not by averaging many “iterations” together (as may be implied by the above statement), nor by fitting a parabolic or polynomial line through the curve as one would fit a model to noisy data. It is not “noise” at all, but just an indication that the algorithm for reducing has failed. One simply has to identify the coding error, bug or mis-use of the algorithm which is preventing from reaching its minimum.
Srianand et al. Srianand et al. (2004); Chand et al. (2004) also argue that their measurement procedure is robust based on measurements using simulated absorption systems and these are referred to again in their Reply. However, as we pointed out in our Comment (and in more detail in Murphy et al. (2007)), those simulations actually demonstrate the precise opposite: strong fluctuations even appear in the curves for these simulations (figure 2 in Chand et al. (2004)). This leads to spurious values: figure 6 in Chand et al. (2004) shows the results from 30 realizations of a simulated single-component Mg/Fe ii absorber. At least 15 values deviate by from the input value; 8 of these deviate by and 4 by . There is even a - value. The distribution of values should be Gaussian in this case but these outliers demonstrate that it obviously is not. The fluctuations also cause the uncertainty estimates from the different realizations to range over a factor of even though all had the same simulated spectral signal-to-noise and input profile fitting parameters. None of these problems arise in our own simulations of either single- or multiple-component systems (see Murphy et al. (2003) for detailed discussion).
Point (ii): We used smaller error spectra in our Comment compared to the original analysis of Srianand et al. (2004); Chand et al. (2004), as described in detail in Murphy et al. (2007). Although Srianand et al. point out this fact in their Reply, they do not discuss its import. We do so in Murphy et al. (2007). To summarize: The main argument in our Comment is that the error bars of Srianand et al. (2004); Chand et al. (2004) are underestimated. The fact that we used smaller error arrays and still found much larger errors on than Srianand et al. (2004); Chand et al. (2004) only emphasizes this argument more. Using somewhat larger error arrays would simply lead to somewhat larger uncertainties on and change the actual measured values of negligibly. Thus, “Point 2” in the Reply actually reinforces our conclusion that the data and fits do not offer a stringent test of previous evidence for a varying .
Point (iii): The Reply argues that many of our revised values of “match” the original values of Chand et al. (2004) “at level” and, therefore, that the original results are robust. Three simple points can be made here; the first two (1 & 2) are practical while the third (3) is a more important general one:
-
1.
A matching criterion of “” is used for each value of , but it isn’t clear if “” is the original uncertaintiy from Srianand et al. (2004); Chand et al. (2004) or our revised value which is typically larger by a factor of 3. More importantly, we cannot replicate the number of systems which supposedly “match”, i.e. 16. Using the uncertainty values from Srianand et al. (2004); Chand et al. (2004) as “” we find 11 ‘matching’ values of . Using our new uncertainties gives 13 ‘matches’. Finally, adding the two uncertainty values in quadrature and treating that as “” gives 14 systems.
-
2.
Even if the old and new values were statistically independent, how many values would one expect to “match” given the general distribution of values and uncertainties in both measurement sets? Whatever that number, even more values would “match” when we consider that the new and old values are in fact correlated. Therefore, at least some of the 16 ‘matches’ the Reply cites cannot be argued to bolster a case for the robustness of either the old or new values. Only if one found many more matches than one expects, given the two sets of values and their errors, would there be some case for that.
-
3.
The more important general point is that the usual “1 ” threshold is meaningless here because the new and old values are not independent in any respect. When such non-independent data are being compared, it should actually be very few values (not 32% as for truly independent values) which would deviate by more than one formal standard deviation. Only if the deviation was very small with respect to the (old or new) 1- uncertainties could one claim that the faults in the minimization algorithm had negligible importance and that the original results were robust. The large deviations we observe – 14 of the new 23 values deviate from the old by – clearly imply that the old results were not robust at all.
Point (iv): The Reply discusses how two values in our revised set deviate by more than 4 (presumably with respect to ) and Srianand et al. choose to remove them from the sample. How can one decide which systems are best to remove based only on the parameter of interest, in this case the value (or significance) of ? This is obviously a very biased selection method. In our Comment, this is why we chose to increase the error bars on all values to match the observed scatter. Although itself not ideal, this is at least an unbiased procedure. Our main point remains whatever procedure one chooses: the constraints obtained from the data and fits of Srianand et al. (2004); Chand et al. (2004) can not be regarded as robust, nor are they a stringent test of previous evidence for varying .
Point (v): Srianand et al.’s Reply states that their “procedure takes into account the differences in spectral resolution in different settings … while this is not the case with vpfit”. This is simply incorrect, as is easily verified by reading the vpfit manual at http://www.ast.cam.ac.uk/rfc/vpfit.html [for the current versions (8 & 9), this is mentioned in the first few lines of the introduction]. vpfit has always has this feature. Differences in resolution between different portions of input spectra were taken into account in all previous analyses of Keck/HIRES spectra in Webb et al. (1999); Murphy et al. (2003, 2004) using vpfit.