Thermonuclear Flame Spreading on Rapidly Spinning Neutron Stars: Indications of the Coriolis Force?
Abstract
Millisecond period brightness oscillations during the intensity rise of thermonuclear X-ray bursts are likely caused by an azimuthally asymmetric, expanding burning region on the stellar surface. The time evolution of the oscillation amplitude during the intensity rise encodes information on how the thermonuclear flames spread across the stellar surface. This process depends on properties of the accreted burning layer, surface fluid motions, and the surface magnetic field structure, and thus can provide insight into these stellar properties. We present two examples of bursts from different sources that show a decrease in oscillation amplitude during the intensity rise. Using theoretical modeling, we demonstrate that the observed amplitude evolution of these bursts is not well described by a uniformly expanding circular burning region. We further show that by including in our model the salient aspects of the Coriolis force (as described by Spitkovsky, Levin, and Ushomirsky) we can qualitatively reproduce the observed evolution curves. Our modeling shows that the evolutionary structure of burst oscillation amplitude is sensitive to the nature of flame spreading, while the actual amplitude values can be very useful to constrain some source parameters.
1 Introduction
Millisecond period brightness oscillations, “burst oscillations”, during thermonuclear X-ray bursts (Strohmayer & Bildsten 2006; Woosley & Taam 1976; Lamb & Lamb 1978) from accreting neutron stars were first discovered with the Rossi X-ray Timing Explorer (RXTE) in 1996 (Strohmayer et al.). Since then, a total of 19 low mass X-ray binaries (LMXBs; including three tentative detections; Thompson et al. 2005; Kaaret et al. 2007; Bhattacharyya 2007) have exhibited this timing feature (see Lamb & Boutloukos 2007; Bhattacharyya et al. 2006; Markwardt et al. 2007). The discovery of burst oscillations at the spin frequencies of the accreting millisecond pulsars SAX J1808.4–3658 and XTE J1814–338 (see Chakrabarty et al. 2003; Strohmayer et al. 2003) has conclusively linked these oscillations to neutron star spin, and showed that the burst oscillation frequency gives a direct measure of the stellar spin frequency. This discovery has also established that burst oscillations originate at the stellar surface, and hence can be very useful to constrain neutron star mass and radius (Miller, & Lamb 1998; Muno et al. 2002). Measurements of these stellar parameters are critical to understand the nature of high-density matter inside neutron stars, which is a fundamental problem of physics (Bhattacharyya et al. 2005).
Thermonuclear X-ray bursts also provides a powerful tool to probe the physics of flame spreading under the extreme conditions that exist on neutron stars. This is because bursts ignite at a particular point on the stellar surface, and then spread to burn all the surface fuel (Fryxell & Woosley 1982; Spitkovsky et al. 2002; Bhattacharyya & Strohmayer 2006a; 2006b). As flame spreading depends on shearing flows in the surface layers (Spitkovsky et al. 2002), the study of this spreading can be very useful to understand surface fluid motions. Moreover, flame spreading can be helpful for mapping the magnetic field structure on the stellar surface. This is because the shearing flows present during flame spreading can make this field locally strong, which may in turn act back on the flow (Spitkovsky et al. 2002; Bhattacharyya & Strohmayer 2006c). However, a detailed theoretical study of flame spreading including all relevant physical effects has not yet been done, perhaps partly due to a lack of observational motivation. Such motivation includes the significant detection and measurement of the diagnostic features, such as the evolution of spectral and burst oscillation properties during the spreading. But, flame spreading is expected to occur during burst rise, and in this short period (sub-second to a few seconds) the significant detection of the diagnostic aspects is difficult due to the statistical quality of the present data.
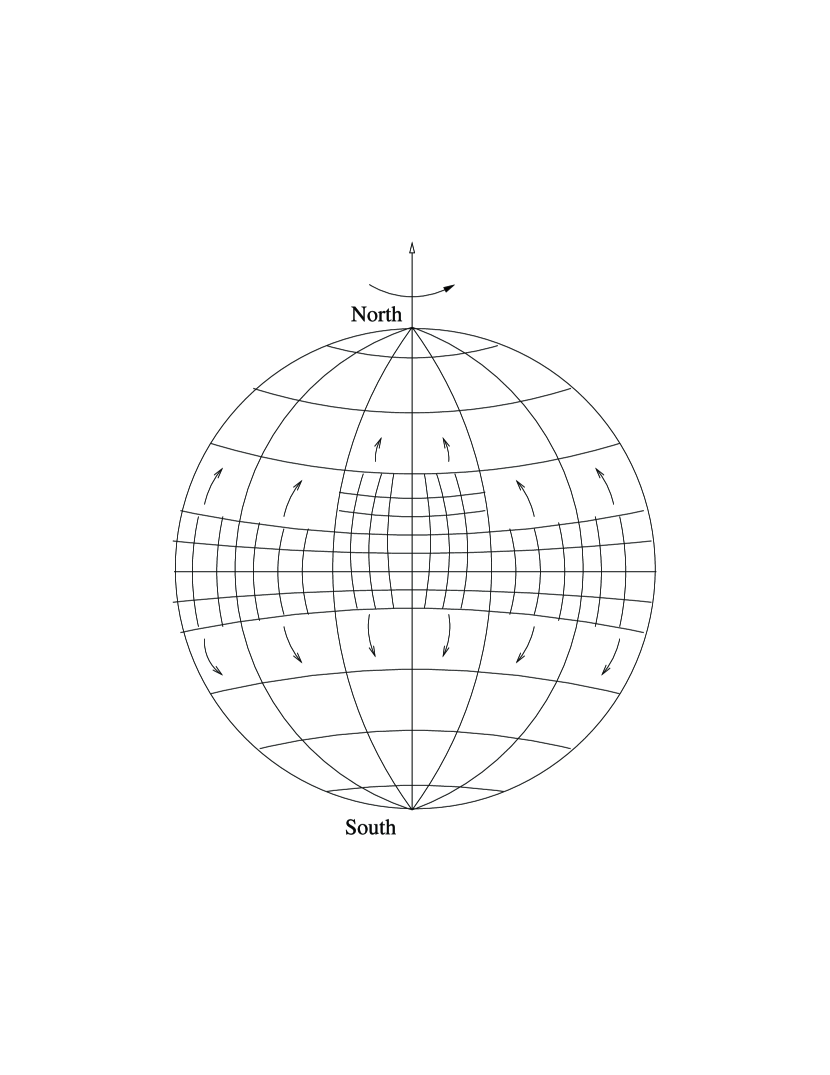
Recently Spitkovsky et al. (2002) have proposed a theoretical model of flame spreading on rapidly spinning neutron stars including the effects of the Coriolis force. According to these authors, after ignition the Coriolis force is initially not important due to the small size of the burning region (which implies a large Rossby number). During this time the flame spreads quickly with the so-called geostrophic speed. So, the burning region (hot spot) attains a considerable size almost at the beginning of the burst rise. After this, for a rapidly spinning neutron star the Coriolis force becomes important, and the flame spreads as a shearing flow with the much slower ageostrophic speed. This speed decreses as the burning front latitude increases, which causes a portion of the burning region to encircle the stellar equator quickly, maintaining an asymmetric portion at higher latitudes for some more time (for mid-latitude ignition; Fig. 8c of Spitkovsky et al. 2002; see also Bhattacharyya & Strohmayer 2006c).
Strohmayer et al. (1997) found that during the rise of some bursts from the LMXB 4U 1728–34, the oscillation amplitude diminished, which is expected for an expanding burning region during burst rise. These initial results suggested that the tracking of amplitude evolution can be a useful probe of flame spreading. However, more detailed observational measurements of amplitude evolution have been found and reported only recently (for 4U 1636–536 and SAX J1808.8–3658; Bhattacharyya & Strohmayer 2005; 2006c). In this Letter (in § 2), we first show that these more detailed evolutionary curves exhibit amplitude changes (decreasing with burst rise). Then, using theoretical models we demonstrate that these observed curves cannot be easily explained with a uniformly expanding hot spot. Finally, we show that models that include the salient features of the Coriolis force can qualitatively reproduce the observed curves. In § 3, we discuss the implications of our analysis.
2 Analysis
Tracking the burst oscillation amplitude evolution during burst rise requires a strong oscillation throughout the rise. Therefore, given the (1) small duty cycle of bursts, (2) non-detection of burst rise oscillations for some bursts, (3) short burst rise period, (4) low count rate during the early burst rise, and the fact that only RXTE can currently detect burst oscillations, so far clear amplitude evolution curves (for burst rise) have been reported only for two bursts (See Fig. 1) from two rapidly spinning neutron stars (4U 1636–536: spin frequency Hz; and SAX J1808.8–3658: Hz). Hence, if flame spreading is influenced by the Coriolis force, then the bursts from these two sources should show this influence. The evolutionary curve for each of these bursts is consistent with a rapid amplitude decay, followed by a nearly constant level of significantly non-zero oscillation amplitude for some time. Before using these observed properties to probe flame spreading, first we show that the data are not consistent with a constant amplitude level. In order to demonstrate this, we have fitted each data set with a constant amplitude, and the best-fit levels are shown in Fig. 1. The resulting for these levels (20.7/7 for 4U 1636–536, and 18.1/9 for SAX J1808.8–3658) clearly shows the significant decrease of the amplitude during burst rise. Motivated by this, we have theoretically computed oscillation amplitude evolution for an expanding hot spot on a neutron star’s surface assuming various source parameter values. Although some previous studies explored such model computations (Strohmayer et al. 1997; Nath et al. 2002; Strohmayer 2004), here we calculate and compare various models in detail for the first time.
We have started with the simplest spreading geometry, viz, a uniformly expanding circular hot spot. If the effect of stellar spin (and hence the Coriolis force) on spreading is negligible, then this may be a reasonable approximation to how flames actually spread. This is because, with a relatively low stellar magnetic field ( G) for LMXBs, the accreted matter (fuel) should not be confined, and should be present all over the surface almost uniformly. In our calculations, we have considered eight source parameters (see also Bhattacharyya et al. 2005): (1) the dimensionless neutron star radius-to-mass ratio , (2) the stellar mass , (3) , (4) the observer’s inclination angle , (5) the polar angle of the hot spot center, (6) the angular radius of the spot, (7) the blackbody temperature of the spot (burst spectra can normally be well fitted with a blackbody model; Strohmayer & Bildsten 2006), and (8) a parameter that gives a measure of the beaming in the emitter’s frame, where the specific intensity as a function of the angle (in the emitter’s frame) from the surface normal is . This beaming may be due to the scattering of burst photons in an optically thick layer of thermal electrons. Note that for semi-infinite plane-parallel layers with a constant net flux and Thomson scattering, (Chandrasekhar 1960). In our calculation of energy dependent flux from a hot spot, we have taken into account (1) Doppler and special relativistic effects, (2) gravitational redshift, and (3) light-bending (in a Schwarzschild spacetime). In order to include light-bending, we have backtracked the paths of the photons from the observer to the source (see Bhattacharyya et al. 2001; 2005). The model light curve is calculated by repeating the same procedure for many identical spots at different -positions (but the same -position) on the surface of the star. The actual phase points of the light curve are calculated from these -positions, the stellar spin frequency, and the time delay considerations. The time delays result from the fact that photons emitted at different points on the stellar surface take different times to reach the observer. We have then folded this model light curve with a suitable RXTE PCA response matrix, and determined the oscillation amplitude in the same way it was determined from the data. We have repeated this procedure for many hot spots with increasing (for a chosen combination of other parameter values) to determine the oscillation amplitude evolution.
In Fig. 2, we have plotted these evolutionary curves for various parameter values. Note that, here, we only show the points with fractional peak amplitude less than 1. Fig. 2 clearly shows that the model curves for widely different parameter values are qualitatively very similar, that is, the amplitude first decreases slowly, and then decreases rapidly. On the other hand, the observed curves of Fig. 1 first decrease rapidly, and then maintain a significantly non-zero level. A qualitative comparison of Fig. 1 & 2 suggests that the uniform expansion of a circular hot spot cannot easily explain the observed amplitude evolution during rise for these bursts. Fig. 2 also shows that the oscillation amplitude increases with the increase of , , , (except when is close to ), and , and with the decrease of and . Among these parameters, , , and affect the amplitude the most (apart from , which is not a free parameter for an evolutionary curve), with the first two having the maximum effects. Consequently, these parameter values can be measured more confidently from oscillation amplitudes (see the last sentence of § 2). We note that a large variation of does not change the amplitude very much, which justifies (given the quality of data) our use of the same blackbody temperature throughout the flame spreading.
Motivated by the suggestion that the flames probably do not spread isotropically and uniformly on a rapidly spinning neutron star’s surface, we included some qualitative features of the Coriolis force (mentioned in § 1) in our modeling. For a chosen combination of source parameter values, we started with an already large hot spot (because of initially fast geostrophic flow; § 1) in a chosen -range and -range in the low- to mid-latitudes. Most of the hot spot was in the northern hemisphere (through which the observer’s line of sight passes), and crossed the equator only slightly. Then we allowed a very narrow -portion (of the spot) on the equator to spread in the -directions with a speed proportional to (Spitkovsky et al. 2002). Here, we assumed an average -value, and kept the -direction speed unchanged until a -symmetric belt around the equator was formed. This narrow -expanding portion was also allowed to simultaneously expand in -directions with a speed proportinal to , where is the instantaneous polar angle of the northern and southern burning fronts. In addition, the north edge of the original hot spot was allowed to expand northwards with the same speed formula. As a result of such spreading, the hot spot had two portions (see Fig. 3): (1) an equatorial portion that encircled the equator quickly, and expanded north and southwards simultaneously (but progressively at a slower rate); and (2) a -asymmetric portion, that moved northwards, and became gradually narrower (in -direction) because of the assumed spreading speed formula. The rapid formation of the equatorial belt is expected to cause a fast decay of the amplitude, and subsequently the mid- to high-latitude -asymmetric portion should give rise to a lower amplitude that decreases (more slowly) primarily because of the increasing persistent contribution from the expanding -symmetric belt. Our model calculation shows this expected evolution (see Fig. 4), which qualitatively remains the same for widely different values of , , , , and , and is qualitatively similar to the observed evolution shown in Fig. 1. Here we note that, while the models show the amplitude evolution from the beginning of flame spreading (except the initial very rapid spreading) up to the later part, the data of Fig. 1 may be for an intermediate time phase of spreading. This is because, the observed oscillation power may not be significant (1) in the initial phase due to the low count rate, and (2) in the final phase due to the low amplitude. Finally, although the evolutionary structures of the models of Fig. 2 and the models of Fig. 4 are different, the dependence of amplitude on each source parameter is the same for both sets of models.
3 Discussion and Conclusions
In this Letter, we have, for the first time, reported a detailed comparison among theoretical models of burst oscillation amplitude evolution during burst rise in order to probe the flame spreading phenomenon. Our fitting of burst rise data from two different bursts from two rapidly spinning neutron stars indicate that the oscillation amplitude first decays quickly, and then maintains a non-zero near-constant level. We have shown that such behavior cannot be qualitatively explained with a simple uniform expansion of a circular hot spot. However, we note that if the circular hot spot first expands rapidly, and then, after attaining a large size (covering most of the stellar surface), expands with more than an order of magnitude slower speed, then the observed amplitude curves may be reproduced. But, such a dramatic time dependence of expansion may not be realistic. Inclusion of Coriolis force effects, on the other hand, can provide a natural explanation of the observed amplitude curves. We have included some salient features of these effects (based on the work of Spitkovsky et al. 2002) into our spreading model, and found that these new model amplitude evolutions are qualitatively similar to those observed. This suggests that we may be seeing, for the first time, effects of the Coriolis force on the surface layers of fast spinning neutron stars. This also provides additional motivation to theoretically study thermonuclear flame spreading phenomena considering all the main physical effects. Our modeling also shows that the time evolution of burst oscillation amplitude is sensitive to the nature of flame spreading, while the actual amplitude values strongly depend on some source parameters, such as , , etc. Therefore, understanding flame spreading, and constraining the source parameters should be achieveable with detailed modeling of higher signal to noise ratio observations of the burst oscillation sources. Such data may be obtainable with future X-ray missions such as ASTROSAT, Constellation-X, XEUS, or a large-area “Super-RXTE” timing mission.
References
- (1) Bhattacharyya, S. 2007, MNRAS, 377, 198
- (2) Bhattacharyya, S., Bhattacharya, D., & Thampan, A. V. 2001, MNRAS, 325, 989
- (3) Bhattacharyya, S., & Strohmayer, T. E. 2005, ApJ, 634, L157
- (4) Bhattacharyya, S., & Strohmayer, T. E. 2006a, ApJ, 636, L121
- (5) Bhattacharyya, S., & Strohmayer, T. E. 2006b, ApJ, 641, L53
- (6) Bhattacharyya, S., & Strohmayer, T. E. 2006c, ApJ, 642, L161
- (7) Bhattacharyya, S., Strohmayer, T. E., Markwardt, C. B., & Swank, J. H. 2006, ApJ, 639, L31
- (8) Bhattacharyya, S., Strohmayer, T. E., Miller, M. C., & Markwardt, C. B. 2005, ApJ, 619, 483
- (9) Chakrabarty, D., Morgan, E. H., Muno, M. P., Galloway, D. K., Wijnands, R., van der Klis, M., & Markwardt, Craig B. 2003, Nature, 424, 42
- (10) Chandrasekhar, S. 1960, Radiative Transfer, Dover Publications.
- (11) Fryxell, B. A., & Woosley, S. E. 1982, ApJ, 261, 332
- (12) Kaaret, P. et al. 2007, ApJ, 657, L97
- (13) Lamb, F. K., & Boutloukos, S. 2007 (arXiv: 0705.0155)
- (14) Lamb, D. Q., & Lamb, F. K. 1978, ApJ, 220, 291
- (15) Markwardt, C. B., Klein-Wolt, M., Swank, J. H., & Wijnands, R. 2007, ATel, 1068
- (16) Miller, M. C., & Lamb, F. K. 1998, ApJ, 499, L37
- (17) Muno, M. P., Özel, F., & Chakrabarty, D. 2002, ApJ, 581, 550
- (18) Nath, N. R., Strohmayer, T. E., & Swank, J. H. 2002, ApJ, 564, 353
- (19) Spitkovsky, A., Levin, Y. & Ushomirsky, G. 2002, ApJ, 566, 1018
- (20) Strohmayer, T. E. 2004, in X-ray Timing 2003: Rossi and Beyond, AIP Conference Proceedings, Eds. P. Kaaret, F. K. Lamb and J. H. Swank, (Melville, NY: American Institute of Physics), 714, 245
- (21) Strohmayer, T. E., & Bildsten, L. 2006, in Compact Stellar X-ray Sources, Eds. W.H.G. Lewin and M. van der Klis, (Cambridge University Press: Cambridge), p. 113
- (22) Strohmayer, T. E., Markwardt, C. B., Swank, J. H., & in’t Zand, J. 2003, ApJ, 596, L67
- (23) Strohmayer, T. E. et al. 1996, ApJ, 469, L9
- (24) Strohmayer, T. E., Zhang, W., & Swank, J. H. 1997, ApJ, 487, L77
- (25) Thompson, T. W. J., Rothschild, R. E., Tomsick, J. A., & Marshall, H. L. 2005, ApJ, 634, 1261
- (26) Woosley, S. E., & Taam, R. E. 1976, Nature, 263, 101