Two-Dimensional Spectroscopy of Photospheric Shear Flows in a Small Spot
Abstract
In recent high-resolution observations of complex active regions, long-lasting and well-defined regions of strong flows were identified in major flares and associated with bright kernels of visible, near-infrared, and X-ray radiation. These flows, which occurred in the proximity of the magnetic neutral line, significantly contributed to the generation of magnetic shear. Signatures of these shear flows are strongly curved penumbral filaments, which are almost tangential to sunspot umbrae rather than exhibiting the typical radial filamentary structure. Solar active region NOAA 10756 was a moderately complex, sunspot group, which provided an opportunity to extend previous studies of such shear flows to quieter settings. We conclude that shear flows are a common phenomenon in complex active regions and spots. However, they are not necessarily a prerequisite condition for flaring. Indeed, in the present observations, the photospheric shear flows along the magnetic neutral line are not related to any change of the local magnetic shear. We present high-resolution observations of NOAA 10756 obtained with the 65-cm vacuum reflector at Big Bear Solar Observatory (BBSO). Time series of speckle-reconstructed white-light images and two-dimensional spectroscopic data were combined to study the temporal evolution of the three-dimensional vector flow field in the sunspot group. An hour-long data set of consistent high quality was obtained, which had a cadence of better than 30 seconds and sub-arcsecond spatial resolution.
keywords:
Active Regions, Magnetic Fields; Active Regions, Velocity Field; Sunspots, Magnetic Fields; Sunspots, Penumbra; Flares, Pre-Flare Phenomena; Flares, Relation to Magnetic Field1 Introduction
The solar surface is highly dynamic and magnetic fields on various spatial scales, from active regions and sunspots to network fields and faculae, are intricately intertwined with the plasma motions. Photospheric flow fields are important in the context of solar eruptive phenomena such as flares, filament/prominence eruptions, and coronal mass ejections (CMEs). In high-resolution studies of solar active region NOAA 10486, \inlineciteYang2004 and \inlineciteDeng2006 find strong shear flows close to the magnetic neutral line, which are attributed to the slow energy build-up before its sudden release in the flare. The local magnetic fields were highly non-potential and in this case magnetic shear was the source of the free energy. However, the question remains open if magnetic shear already existed when the magnetic field emerged. This is of particular interest at the interface of solar dynamo theory and the theory of flares and CMEs, since magnetic shear is related to highly-twisted magnetic flux tubes, which can be generated by kink instability while the flux tube rises from the bottom of the solar convection zone [Fisher et al. (2000)].
Amari2000 showed that twisted flux tubes play a crucial role in the theory of large-scale solar eruptive phenomena such as CMEs and two-ribbon flares. If photospheric twist is applied to the footpoints of an arcade-like magnetic field structure, the filament might become unstable and erupt. In this scenario, spots play a distinct role as the origin of a complex magnetic topology in the corona, which makes it conducive to eruptions. Therefore, multi-polar fields are important in the study and modeling of flares, filament/prominence eruptions, and CMEs. The evolution of flares can be explained by a magnetic breakout process first described by \inlineciteAntiochos1999, i.e., magnetic reconnection at a null point that is located high in the corona is opening initially low-lying sheared fields leading to the flare, filament eruption and CME. \inlineciteAulanier2000 further elaborate that a three-dimensional magnetic null point exists in the corona above the spot and that reconnection occurs at the null point long before the flare. However, there is an on-going debate centered on the exact location and type of reconnection. For example, \inlineciteMoore2001 present an opposing view in terms of the standard bipolar model for eruptive flares, where they conceptually tie the sheared and twisted core fields of a bipolar active region to a runaway “tether-cutting” via impulsive reconnection.
In recent high-resolution observations, many phenomena were discovered, which are directly related to eruptive phenomena such as the rapid penumbral decay as a consequence of flares (\openciteWang2004; \openciteDeng2005; \openciteLiu2005; \openciteSudol2005), the detection of photospheric shear flows near the magnetic neutral line and close to flare kernels (\openciteYang2004; \openciteDeng2006), and the first near-infrared (NIR) continuum observations of flares [Xu et al. (2004)]. Flare-associated shear flows are not a new phenomenon. During the major flares in August 1972, \inlineciteZirin1973 measured spectroscopically strong photospheric velocity discontinuities of up to 6 km s-1 in the vicinity of neutral lines. In more recent observations, converging Doppler velocities were observed in the vicinity of spots. (e.g., \inlineciteLites2002). These flows were interpreted as an interleaved system of field lines, where the outward Evershed flow sharply bends downward and returns to the solar interior.
In this study, we use two-dimensional spectroscopy to gain access to Doppler velocities. Complementary observations of horizontal flows derived with local correlation tracking (LCT, \openciteNovember1988) allow us to obtain a more complete picture of the intricate flow field related to spots. These high-cadence observations (30 seconds or less) of the photosphere in combination with high-resolution observations of transition region and corona have the potential to provide a comprehensive picture of rapid changes related to magneto-convection and magnetic field evolution.
In Section 2, we introduce the observations, provide detailed accounts of the data calibration, and discuss their limitations in the context of our scientific objectives. The results are presented in Section 3, where we describe the intricate, three-dimensional flow fields encountered in NOAA 10756 with a particular emphasis on the configuration. We discuss the results in Section 4 and conclude this study of complex flow fields in sunspots with a summary of the most important results in Section 5.
2 Observations
In the Summer of 2005, we obtained the first visible-light data with the 65-cm vacuum reflector and its new high-order adaptive optics (AO) system. Two-dimensional imaging spectroscopy and speckle masking imaging were employed to measure, besides other quantities, solar vector flow fields.
NOAA 10756 was selected as a promising target to study the dynamics in an active region prior to an eruptive event, since it showed some moderate magnetic complexity including a small configuration in its southern part. However, the region did not produce any major M- or X-class flares during its disk passage. In principle, scenarios with small flares (and even without any flares) should receive the same attention as X-class events or geo-effective CMEs. Otherwise, our views of such events might be skewed and we associate phenomena with eruptive events that might be common to non-eruptive scenarios as well. This is particularly true for high-resolution observations, which are rich in detail and highly dynamic.
At the beginning of its disk passage on 26 April 2005, NOAA 10756 produced several C-class flares. The largest event was an impulsive C5 flare. On 27 April, the region grew rapidly, predominantly in a spot attached to the southern portion of the large sunspot. Despite its growth, NOAA 10756 only produced lower-level C-class events. From 29 April to 1 May, the active region reached its maximum area (about 1000 millionths of a solar hemisphere) before it started to decay. We observed the moderately-complex configuration on 2 May 2005, when it was located at heliographic coordinates S8∘ W23∘ (). At this time the region was already decaying, however, it was still classified as a region. Only during the last few days of its disk passage a C7 and two M1 flares occurred, while the active region continued to decay.
| Type | Start | End | FOV | |||||
| Speckle Reconstruction | nm | 17:01:07 UT | 17:30:57 UT | 30 s | 60 | pixel-1 | 10 ms | |
| Speckle Reconstructiona | nm | 17:40:33 UT | 18:09:49 UT | 30 s | 60 | pixel-1 | 10 ms | |
| VIM | Fe i 630.15 nm | 16:59:25 UT | 17:28:26 UT | 16 s | 105 | pixel-1 | 80 ms | |
| VIM | Fe i 630.15 nm | 17:38:39 UT | 18:08:00 UT | 16 s | 110 | pixel-1 | 80 ms | |
| DVMG | Ca i 610.30 nm | 15:53:10 UT | 22:30:40 UT | s | 220 | pixel-1 | 30 msb | |
| Filtergram | H 656.30 nm | 15:54:01 UT | 22:31:31 UT | s | 248 | pixel-1 | 60 ms | |
| NOTE.—The symbol refers to the wavelength, to the cadence, to the number of observations in each time series, to the image scale, and to the exposure time. The speckle reconstructions and VIM data were taken with the 65-cm vacuum reflector whereas the DVMG and filtergrams were obtained as context data with the 25-cm refractor. | ||||||||
| aThe ten-minute gap between the two high-resolution data sets occurred, since the optical trains had to be re-aligned to compensate the pupil wobble on the AO wavefront sensor. | ||||||||
| bThe effective exposure time of the magnetograms is actually larger ( two seconds), since 64 individual exposures are combined to determine the degree of polarization Stokes . | ||||||||
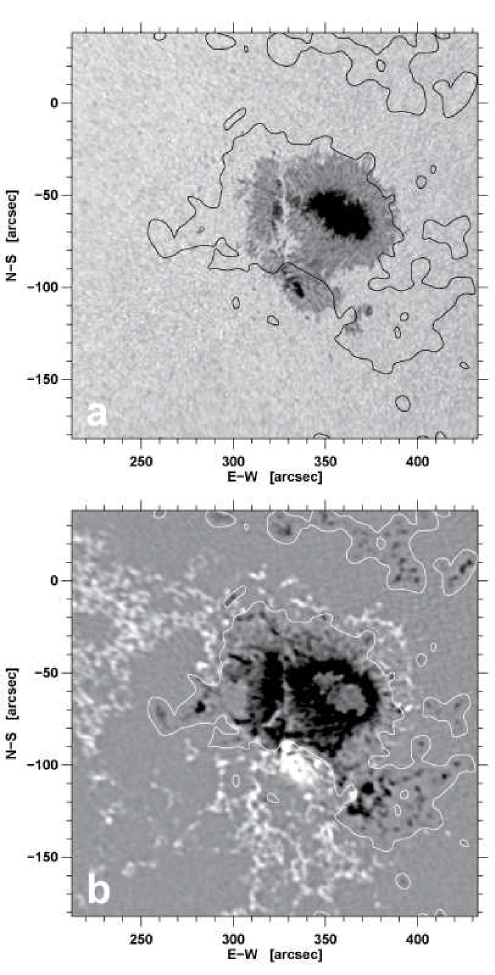
The observations of NOAA 10756 are mainly based on observations with BBSO’s 65-cm vacuum reflector and 25-cm refractor. Table 1 provides an overview of the observing characteristics. Both telescopes have a suite of instruments dedicated to active-region monitoring and space-weather research [Gallagher et al. (2002)]. The observations with the 25-cm telescope provide the context for the high-resolution observations. Two Apogee KX260 CCD cameras with pixel obtain filtergrams in the strong chromospheric absorption lines Ca ii K and H with a one-minute cadence. The image scale is about pixel-1 for both cameras corresponding to a field-of-view (FOV) of about . The third optical bench on the 25-cm telescope is reserved for the Digital Vector Magnetograph (DVMG, \openciteSpirock2001). A quasi-continuum image and a line-of-sight (LOS) magnetogram are shown in Figure 1. We used an intensity image and magnetogram of the Michelson Doppler Imager (MDI, \openciteScherrer1995) to establish the exact image scale and coordinates for the DVMG data. Before aligning MDI and DVMG data the solar position angle has to be taken into account. The image scale of the DVMG is pixel-1 corresponding to a FOV of . The DVMG FOV is after solar -angle correction. The - and -axes in Figure 1 are given in disk center coordinates and can be used as a reference for the high-resolution observations. We usually depict the high-resolution images without rotation correction. The DVMG line-wing image is commonly used as a reference, if we have to co-align the H filtergrams, the speckle reconstructions, and two-dimensional spectroscopic data. Note that the line-wing images are used as a substitute for continuum images.
The high-resolution instrumentation of the 65-cm telescope is located in a coudé laboratory. It consists of the high-order AO system, two imaging spectro-polarimeters for observations in the visible and near infrared wavelength regions (\openciteDenker2003a, 2003), and a fast CCD camera system for image restoration Denker et al. (2005). The seeing characteristics at BBSO were evaluated as part of the site survey for the Advanced Technology Solar Telescope (ATST) and the site-specific results are summarized in \inlineciteVerdoni2007. The high-order AO system (\openciteRimmele2004a; \openciteRimmele2004a) is a collaboration between BBSO and the National Solar Observatory (NSO). The optical set-up and performance of the BBSO system are presented in \inlineciteDenker2007b. One limitation of the AO system should be noted here, since it affects the data collection in this study. A misalignment of the declination and right ascension axes led to a wobble of the pupil image on the wavefront sensor. As a result, the light path of the AO system and the post-focus instrumentation had to be realigned every 30 minutes. This leads to a data gap of about five to ten minutes between the 30-minute observing sequences.
Continuum images at nm of the North-East and South-East parts of the active region were obtained from 17:01 UT to 17:31 UT and 17:40 UT to 18:10 UT, respectively. The time series of speckle restored images has a cadence of 30 seconds, i.e., we restored a total of images. Each restored image is based on 100 short-exposure (ten ms) images, which were selected from 200 frames captured at 15 frames s-1. The FOV was about with an image scale of pixel-1. A target was inserted in a focal plane following the tip-tilt mirror to accurately align the channels for image restoration and two-dimensional spectroscopy. The image restoration procedure has been described in detail in \inlineciteDenker2005b.
In this study, we present for the first time scientific results obtained with a new two-dimensional imaging spectrometer. In 2007, we will add polarization optics to the spectrometer, which will enable us to measure the full Stokes vector. The design of the imaging magnetograph systems at BBSO has been outlined in \inlineciteDenker2003a and \inlineciteDenker2003b. As for now, we use Visible-light Imaging Magnetograph (VIM) just as a spectrometer. The imaging spectrometer was carefully tested, which includes a detailed characterization of the Fabry-Pérot etalon Denker and Tritschler (2005). The two-dimensional spectroscopic observations in the Fe i 630.15 nm line basically follow the continuum observations. However, they have a slightly larger FOV of . The CCD camera was operated in a two two pixel binning mode. Thus, the image scale increased to pixel-1 compared to the continuum observations. The cadence of the spectral line scans was 16 seconds and a total of 214 scans were obtained. The filtergrams were taken at 91 wavelength points in the Fe i line separated by 1.2 pm corresponding to a scanned wavelength interval of 0.11 nm. The exposure time of the filtergrams was 80 ms.
3 Results
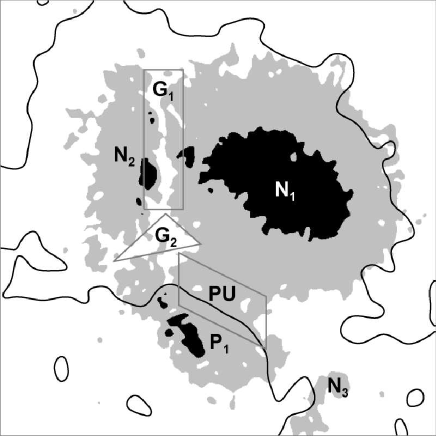
Figures 1 and 2 depicts the leading sunspot in active region NOAA 10756 with predominantly negative polarity (N1 and N2). The labels printed in italics refer to the schematic sketch shown in Figure 2, which should serve as a guide to the many (small-scale) features discussed in the following sections. Only a small configuration with opposite polarity (P1) can be found in the southern part of the region. The trailing positive polarity plage extends further to the East – well beyond the FOV shown in Figure 1. Flux concentrations are limited to small pores or magnetic knots, which are invisible in MDI magnetograms but sometimes recognizable in DVMG magnetograms at higher spatial resolution. The leading part of NOAA 10756 consists of three distinct parts: a dominant elliptical spot of negative polarity (N1), a linear arrangement (oriented along the North-South axis) of small sunspots with a rudimentary penumbra (N2) of the same polarity as the main sunspot, and a small configuration (P1). The North-South aligned spots (N2) are separated by a narrow granular region (G1, vertical box in Figure 2) from the main spot, while the penumbrae (PU, diagonal box in Figure 2) of the and main spot are fused together. The magnetic polarity inversion line surrounding the negative flux of the active region was derived from a low-pass filtered version of the magnetogram. It is superimposed as black and white contours on the Ca ii K line-wing image and magnetogram shown in Figure 1. This neutral line is also depicted in the high-resolution images.
Since the FOV of the high-resolution observations is only , we decided to obtain two different data sets zooming in on several small sunspots to the East (N2) and a small configuration (P1) to the south of the main sunspot (N1). Several small light-bridges branch out from the about -wide channel of granulation (G1), which separate individual umbral cores. All umbral cores contain numerous umbral dots, which consist of peripheral umbral dots with histories related to the migration of penumbral grains and a background of fuzzier umbral dots. This linear array of sunspots formed a well-organized rudimentary penumbra on its eastern side. The spot (P1) is located to the South-East of these small spots (N2), separated by a triangular shaped region of granulation. The main sunspot connects to the remaining side of the triangle. Several tiny pores or magnetic knots permeate this region of granulation (G2, triangular box in Figure 2), which is visible in both panels of Figure 3. The spot consists of a single umbra containing several umbral dots, which are, however, much fainter and less densely packed compared to the aforementioned small sunspots. The umbral core is about . The penumbral filaments, which face away from the main spot, point radially outward, whereas the filaments closest to the main spot are strongly curved and wrapped around the umbral core of the spot. These almost-tangential filaments are the first visual indications of highly twisted magnetic field lines.
Tracing these individual penumbral filaments and penumbral grains in time series of speckle reconstructions reveals a counter-clockwise twist. The penumbral filaments of the main spot in the vicinity of the spot show exactly the same twist leading to strong shear flows at the interface of the two penumbrae. The penumbral segments, where penumbral filaments and grains follow curved trajectories, are much wider than their counterparts with normal radial motions. This might be a direct result of the Evershed flow. The proximity of two penumbrae (PU) with colliding outflows leaves only two possibilities: the subduction of one flow pattern or the horizontal deflection of the opposing flows. Our observations of penumbral filaments, which are tangential to the umbra of the spot well support mainly the latter case. Strong shear flows are thus created, which will be aligned with the polarity inversion line, if the two sunspots are of opposite polarity as in our case. However, the subduction scenario put forward in \inlineciteLites2002 would still apply to the locations where the dark penumbral filaments carrying the Evershed flows terminate, i.e., bend downward and return their respective flows to the solar interior. Strands of penumbral filaments extend for more than while winding around the spot. These strands show indications of a braided structure, which could be interpreted as locally-confined subduction or horizontal twists in the flow channels associated with the Evershed effect. Finally, the whirlpool-like magnetic structure (N3) near the western tip of the spot (P1) can serve as an example that localized shear flows and twist are present in this active region even on scales of about .
In Figure 4, we show dopplergrams obtained with the imaging spectrometer. The Fe i 630.15 nm line is broadened by the Zeeman effect. This limitation should be kept in mind, when interpreting the findings based on VIM data. The LOS velocity is determined by a Fourier-phase method Schmidt, Stix, and Wöhl (1999), which uses the entire line profile and is very insensitive to noise. We follow the convention that redshifts are negative and blueshifts are positive. Thus, dark areas in the dopplergrams shown in Figure 4 move away from the observer, while bright areas indicate motion towards the observer. In the absence of an absolute wavelength calibration, we used quiet Sun areas to establish a velocity calibration taking into account a convective blueshift of 0.195 km s-1 Balthasar (1988) for the Fe i 630.15 nm line at . Since we are mostly interested in the morphology and evolution of the flow fields, a rough interpretation of LOS velocities as up- and downflows can be justified. In the following, we concentrate on the major features of the LOS flows. A summary of the typical flow velocities encountered in and around the active region are presented in Table 2.
| Technique | Region | Quiet Sun | Penumbra | Umbra | Flow Kernel |
|---|---|---|---|---|---|
| LOS | 1 | ||||
| LOS | 2 | ||||
| LCT | 1 | ||||
| LCT | 2 | ||||
| NOTE.—The region indices identify the FOV in (1) the top panels and (2) the bottom panels shown in Figures 3 and 4. LCT and LOS refer to the magnitude of the velocities as measured with local correlation tracking and two-dimensional spectroscopy. All velocities are given in units of km s-1. The standard deviation of the velocities reflects the width of the frequency distribution for the various solar regions and is not to be confused with a measurement error. | |||||
Some of the strongest LOS downflows are concentrated in the small pores and magnetic knots contained in the triangle of granulation (G2) connecting the main spot (N1), the linear group of sunspots (N2), and the spot (P1). Typical downflow velocities in these small-scale flux concentrations range from 0.6 to 1.0 km s-1. The rudimentary penumbra belonging to the linear group of spots (N2) has the same velocity sign as the center-side penumbra of the main spot (N1).
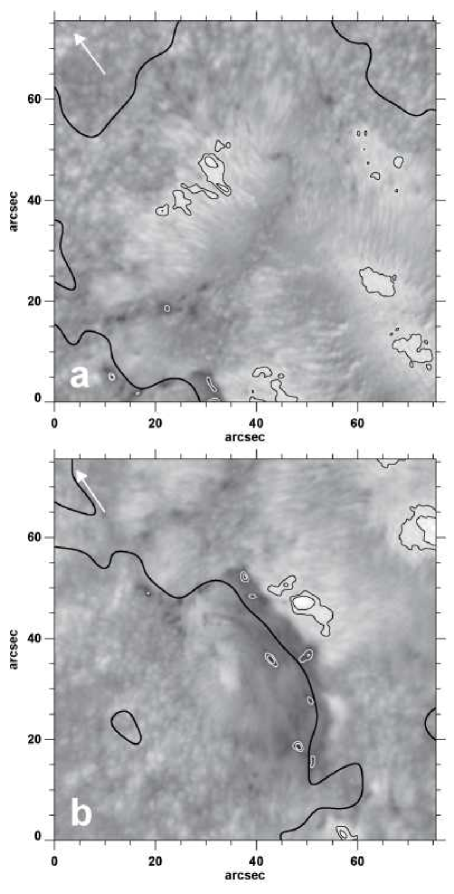
The most conspicuous LOS velocity feature of the spot is its penumbra. The line separating upflows and downflows (contained in the diagonal box PU in Figure 2) basically follows the magnetic polarity inversion line. However, it is displaced by about . A closer inspection of the magnetograms reveals that the positive polarity penumbra of the spot contains several elongated inclusions of of small-scale negative polarity features, i.e., without smoothing several localized magnetic neutral lines would exist. The neutral line shown in Figures 1 to 6 was derived from a smoothed magnetogram, which eliminate many of these small “polarity islands” and thus effectively decreases the majority flux surrounding these locations. As a result, the magnetic neutral line is shifted towards the spot. However, the separation line between up- and downflows coincides well with the strongest magnetic field gradient. These observations support the scenario in which the penumbrae of the spot and the main spot behave primarily as separate entities, i.e., the Evershed flow is deflected. However, intrusions of opposite polarity flux might occur near this interface, which appear as the aforementioned braided structure of penumbral filaments. Localized subduction as suggested by \inlineciteLites2002 might play a role in these cases. Only high-resolution two-dimensional spectro-polarimetry with sub-arcsecond resolution can answer this question.
Since the penumbral filaments on the western side are almost tangential, they behave essentially as if they belong to the limb-side penumbra. Strong flow kernels are embedded in both colliding penumbrae. The size of these elongated flow kernels is about and they are aligned with the local penumbral filaments. Flows in these kernels are typically larger than 0.8 km s-1 and reach almost 1.8 km s-1. No dark features in the speckle restored continuum images (see Figure 3) are associated with these flow kernels. Analyzing the time series of dopplergrams, we find that the flow kernels are slowly evolving, long-lived features (at least 30 minutes) that do not partake in the penumbral proper motions seen in time series of speckle restored continuum images. Since no magnetograms with a spatial resolution comparable to that of the two-dimensional spectroscopic data or the speckle restored images was available, the questions remains open, if the flow kernels are associated with intrusion of opposite polarity flux into the the penumbral shear flow areas.
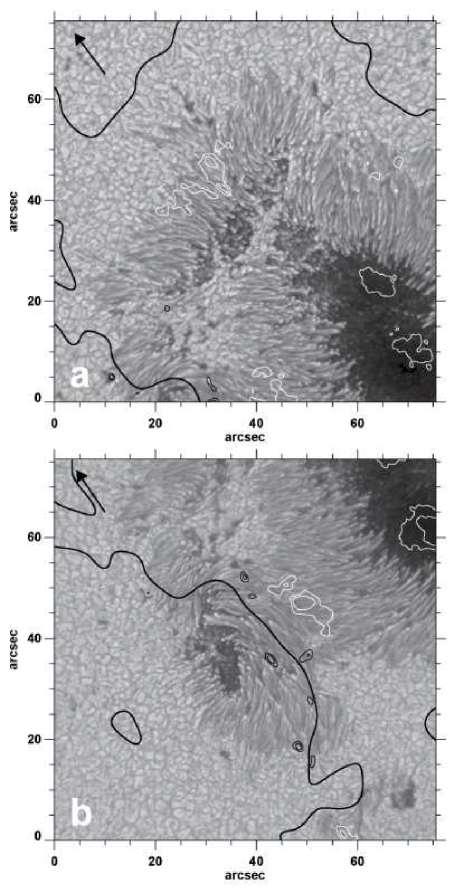
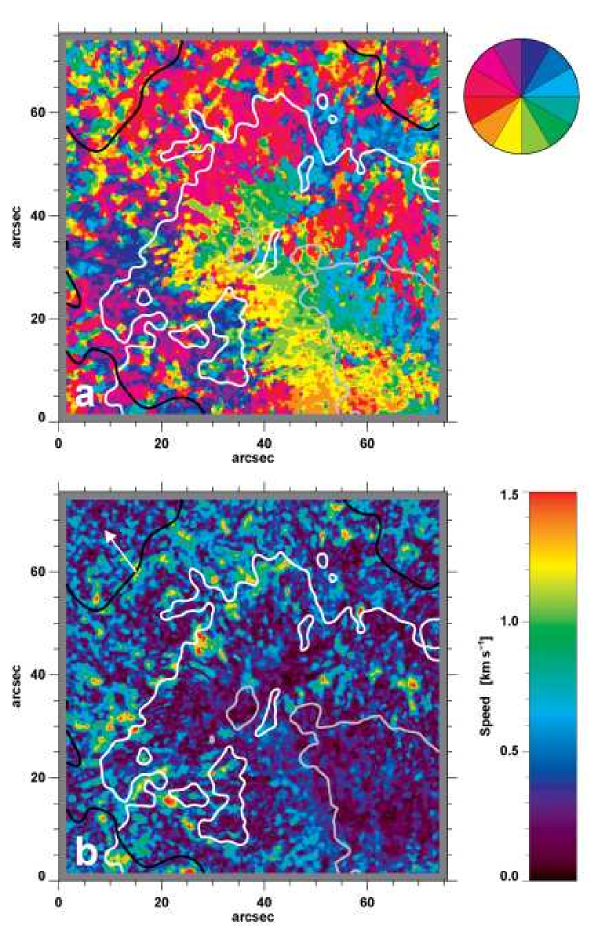
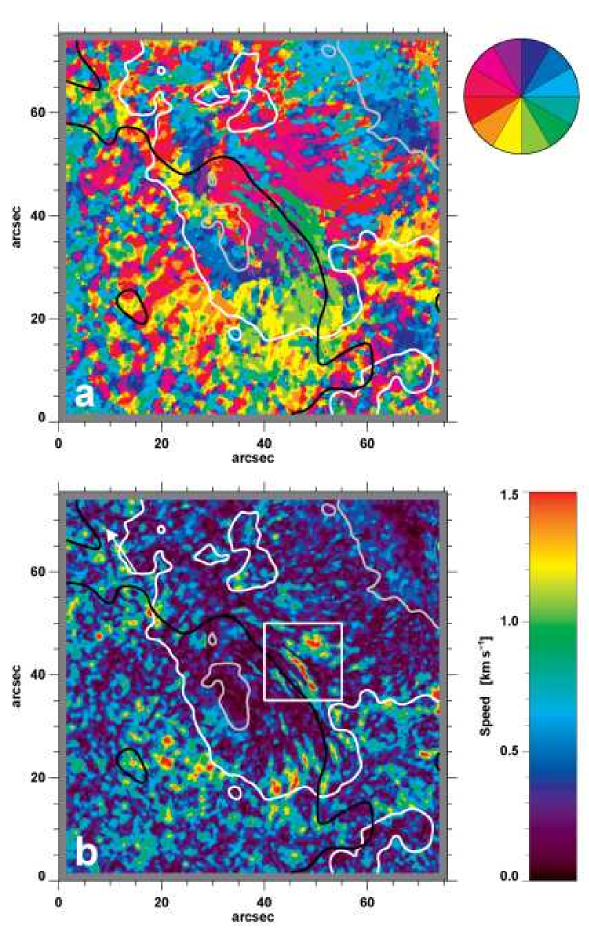
In Figures 5 and 6, we show high-resolution flow maps based on time series of speckle reconstructed images. The two figures depict the detailed proper motions in the northern and southern parts of active region NOAA 10756, respectively. Averaging 60 individual flow maps over a period of about 30 minutes only leaves persistent flow patterns. The smallest reliable features in the flow maps have a size of about . For this reason, we opted to use a color representation to indicate flow direction and magnitude rather than relying on drawing vector maps with inferior resolution. A 12-sector RGB color wheel has been added as a visualization guide in the upper-right corners of the azimuth maps. In addition, contour lines of the granulation/penumbra boundary (white) and the penumbra/umbra (gray) were superimposed on the flow maps to ease the interpretation of the highly detailed maps. The areas with granulation are characterized by small-scale patches (having the size of individual granular cells) with large variations of the azimuth angle. In addition, in regions with small-scale magnetic fields, i.e., brightenings in the line core intensity maps, we find some of the largest proper motions. Typical horizontal velocities related to Fe i line gaps frequently reach 1.25 km s-1, whereas velocities in areas of normal granulation are typically around 0.75 km s-1. A comparison of the typical LCT and LOS velocity values is given in Table 2 for different regions and features in the active region.
The proper motions in penumbral regions retain the elongated character of the penumbral filaments. The largest velocities are generally found near the granulation/penumbra boundary, i.e. they are encountered in the vicinity of the white contour lines in Figure 5b. Conversely, the lowest velocities are found in the umbral regions of the sunspots. However, this might be related to the low signal-to-noise ratio in these dark regions, where only the faint umbral dots contribute to the correlation signal measured with the LCT technique. The high LOS velocities, which were associated with the small pores and magnetic knots in the previously mentioned triangular granular region (G2), have no counterparts in the LCT maps. The most prominent feature in the horizontal flow maps is located in the center of Figure 6b as indicated by a white box. Two flow kernels, one elongated and the other with circular shape, are clearly visible. The diameter of the circular kernel is about and the other kernel is about wide and stretches out to about . The velocity in these flow kernels approaches 2.5 km s-1. In addition, they are co-aligned with flow kernels in the LOS velocity maps. The two flow kernels are within of each other and separated by a line tracing the strongest magnetic field gradient, which parallels the magnetic polarity inversion line about to the North-West. Compared to previous observations of active region NOAA 10486 (see \openciteYang2004, especially Figures 2b and 2c), the flow interface is harder to trace in the azimuth and magnitude maps, since it does not exactly follow the magnetic polarity inversion line. However, the proximity of green and purple colors to the North-East of the magnetic neutral lines indicates flows in opposite direction. Thus, strong shear flows are present in NOAA 10756 as well.
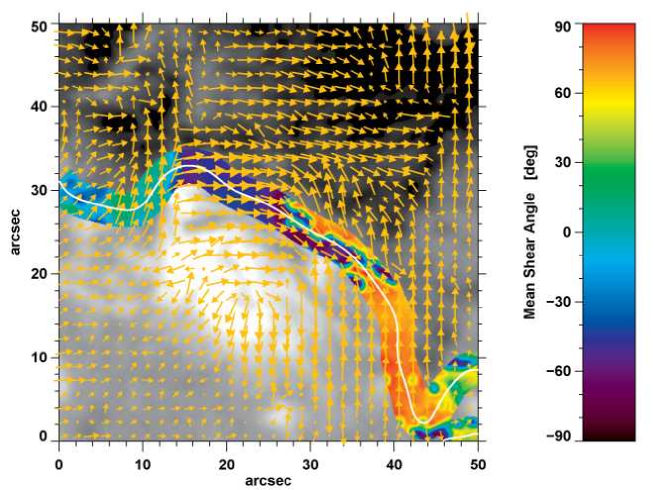
We define magnetic shear according to \inlineciteWang1994 as the angular difference between the measured and calculated potential transverse field. In Figure 7, we show in the background a longitudinal magnetogram of the small configuration taken at about the same time as the data shown in Figure 1. The FOV of the vector magnetogram is . The orange arrows indicate magnitude and direction of the measured transverse field component. The ambiguity was resolved by applying the acute angle method, which requires that the transverse components of the observed and modeled (in this case potential) fields make an cute angle. Recent studies in the framework of the SDO/HMI–CSAC Azimuth Ambiguity Resolution Workshop Metcalf et al. (2006) showed that this method can correctly resolve ambiguity for about 90% of strong transverse magnetic fields. The magnetic shear angle has been computed for a neighborhood along both sides of the magnetic neutral line (shown as a thick white line). The magnetic shear angle in the interval is mapped to a rainbow color-scale shown at the right side of Figure 7. Two areas with distinct magnetic shear angles exist along the magnetic neutral line. One area corresponds to the diagonal box PU in Figure 2, where the photospheric shear flows are observed. The mean magnetic shear angle is negative (blue) in this region. In contrast, the magnetic shear angle along the magnetic neutral line immediately to the south of is positive (red).
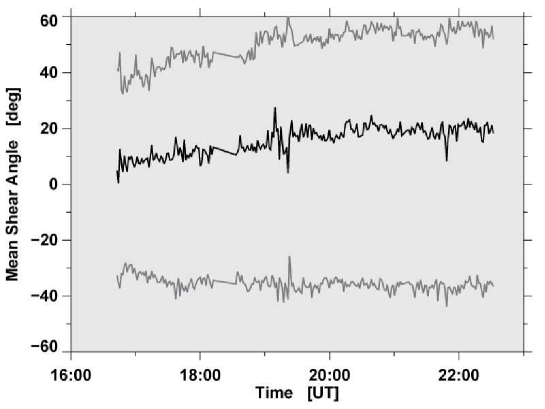
Since we have 243 vector magnetograms during the time period from 16:43 UT to 22:32 UT, we can study the temporal evolution of the magnetic shear and relate it to the observed photospheric shear flows. For this purpose, we defined a neighborhood of along both sides of the magnetic neutral line as indicated in Figure 7 but now for all vector magnetograms. The average magnetic shear is computed for the entire neighborhood area of the neutral line visible in the FOV of Figure 7. Its temporal evolution is presented by the black curve in Figure 8. The magnetic shear increased from about at 17:00 UT to about at 22:30 UT. However, this increase occurs predominantly in the southern part of the neutral line with positive magnetoc shear angle, whereas in proximity to the region with photospheric shear flows, the magnetic shear angle remains fairly constant at about . Shear angle values around are also commonly encountered in non- areas of sunspots. In spots with major flares, the magnetic shear angle is often close to (e.g., \openciteHagyard1984).
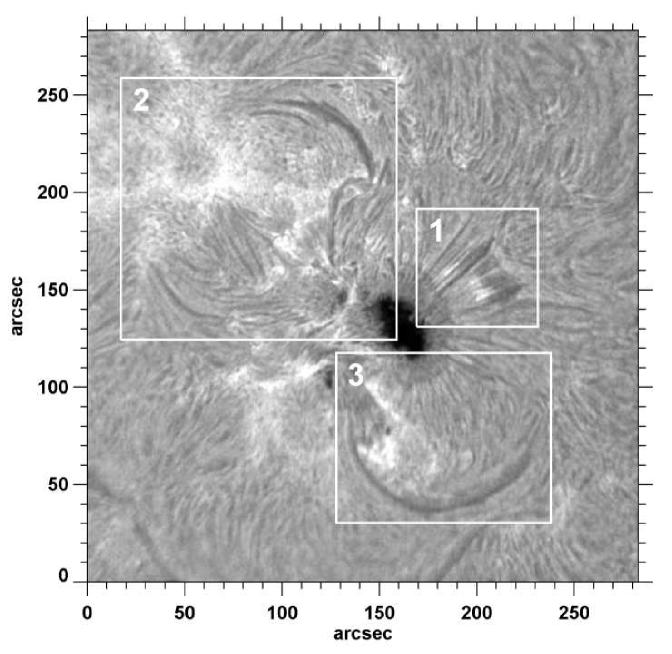
In addition to the photospheric observations, we obtained chromospheric data, which provides some clues to the overall magnetic field topology. Three distinct loop system indicated by white boxes in Figure 9 can be identified in the H filtergrams: i) small loops connecting the main spot with opposite polarity flux in the sunspot moat in the north-western part of the active region, ii) large-scale loops associated with the linear group of small sunspots (N2) in the North-East, which terminate in a region of extended plage, and iii) a large loop between the spot (P1) and the umbra of the main sunspot (N1). All loop systems have in common that they point away from the center of the main spot and leave the central region of the sunspot group devoid of any H loops. In particular, no active-region filament formed along the polarity-inversion line. In time series of H filtergrams, we find some indications of activity related to the loop systems, which is most prominent in the flux system towards the North-East (Box 1 in Figure 9). Here, we find frequent brightenings of the H plage, which originates at the footpoint of a small filament routed in the linear sunspot group. The spot filament (Box 3) is fairly inactive with the exception of one short-term brightening around 18:07 UT, which traveled at high speeds from the umbra of the main spot to approximately the apex of the H loop. Even though the connection of the spot filament to the main sunspot might not be clear in Figure 9, the trajectory of this brightening undoubtedly confirms this connection. This feature is very similar to transient flow fields in filaments, which were observed by \inlineciteChae2000 in high-resolution times-series of H filtergrams. In addition to these transient flows, we find indications of twisted flows near the loop top. These twisted flows are especially prominent during times when the absorption is increasing at the apex of the loop.
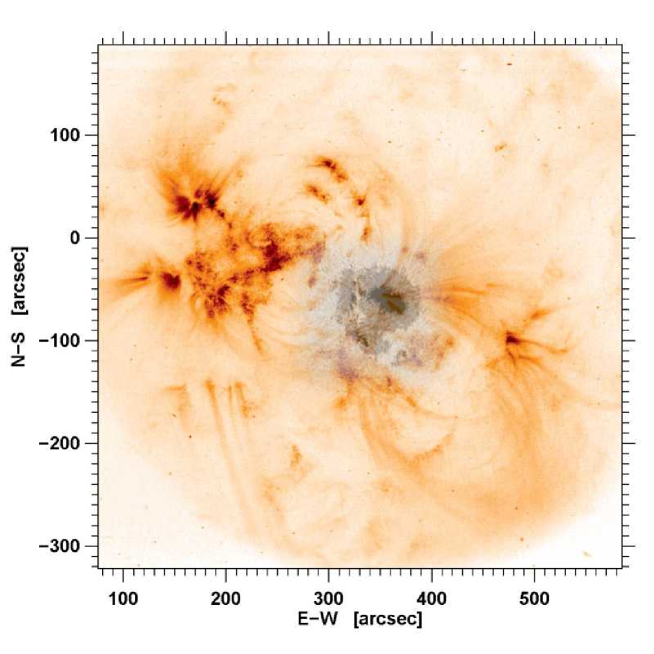
We used data of the Transition Region and Coronal Explorer (TRACE, \openciteHandy1999) to compare the chromospheric with the coronal loop structure above NOAA 10756. Figure 10 is a superposition of a Ca i 610.3 nm line-wing filtergram and a negative TRACE 171 Å image, which maps coronal loop structures with temperatures of about K. Note that TRACE observations of NOAA 10756 were not available during the BBSO observations. Therefore, we selected the first available image on the following day. In general, the chromospheric and the coronal loop topology is very similar. Again, the absence of loop structures (Box 1 in Figure 9) above the sunspots is worth noticing. As expected, the low-lying loop system related to the sunspot moat is invisible in the TRACE 171 Å image. However, the other two loop systems are clearly visible. The loop system in the North-East, which is associated with the extensive plage region, is routed in the linear group of sunspots (N2) and the main sunspot (N1). On the other side of NOAA 10756, the loop system related to the configuration (P1) is much more pronounced compared to the chromospheric observation. Several individual loops are contained in this loop system.
4 Discussion
The most striking features in LCT and LOS velocity maps are localized areas of strong flows. They fall into two categories: either they are associated with small sunspots and pores embedded in a triangular region of granulation (G2), which is enclosed in the sunspot group, or they are located on opposite sides of the magnetic polarity inversion line in regions of strong shear flows (diagonal box PU in Figure 2). In the first case, the observed downflows are typical for small sunspot and pores. Typically, the velocity field of pores is close to zero near their center with strong downflows in their periphery (e.g., \openciteLeka1998; \openciteSankarasubramanian2003).
The case of the flow kernels near the magnetic neutral line is different. These kernels are not associated with dark features but with the sheared penumbral velocity field. \inlineciteMartinezPillet1994 reported strong, isolated downflows near the neutral line of a spot, which were as large as 14 km s-1. The downward motions were accompanied by upward flows of about 1.5 km s-1 in a nearby region. These velocities were measured with the Advanced Stokes Polarimeter (ASP) at NSO/Sacramento Peak by determining the zero-crossing of Stokes profiles. This velocity signal might not be as easily visible in the Doppler shift of the Stokes signal. Since our spectral resolution is inferior to the spectrograph-type ASP instrument and we have to rely on Stokes line profiles, the velocity signal of the flow kernels in our study is not expected to be as high. The strongest upflow was encountered in the disk-side penumbra of the main sunspot, which is accompanied by kernel with smaller downflows on the other side of the polarity inversion line. Despite the discrepancy in the velocity signal both observations of flow kernels show a variety of commonalities. The flow kernels appear as pairs of opposite flows on both sides of the strongest magnetic field gradient between the penumbrae of the spot and main spot. They are long-lived features (30 minutes to 3 hours). Typical sizes are in the range from to . According to \inlineciteMartinezPillet1994, non-linear phenomena in the transition region and chromosphere are responsible for the observed high speeds. The strongly-curved penumbral filament in the limb-side penumbra of the spot, which are almost tangential to the umbra, indicate the presence of strong magnetic twist. \inlineciteLeka2005 showed that the onset of kink instability requires sufficient magnetic twist (flux tubes with more than winds) in the solar active region. At this moment, it is not clear if two-dimensional spectro-polarimetry can provide enough information to quantify the amount of twist. However, it can identify emerging helicity-carrying flux tubes and help to identify areas, which are susceptible to kink-instability. These quantities are valuable for any operational space weather monitoring and predicting system.
spots have been identified as the most flare-productive active regions Zirin and Liggett (1987). Why does then the configuration in NOAA 19756 produce so little activity? For one, the configuration is not a very close one, i.e., it is not an “island configuration”. Indeed, one could argue that the spot is not located in the penumbra of the main spot but possesses its own penumbra, which is just in very close proximity to the main spot’s penumbra. The penumbrae seem to merge in low-resolution observations. However, the high-resolution observations clearly reveal the distinct identity of both the and main spot. This observation is confirmed by the LOS and horizontal flow patterns associated with the two penumbrae. \inlineciteSammis2000 have provided a comprehensive study of the relationship between flares and spots. regions are the most prolific flaring regions producing many more large flares compared to other regions of similar size. spots, such as NOAA 10756, are ranked (see Figure 2 in \openciteSammis2000) just below spots on a par with spots. We would expect predominantly M-class flares with some C-class and occasional X-class flare from a region. Considering the size of NOAA 10756 (about 1000 millionths of a solar hemisphere), the likelihood for producing M-class flares was given.
In the region of colliding penumbrae (diagonal box PU in Figure 2), we observe a negative (left-handed) magnetic shear along the neutral line (Figure 7). The observed photospheric shear flow, which is carried by the more horizontal Evershed flow channels, would tend to decrease the magnetic shear, thus leading to a more potential configuration of the local magnetic field. The temporal evolution of the magnetic shear in region PU shows a fairly constant negative shear angle of about , whereas in other regions of the neutral line the magnetic shear increases (see Figure 8). The gradual build-up of magnetic shear in these regions can be attributed to motions of the small configuration and main sunspot on larger scales. The lack of major flare activity could, therefore, also have its explanation in the fact that locally, the photospheric shear flows might inhibit an increase of magnetic shear. At least it remained constant at a level, which is common for non- regions in sunspots Hagyard et al. (1984). This situation is very different from the instantaneous magnetic shear evolution observed during major flares Wang et al. (1994) and differs from recent observations of photospheric shear flows in flaring active region NOAA 10486 (\openciteYang2004; \openciteDeng2006).
Based on our observations, we conclude that the polarity inversion line was too short and sufficient shear was not available to create a channel enabling the formation of an active region filament. The chromospheric and coronal loops are pointing in two opposite directions leaving the volume above the sunspot group almost void of any loops. Therefore, the magnetic field topology is much different from the “spine” fields and their associated “fan” surface surrounding a parasitic polarity, which have been observed in many flares with filament eruptions and accompanying CMEs, e.g., \inlineciteAulanier2000, who studied the “Bastille Day” flare on 1998 July 14.
5 Conclusions
We have presented the first science observations with newly developed visible-light post-focus instruments at BBSO. The combination of a high-order AO system with an imaging spectrometer and a fast CCD camera system for speckle observations enabled us to measure the three-dimensional flow fields in and around solar active region NOAA 10756.
We found well-defined flow kernels embedded in a configuration, where both the horizontal and LOS velocities reached up to 1.8 km s-1 and 2.5 km s-1, respectively. These flow kernels, which are one signature of the atypical flow structure in spots, were previously associated with flares (e.g., \openciteYang2004; \openciteDeng2006). However, since these flow kernels are present in this relatively quiet active region, we conclude that they are common features in magnetically complex active regions. The observed photospheric flows are related to the magnetic fields of the more horizontal Evershed flow channels. A connection to the more vertical fields of the uncombed penumbra still needs to be established, since these are the fields straddling the magnetic neutral line. However, this task requires future observations with diffraction-limited spectro-polarimetry with good spectral resolution. However, the well-established flow interface between the opposite polarity penumbrae in NOAA 10756 did not have a counterpart in the respective magnetic flux systems. Here, the situation is more complex. Small-scale intrusions of opposite polarity flux into the spot penumbra might locally increase the flow speed, while on the other side, locally contribute to the dissipation of magnetic flux. We find that the magnetic shear remains fairly constant in the regions with the photospheric shear flows and that the direction of the flow might locally decrease magnetic shear. This scenario hints at an intricate interaction between the global flow field established by two deflected penumbrae and localized phenomena in penumbrae such as flow kernels and inclusions of opposite polarity features. In any case, the peculiar flows in the vicinity of spots are indicators for rapid field evolution, flux emergence, and the presence of twisted fields.
Comparing our high-resolution observations with active region NOAA 10486 (\openciteXu2004b; \openciteDeng2006), we find that the polarity inversion line separating the spot from the main spot is much shorter. Only a single location of strong shear flows was identified. Two intrusions of negative polarity flux into areas with opposite-polarity plage limit the region along the polarity inversion line where shear could be built-up. Thus, the short magnetic neutral line is not conducive to the formation of an active region filament. In addition, the overlying coronal and chromospheric field topology as deduced from TRACE 171 Å and BBSO H filtergrams is much different from the non-potential field above a filament channel, i.e. two loop systems are deflected in opposite direction pointing away from the central part of NOAA 10756. Therefore, magnetic reconnection above the polarity inversion line is highly unlikely.
In summary, observations with high temporal, spatial, and spectral resolution as well as with sufficient magnetic sensitivity are vital in advancing our understanding of solar eruptive phenomena and how they affect Earth and the near-Earth environment.
\acknowledgementsname
We would like to thank Wolfgang Schmidt and an anonymous referee, whose careful reading of the manuscript led to substantial improvements. This work was supported by NSF under grant ATM 00-86999, ATM 02-36945, IIS ITR 03-24816 and AST MRI 00-79482 and by NASA under grant NAG 5-12782. The National Solar Observatory is operated by the Association of Universities for Research in Astronomy under a cooperative agreement with the National Science Foundation, for the benefit of the astronomical community. The data analysis including the graphics was performed in the Interactive Data Language (IDL) by ITT Visual Information Solutions.
References
- Amari et al. (2000) Amari, T., Luciani, J.F., Mikic, Z., Linker, J.: 2000, A Twisted Flux Rope Model for Coronal Mass Ejections and Two-Ribbon Flares. Astrophys. J. Lett. 529, L49 – L52.
- Antiochos, DeVore, and Klimchuk (1999) Antiochos, S.K., DeVore, C.R., Klimchuk, J.A.: 1999, A Model for Solar Coronal Mass Ejections. Astrophys. J. 510, 485 – 493.
- Aulanier et al. (2000) Aulanier, G., DeLuca, E.E., Antiochos, S.K., McMullen, R.A., Golub, L.: 2000, The Topology and Evolution of the Bastille Day Flare. Astrophys. J. 540, 1126 – 1142.
- Balthasar (1988) Balthasar, H.: 1988, The Center-to-Limb Variation of Solar Spectral Lines. Astron. Astrophys. Suppl. Ser. 72, 473 – 495.
- Chae et al. (2000) Chae, J., Denker, C., Spirock, T.J., Wang, H., Goode, P.R.: 2000, High-Resolution H Observations of Proper Motion in NOAA 8668: Evidence for Filament Mass Injection by Chromospheric Reconnection. Solar Phys. 195, 333 – 346.
- Deng et al. (2005) Deng, N., Liu, C., Yang, G., Wang, H., Denker, C.: 2005, Rapid Penumbral Decay Associated with an X2.3 Flare in NOAA Active Region 9026. Astrophys. J. 623, 1195 – 1201.
- Deng et al. (2006) Deng, N., Xu, Y., Yang, G., Cao, W., Liu, C., Rimmele, T.R., Wang, H., Denker, C.: 2006, Multiwavelength Study of Flow Fields in Flaring Super Active Region NOAA 10486. Astrophys. J. 644, 1278 – 1291.
- Denker et al. (2003) Denker, C., Didkovsky, L., Ma, J., Shumko, S., Varsik, J., Wang, J., Wang, H., Goode, P.R.: 2003, Imaging Magnetographs for High-Resolution Solar Observations in the Visible and Near-Infrared Wavelength Region. Astron. Nachr. 324, 332 – 333.
- Denker et al. (2003) Denker, C., Ma, J., Wang, J., Didkovsky, L.V., Varsik, J.R., Wang, H., Goode, P.R.: 2003, IRIM: An Imaging Magnetograph for High-Resolution Solar Observations in the Near-Infrared. In: Keil, S.L., Avakyan, S.V. (eds.) Innovative Telescopes and Instrumentation for Solar Astrophysics, Proc. SPIE, 4853, 223 – 234.
- Denker et al. (2005) Denker, C., Mascarinas, D., Xu, Y., Cao, W., Yang, G., Wang, H., Goode, P.R., Rimmele, T.: 2005, High-Spatial Resolution Imaging Combining High-Order Adaptive Optics, Frame Selection, and Speckle Masking Reconstruction. Solar Phys. 227, 217 – 230.
- Denker and Tritschler (2005) Denker, C., Tritschler, A.: 2005, Measuring and Maintaining the Plate Parallelism of Fabry-Pérot Etalons. Publ. Astron. Soc. Pac. 117, 1435 – 1444.
- Denker et al. (2007) Denker, C., Tritschler, A., Rimmele, T.R., Richards, K., Hegwer, S.L., Wöger, F.: 2007, Adaptive Optics at the Big Bear Solar Observatory: Instrument Description and First Observations. Publ. Astron. Soc. Pac. 119, 170 – 182.
- Fisher et al. (2000) Fisher, G.H., Fan, Y., Longcope, D.W., Linton, M.G., Pevtsov, A.A.: 2000, The Solar Dynamo and Emerging Flux. Solar Phys. 192, 119 – 139.
- Gallagher et al. (2002) Gallagher, P.T., Denker, C., Yurchyshyn, V., Spirock, T., Qiu, J., Wang, H., Goode, P.R.: 2002, Solar Activity Monitoring and Forecasting Capabilities at Big Bear Solar Observatory. Ann. Geophys. 20, 1105 – 1115.
- Hagyard et al. (1984) Hagyard, M.J., Teuber, D., West, E.A., Smith, J.B.: 1984, A Quantitative Study Relating Observed Shear in Photospheric Magnetic Fields to Repeated Flaring. Solar Phys. 91, 115 – 126.
- Handy et al. (1999) Handy, B.N., Acton, L.W., Kankelborg, C.C., Wolfson, C.J., Akin, D.J., Bruner, M.E., Caravalho, R., Catura, R.C., Chevalier, R., Duncan, D.W., Edwards, C.G., Feinstein, C.N., Freeland, S.L., Friedlaender, F.M., Hoffmann, C.H., Hurlburt, N.E., Jurcevich, B.K., Katz, N.L., Kelly, G.A., Lemen, J.R., Levay, M., Lindgren, R.W., Mathur, D.P., Meyer, S.B., Morrison, S.J., Morrison, M.D., Nightingale, R.W., Pope, T.P., Rehse, R.A., Schrijver, C.J., Shine, R.A., Shing, L., Strong, K.T., Tarbell, T.D., Title, A.M., Torgerson, D.D., Golub, L., Bookbinder, J.A., Caldwell, D., Cheimets, P.N., Davis, W.N., Deluca, E.E., McMullen, R.A., Warren, H.P., Amato, D., Fisher, R., Maldonado, H., Parkinson, C.: 1999, The Transition Region and Coronal Explorer. Solar Phys. 187, 229 – 260.
- Leka, Fan, and Barnes (2005) Leka, K.D., Fan, Y., Barnes, G.: 2005, On the Availability of Sufficient Twist in Solar Active Regions to Trigger the Kink Instability. Astrophys. J. 626, 1091 – 1095.
- Leka and Skumanich (1998) Leka, K.D., Skumanich, A.: 1998, The Evolution of Pores and the Development of Penumbrae. Astrophys. J. 507, 454 – 469.
- Lites et al. (2002) Lites, B.W., Socas-Navarro, H., Skumanich, A., Shimizu, T.: 2002, Converging Flows in the Penumbra of a Sunspot. Astrophys. J. 575, 1131 – 1143.
- Liu et al. (2005) Liu, C., Deng, N., Liu, Y., Falconer, D., Goode, P.R., Denker, C., Wang, H.: 2005, Rapid Change of Spot Structure Associated with Seven Major Flares. Astrophys. J. 622, 722 – 736.
- Martínez Pillet et al. (1994) Martínez Pillet, V., Lites, B.W., Skumanich, A., Degenhardt, D.: 1994, Evidence for Supersonic Downflows in the Photosphere of a Sunspot. Astrophys. J. Lett. 425, L113 – L115.
- Metcalf et al. (2006) Metcalf, T.R., Leka, K.D., Barnes, G., Lites, B.W., Georgoulis, M.K., Pevtsov, A.A., Balasubramaniam, K.S., Gary, G.A., Jing, J., Li, J., Liu, Y., Wang, H.N., Abramenko, V., Yurchyshyn, V., Moon, Y.J.: 2006, An Overview of Existing Algorithms for Resolving the Ambiguity in Vector Magnetic Fields: Quantitative Tests with Synthetic Data. Solar Phys. 237, 267 – 296.
- Moore et al. (2001) Moore, R.L., Sterling, A.C., Hudson, H.S., Lemen, J.R.: 2001, Onset of the Magnetic Explosion in Solar Flares and Coronal Mass Ejections. Astrophys. J. 552, 833 – 848.
- November and Simon (1988) November, L.J., Simon, G.W.: 1988, Precise Proper-Motion Measurement of Solar Granulation. Astrophys. J. 333, 427 – 442.
- Rimmele (2004) Rimmele, T.R.: 2004, Recent Advances in Solar Adaptive Optics. In: Bonaccini Calia, D., Ellerbroek, B.L., Ragazzoni, R. (eds.) Advancements in Adaptive Optics, Proc. SPIE, 5490, 34 – 46.
- Sammis, Tang, and Zirin (2000) Sammis, I., Tang, F., Zirin, H.: 2000, The Dependence of Large Flare Occurrence on the Magnetic Structure of Sunspots. Astrophys. J. 540, 583 – 587.
- Sankarasubramanian and Rimmele (2003) Sankarasubramanian, K., Rimmele, T.: 2003, Properties of Magnetic and Velocity Fields in and around Solar Pores. Astrophys. J. 598, 689 – 699.
- Scherrer et al. (1995) Scherrer, P.H., Bogart, R.S., Bush, R.I., Hoeksema, J.T., Kosovichev, A.G., Schou, J., Rosenberg, W., Springer, L., Tarbell, T.D., Title, A., Wolfson, C.J., Zayer, I., MDI Engineering Team, : 1995, The Solar Oscillations Investigation – Michelson Doppler Imager. Solar Phys. 162, 129 – 188.
- Schmidt, Stix, and Wöhl (1999) Schmidt, W., Stix, M., Wöhl, H.: 1999, Center-to-Limb Variation of the Solar Oscillation. New Results from MDI Data. Astron. Astrophys. 346, 633 – 640.
- Spirock et al. (2001) Spirock, T., Denker, C., Chen, H., Chae, J., Qiu, J., Varsik, J., Wang, H., Goode, P.R., Marquette, W.: 2001, The Big Bear Solar Observatory’s Digital Vector Magnetograph. In: Sigwarth, M. (ed.) Advanced Solar Polarimetry – Theory, Observation, and Instrumentation, Astron. Soc. Pac. Conf. Ser., 236, 65 – 72.
- Sudol and Harvey (2005) Sudol, J.J., Harvey, J.W.: 2005, Longitudinal Magnetic Field Changes Accompanying Solar Flares. Astrophys. J. 635, 647 – 658.
- Verdoni and Denker (2007) Verdoni, A.P., Denker, C.: 2007, The Local Seeing Environment at Big Bear Solar Observatory. Publ. Astron. Soc. Pac. 119, 793 – 804.
- Wang et al. (1994) Wang, H., Ewell, M.W.Jr., Zirin, H., Ai, G.: 1994, Vector Magnetic Field Changes Associated with X-Class Flares. Astrophys. J. 424, 436 – 443.
- Wang et al. (2004) Wang, H., Liu, C., Qiu, J., Deng, N., Goode, P.R., Denker, C.: 2004, Rapid Penumbral Decay following Three X-Class Solar Flares. Astrophys. J. Lett. 601, 195 – 198.
- Xu et al. (2004) Xu, Y., Cao, W., Liu, C., Yang, G., Qiu, J., Jing, J., Denker, C., Wang, H.: 2004, Near-Infrared Observations at 1.56 Microns of the 2003 October 29 X10 White-Light Flare. Astrophys. J. Lett. 607, 131 – 134.
- Yang et al. (2004) Yang, G., Xu, Y., Cao, W., Wang, H., Denker, C., Rimmele, T.R.: 2004, Photospheric Shear Flows Along the Magnetic Neutral Line of Active Region 10486 Prior to an X10 Flare. Astrophys. J. Lett. 617, 151 – 154.
- Zirin and Liggett (1987) Zirin, H., Liggett, M.A.: 1987, Delta Spots and Great Flares. Solar Phys. 113, 267 – 281.
- Zirin and Tanaka (1973) Zirin, H., Tanaka, K.: 1973, The Flares of August 1972. Solar Phys. 32, 173 – 207.