Magnetometry Based on Nonlinear Magneto-Optical Rotation with Amplitude-Modulated Light
Abstract
We report on an all-optical magnetometric technique based on nonlinear magneto-optical rotation with amplitude-modulated light. The method enables sensitive magnetic-field measurements in a broad dynamic range. We demonstrate the sensitivity of G/ at 10 mG and the magnetic field tracking in a range of 40 mG. The fundamental limits of the method sensitivity and factors determining current performance of the magnetometer are discussed.
pacs:
07.55.Ge,32.80.Xx,42.50.GyI Introduction
Optical magnetometers explore optical signals which exhibit suitable dependence on magnetic field. One category of optical magnetometers applies high-resolution laser and/or radio-frequency (rf) spectroscopy for generation of narrow resonances whose positions in frequency vary with the magnetic field. Sensitivity of these devices depends mainly on the width of a given resonance, whereas the measurement range depends on the ability to determine the resonance position. Second category of optical magnetometers exploits magneto-optical phenomena, mainly the Faraday Faraday1846 , Macaluso-Corbino Macaluso1898 , and Hanle Hanle1924 effects. These phenomena are characterized by changes of the scattered-light intensity or polarization occurring around zero-magnetic field. The resonances may have dispersive shapes which allows to determine weak magnetic fields () within the range comparable to the resonance widths. However, a common constraint of the devices from both categories is that the resonance width affects not only the sensitivity but also the range of measurable magnetic fields; the smaller the width, the better sensitivity but narrower range.
Significant progress in the development of optical magnetometers exploiting the magneto-optical rotation has been reached by the advent of tunable lasers that allowed to take full advantage of resonant enhancement of the Faraday rotation (see, for example, Ref. Gawlik1974CW ). Another important consequence of application of lasers was the ability to explore the nonlinear magneto-optical rotation (NMOR), particularly the nonlinear Faraday effect associated with Zeeman coherences Gawlik1974CW ; ReviewNMOR . The nonlinear Faraday effect produced much narrower rotation resonances at , which allowed reaching sensitivity far greater than that achieved with magnetometers employing the linear Faraday effect. However, the increase of the sensitivity was associated with a considerable reduction of the measurement range to very weak magnetic fields only. A significant step in alleviating this drawback was the application of synchronous pumping of atoms. This idea goes back to the works of Bell and Bloom Bell1961 and Corney and Series Corney1964 and the possibility of its application in context of magnetometry leading to an extension of the dynamic range was suggested before the “laser era” Tannoudji1970 . Yet, it was only in Ref. Budker2002FMNMOR that this possibility was experimentally verified. By the use of frequency modulation (FM) of light Budker2002FMNMOR , the rotation signal acquired multiple extra resonances, the two most prominent occurring at , where is the modulation frequency, the Landé factor, and the Bohr magneton. The new, so-called, high-field resonances are as narrow as the zero-field one but their positions as a function of the magnetic field depend on the modulation frequency, hence they can be used for ultra-precise measurements of stronger fields. In a recent work Acosta2006High the dynamic range was extended up to the geophysical range with only a modest loss of sensitivity caused by nonlinear Zeeman and ac Stark effects.
Although FM is a simple and convenient way of synchronous pumping, necessary for observation of the new rotation resonances in non-zero fields, it has its drawbacks, such as the ac Stark effect and off-resonance pumping of atoms. On the other hand, the amplitude modulation (AM) not only enables elimination of most of these limitations but, additionally, offers a possibility to apply specific modulation patterns. In particular, the pulsed excitation and probing, either with a standard one-beam arrangement Gawlik2006AMOR , or with two separated beams (pump-probe configuration) Higbie2006AllOptical , appears to be a very powerful magneto-optics tool for studies of the dynamic aspects of magneto-optical phenomena. Low duty cycles allow observation not only of the resonances at but also at multiplicities of these values. The AMOR (Amplitude Modulated magneto-Optical Rotation) technique and its suitability for creation of additional resonances extending the dynamic range of magnetometric measurements have been first described in Ref. Gawlik2006AMOR . In Ref. Balabas2006Milllicells the AMOR technique was compared with the NMOR technique exploiting FM of light.
In this paper an application of the AMOR technique to high-sensitive, broad-dynamic range magnetometry is described. We demonstrate application of the technique for magnetic field measurements within the range of 0.1–40 mG with the sensitivity G/. Analysis of the limitations of the present arrangement shows possibility of extension of the measurement range to geophysical fields and reaching the sensitivity close to the fundamental quantum limit.
The paper is organized as follows. In Sec. II the experimental apparatus is described. In the next section the NMOR signals are presented and different factors limiting amplitudes and widths of the signals, hence sensitivity of the method, are discussed. Special attention is drawn to atomic collisions which are recognized as one of the main mechanisms of relaxation in dense vapors ( atoms/cm3). Section IV is dedicated to a description of the method of magnetic-field tracking and the special algorithm enabling broad dynamic-range measurements. In Sec. V performance of the magnetometer is described, we comment on fundamental limits of the magnetic field measurements and discuss the demonstrated sensitivity of the method. Finally, conclusions are summarized in Sec. VI.
II Experimental setup
The layout of the experimental apparatus is presented in Fig. 1.
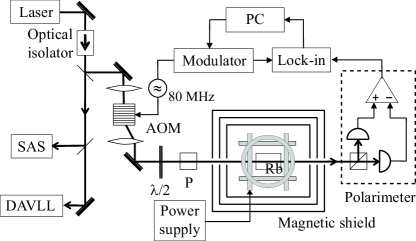
A sample of isotopically enriched 87Rb was contained in a cylindrical vapor cell of 2-cm length and 1.8 cm in diameter. Inner walls of the cell were coated with an antirelaxation (paraffin) layer which prevented atoms from depolarizing collisions with the walls and in this way lifetimes of ground-state Zeeman coherences were prolonged by three orders of magnitude to about 20 ms. In our cell at room temperature the lifetime is determined mostly by collisions of the atoms with uncoated surfaces inside the cell stem. The cell was placed inside a non-magnetic oven temperature-stabilized between 15 and 60∘C. Three nested -metal layers provided magnetic field shielding with about 104 efficiency. Residual magnetic fields remaining inside the inner-most layer were compensated by a set of three mutually perpendicular magnetic-field coils also used for application of a well-controlled field to the rubidium atoms.
An external-cavity diode laser was used as a light source. Its frequency was tuned to the center of the hyperfine component of the rubidium D1 line (795 nm) and stabilized with the dichroic-atomic laser lock Corwin1998DAVLL ; Wasik2002DFDL . Light frequency reference was provided by saturation spectroscopy. Before traversing the vapor cell, light passed through an acousto-optical modulator (AOM) optimized for the first-order diffraction. An MHz radio-frequency (rf) signal driving AOM was amplitude-modulated with frequencies ranging from 100 Hz to 50 kHz, with different modulation depths , waveforms, and duty cycles. In front of the cell a high-quality crystal polarizer was placed to ensure pure linear polarization of the incident light beam of 2 mm in-diameter. Light intensity was adjusted by a half-waveplate situated in front of the polarizer. After traversing the cell, polarization of the light beam was analyzed by a balanced polarimeter consisting of a Glan prism with an axis set at 45∘ with respect to the incident-light polarization and two photodiodes. A polarimeter differential signal was fed to a lock-in amplifier and measured at the first harmonic of the modulation frequency . A lock-in signal was stored on a computer which also controlled the light-modulation frequency and the magnetic field inside the shield.
III Results
In Fig. 2 the NMOR signal measured versus the magnetic field with fixed modulation frequency ( kHz) is presented.
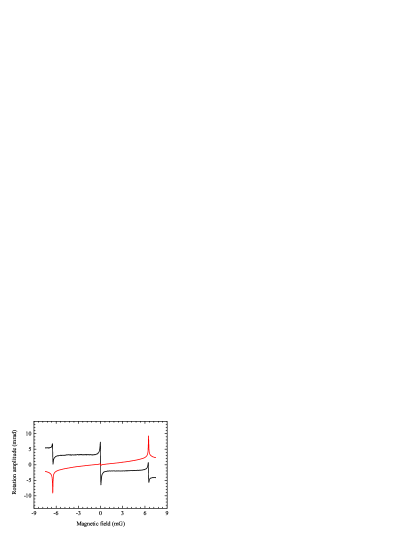
As seen, the in-phase component of the signal consists of three dispersive-like resonances. The central feature situated at is associated with the “typical” nonlinear Faraday effect, i.e., a similar signal would be observed with CW light 111Note that in an experimental scheme in which phase-sensitive detection of the magneto-optical rotation is used, appearance of NMOR resonances is only possible if light is modulated. For low magnetic fields () the modulation is not caused by the Faraday rotation but need to be introduced externally. Since in our experiment the same beam was used for pumping and probing, the light was amplitude modulated and hence the lock-in detection of the zero-field resonance was possible. On the contrary, in two-beam experiment, in which separated beams are used form pumping and probing atoms and probe-light intensity is unmodulated, hence the zero-field resonance is not observed.. Two satellite features are the high-field resonances centered at . The widths of these resonances, as well as the width of the zero-field resonance, are determined by an effective time of interaction between light and atoms. In paraffin-coated cells this time is related to the so-called wall-induced Ramsey effect Kanorskii1995Wall ; polarized atoms leave the light beam, bounce off the walls many times and return to the beam being still polarized. Thus the effective time of interaction between light and atom is prolonged to the time of round trip in which atomic polarization is preserved.
Two high-field resonances recorded in-phase are vertically offset in opposite directions symmetrically relative to zero. The exact mechanism of this offset is not clear yet and is a subject of independent studies. Most likely, it is caused by atomic thermal motions and atoms’ transit across the light beam. In that case, the atoms spend finite time within the light beam and do not reach stationary conditions Gawlik1986Nonstationary ; Pfleghaar1993Time ; Taichenachev2004Nonlinear ; Alipeva2003Narrow . This leads to appearance of broad, not necessarily Lorentzian contributions to the NMOR resonances with widths determined by the transit time. In the described experiment this time was about 10 s, hence its contribution to the NMOR signals was about thousand times broader than the narrowest NMOR resonances.
The quadrature component of the signal consists of two high-field absorptive-like features of opposite signs composed of narrow resonances with broad pedestals. We associate the pedestals with the transit effect, mentioned above. Another feature observed in quadrature is a small, dispersive-like signal at . Basing on previous measurements Balabas2006Milllicells and the observed light-intensity dependence of that feature, we link it with the alignment-to-orientation conversion Budker2000AOC . This effect arises when strong light converts atomic alignment into longitudinal orientation by a combined action of the magnetic field and electric field of light on the atomic polarization. For lower light intensities the feature disappears which supports our interpretation.
In Fig. 3 the NMOR signal around the high-field resonance is presented in the modulation-frequency domain with fixed magnetic field.
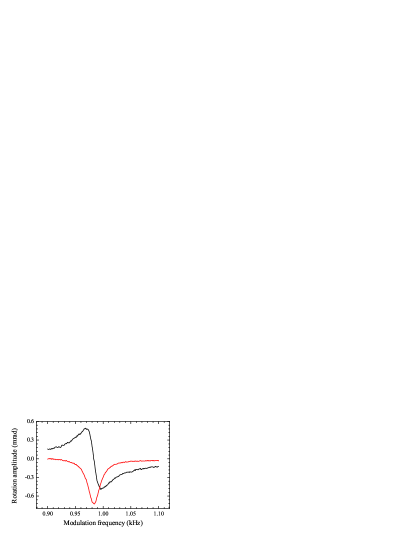
As before, the in-phase and quadrature components are characterized by the dispersive- and absorptive-like curves, respectively, that are centered at 2 with the width determined by the relaxation rate . Similarly to Fig. 2, the in-phase component of the NMOR signal is slightly offset. The offset depends on the Larmor frequency, as shown in the inset, and it is characterized by a wing of dispersive curve with the maximum at 16 kHz. This value is consistent with the 10 s time of atom flight through the beam which confirms our interpretation of the offset.
Since the width of the NMOR signal is associated with the ground-state relaxation rate, NMOR can be employed for investigations of relaxation processes of the coherences Pustelny2006Influence ; Budker2005Antirelaxation . Several different physical mechanisms are recognized to be responsible for ground-state relaxation in paraffin-coated cells. Some of them, such as collisions with the walls or relaxation due to magnetic field inhomogeneities, are independent of atomic concentration, while others, e.g., collisions between the atoms, are density dependent. The collisional relaxation is given by
| (1) |
where is the number density of atoms, is the the average relative velocity, is the Boltzmann constant, is the temperature, is the atomic mass, is the collisional relaxation cross-section, is the so-called nuclear slow-down factor Happer1972Review , and is the nuclear spin.
In order to calculate the temperature dependence of the atomic density, and hence the density dependence of the relaxation rate , an analysis similar to that of Ref. Pustelny2005Density is performed. We use the phenomenological relation between pressure and temperature Nesmeyanov1963
| (2) |
where , , , and are the numerical factors, and the ideal gas equation
| (3) |
Combining Eqs. (2) and (3) one obtains relation between and
| (4) |
Using Eq. (4) we plot the density dependences of the amplitude and width of the NMOR signal (Fig. 4).
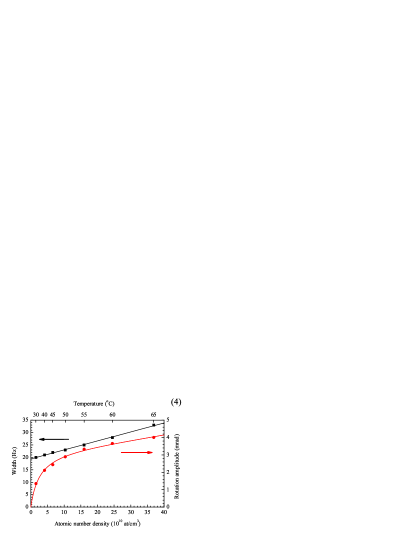
The width dependence was fit with
| (5) |
where is the parameter proportional to the collisional-relaxation cross-section and denotes the density independent relaxation rates. The fit yields Hz/cm3 and s-1. Using Eq. (1) with Okunevich1987 , one recalculates into the collisional-relaxation cross-section, cm2. This value exceeds by about 40% the literature value Happer1972Review of the spin-exchange cross-section, cm-2. In fact, evidence for excess surface relaxation depending on the atomic vapor density has been reported also in other experiments with paraffin-coated cells, see, for example, Refs. Budker2005Antirelaxation ; Graf2005Relaxation .
As shown in Fig. 4, the amplitude of the NMOR resonance depends on the atomic density in a nonlinear way. For low densities the amplitude grows linearly with , while for higher densities the dependence levels off which is caused by the rising light absorption in the cell, which is reflected by the dependence. In the context of NMOR, this effect was previously studied in uncoated cells in Ref. Pustelny2005Density ; Matsko2001Radiation .
The sensitivity of the described magnetometric technique depends on the slope of a central part of the NMOR resonance measured in the modulation-frequency domain (see Sec. V). To a good approximation this slope is determined by a ratio of the signal amplitude to its width. Thus for a given light intensity we take this ratio as a magnetometer figure of merit.
Using results presented in Fig. 4, we plot the amplitude-to-width ratio as a function of the atomic density and cell temperature (Fig. 5).

For low densities the ratio increases with concentration, but then it saturates. For even higher concentrations the amplitude-to-width ratio drops which results in reduced sensitivity of the magnetic-field measurements. Existence of the maximum indicates the optimal concentration for which the largest magnetometric sensitivity of the method is achieved. The maximum arises due to density-related relaxation and it occurs when the density-dependent and density-independent relaxations become comparable (see Fig. 5). Decrease of the density-dependent relaxation rate would improve the method’s sensitivity. In our experimental conditions a distinct maximum associated with the highest sensitivity was observed at atoms/cm3 (55∘C).
IV Magnetic field tracking
In Sec. III we showed that the positions of the high-field NMOR resonances in the magnetic field domain are determined by the modulation frequency, . Thus, by controlling the modulation frequency so that the resonance condition is fulfilled one can track the varying magnetic field.
As discussed in Sec. V, the sensitivity of the optical magnetometer is determined by the slope of the resonance used for field measurements. Therefore, from the point of view of the magnetometer sensitivity, it is desirable to have strong and narrow NMOR resonances. However, another important characteristic of the magnetometer is its bandwidth, i.e., response time of the magnetometer to a small change of a magnetic field. Therefore, the choice of optimal conditions of the magnetometer requires compromising between its sensitivity and bandwidth.
Analyzing the resonance signals, such as the one depicted in Fig. 3, it can be shown that the in-phase component is well suited for a magnetic field tracking. If the resonance conditions are initially fulfilled, a change of the magnetic field is reflected in a modification of the output signal, negative if the field increases and positive if it decreases. Thus, in the simplest realization of the magnetometer, the device can operate with a feedback loop automatically adjusting the modulation frequency to keep the signal level constant. However, a significant disadvantage of this method is its limited dynamic range related to the magnetic-field-dependent offset of the high-field resonances (see inset in Fig. 3). Due to the offset the magnetometer readout is burdened with a systematic error, or for more significant field changes, for which the offset is bigger than the amplitude of the signal, the magnetometer can completely lose the field-tracking ability.
In order to avoid such errors one might take use of higher derivatives of the signal or measure the NMOR signal at the higher harmonics of the modulation frequency; instead we developed a procedure that uses both components of the NMOR signal to track the field. After a change of the field intensity the in-phase component is first used to obtain information about a direction of the field change and bring the system somewhere close to the resonance. It is realized in the same manner as described above, i.e., the in-phase readout is compared with a preset value and the modulation frequency is coarsely modified to compensate the magnetic-field change. After this adjustment, the magnetometer switches modes and starts to use the quadrature component of the signal. At this stage the modulation frequency is modified such that the minimum of the quadrature component, and hence the field intensity is determined. After finding a new position of the resonance, the in-phase reference level is reset and this new value is used to track a successive change of the field. Application of this procedure enabled a tenfold increase of the dynamic range of the magnetic field measurement (from 4 mG to 40 mG). At the current stage of the experiment, the range is limited by technical issues.
In Fig. 6 the magnetometer tracking signal obtained with the described method is shown in a range from 0.1 mG to 40 mG.

For this measurement, every 9 s the field was increased by 150 G. After the field change, the magnetometer adjusted itself to a new value using the algorithm described above. It is worth noting that such arrangement enables measurement of static or slowly-varying magnetic fields and remains immune to the oscillating magnetic fields such as those associated with ac line.
V Performance and Sensitivity
In this Section, we discuss the quantum limit on the sensitivity and the obtained performance of the magnetometer.
V.1 Quantum limit
Sensitivity of optical magnetometers, such as the one described in this paper, has an intrinsic quantum limit. In general, that limit can be expressed as
| (6) |
where is the atomic shot-noise limit and is the photon shot-noise limit.
The atomic shot-noise limit originates from fluctuations of the number of atoms that contribute to the signal and depends on finite lifetime of the light-induced atomic polarization. For alkali-vapor magnetometers this limit is given by
| (7) |
where denotes the cell volume. Since the atomic shot-noise limit is proportional to the square root of the ground-state relaxation rate , a significant reduction of that limit can be achieved in paraffin coated or buffer-gas vapor cells. Moreover, analyzing Eq. (7), one obtains that higher sensitivity can be achieved with bigger cells and in more dense media. However, as shown in Sec. III, for higher atomic density relaxation due to atomic collisions becomes an important factorf and ratio does not decrease with the concentration 222Note that for concentrations of atoms exceeding at/cm3 ratio starts to drop with rising . This effect is related with limitation of the spin-exchange relaxation by frequent atomic collisions. In fact, the up-to-date most sensitive magnetometer, the so-called spin-exchange relaxation free (SERF) magnetometer, exploits this mechanism for achieving sensitivity of a fraction of 10-11 G/ in low-field measurements Kominis2003Subfemtotesla ..
The second contribution to the quantum limit of the magnetometric sensitivity is associated with the photon-shot noise in optical polarimetry
| (8) |
where refers to the total number of photons incident on the polarimeter. Expressing as a function of the light intensity, we derive formula for the photon-shot noise limit on the magnetic field measurements
| (9) |
where is the NMOR signal amplitude, denotes the average light intensity, is the beam area with being the light-beam diameter, is the duration of the measurement, and is the speed of light.
As discussed above, AM enables modification of the waveforms, duty cycles, and modulation depths of light. A change of either of these parameters is reflected in the amplitude and the width of the high-field resonance and, consequently, in the sensitivity of the magnetic-field measurements. Using Eq. (9), the light-intensity dependence of the photon shot-noise limit of the magnetic-field sensitivity is plotted for three different modulation types used in our experiment: the sine modulation and square-wave modulation with 25% and 75% duty cycles, all with 100% modulation depths and the same maximum light intensity (Fig. 7).
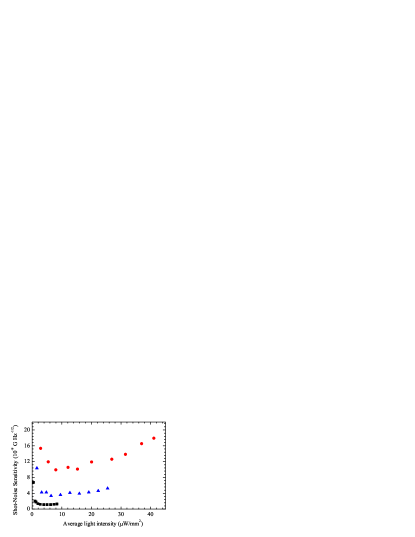
The results, presented in Fig. 7, show that among these three modulation waveforms the highest photon shot-noise limit on the magnetometric sensitivity can be achieved for the square-wave modulation with 25% duty cycle.
For the NMOR signals recorded with the described magnetometer we have calculated the photon and atomic shot-noise limits on the sensitivity being G/ and G/, respectively, and the overall quantum limit on the magnetometer sensitivity G/.
V.2 Demonstrated sensitivity
In order to find an intrinsic magnetometer sensitivity it is necessary to determine the smallest magnetic-field change still recognized by the device. In a perfectly shielded environment this value is given by an amplitude of the recorded noise. However, in real conditions, it is impossible to distinguish between the fluctuations originating from the magnetic-field fluctuations from the ones related to different kinds of noise (shot-noise, polarimeter noise, electronics noise, etc.). The latter are indeed limiting factors of the magnetometer performance, while the former ones result from a response of the magnetometer to magnetic-field changes and should not be considered as performance limits. Therefore, for analysis of the magnetometer sensitivity, it is practical to record a power spectral density (PSD) of the rotation signals. PSD allows determination of the signal-to-noise ratio () and provides additional information about the system operation. For known , the sensitivity can be calculated as
| (10) |
where is the measured width of the NMOR resonance.

Square root of the PSD of a typical signal provided by the operating magnetometer is shown in Fig. 8. The central peak is due to the Faraday rotation at twice the Larmor frequency, whereas its nearest sidebands are related to magnetic field oscillating at Hz, seen because of imperfect shielding of ac line. The value of , depicted in Fig. 8, with the NMOR resonance width of Hz for the applied pump beam intensity, corresponds to the measured magnetometer sensitivity of G/.
The demonstrated sensitivity of the magnetometer is about an order of magnitude lower than its shot-noise limit. This is related to the fact that apart from the quantum limit, there are other factors which more severely limit the magnetometer sensitivity. One such factor is the atomic density. According to Ref. Auzinsh2004Can , the strongest NMOR signals are observed in a medium with an optical depth close to unity, i.e., when each photon is scattered by atoms once. In room-temperature rubidium vapors contained in cells of small dimensions the optical depth is lower than unity, so it is necessary to heat the cell to increase the density. However, along with the rise of the atomic density, the adverse density-dependent relaxation becomes faster and broadens the NMOR resonances. It is thus necessary to compromise between the width and amplitude of the rotation signal when working with small cells. In our experiment in which the 2-cm long vapor cell was used, the best compromise was achieved for optical depth about 0.35 that is about 3 times smaller than in the case of the large cell setup with optimized shot-noise sensitivity. Additional suppression of the sensitivity is caused by the light scattering losses and electronic component noise.
VI Conclusions
We have demonstrated the all-optical magnetometric technique which allows measurements of slowly varying magnetic fields in the range of 40 mG with the sensitivity of 4.310-9 G/. We discussed the quantum limit of the method associated with the atomic and photon shot-noise. The shot-noise analysis showed that our experimental technique still leaves room for improvement.
Work towards extension of the dynamic range of magnetic field measurements to higher field (ultimately the Earth magnetic field) and increasing of the sensitivity of the method is in progress. In particular, we concentrate on development of the self-oscillating magnetometers Higbie2006AllOptical ; Pustelny2006AllOptical . In that technique the NMOR signal is used for modulation of pumping light. This realization of the experiment enables measurements of magnetic fields varying with a frequency up to 1 kHz and offers substantial simplification of the setup which is important from a point of view of commercialization of the technique.
Acknowledgements.
The authors would like to express their gratitude to Dmitry Budker, Andrzej Kułak, Stanisław Micek, and Simon Rochester for stimulating discussions and Józef Flaga and Stanisław Pajka for their technical assistance in realization of the experiment. This work has been supported by Polish Ministry Of Science and Higher Education grant # N N505 0920 33. One of the authors (S.P.) is a scholar of the Foundation for Polish Science.References
- (1) M. Faraday, Trans. R. Soc. London, 136, 1 (1846); M. Faraday, Philos. Mag. 28, 294 (1846).
- (2) D. Macaluso and O. M. Corbino, Nuovo Cimento 8, 257 (1898); D. Macaluso and O. M. Corbino, Nuovo Cimento 9, 384 (1898).
- (3) W. Hanle, Z. Phys. A 35, 346 (1924).
- (4) W. Gawlik, J. Kowalski, R. Neumann, and F. Träger, Opt. Commun. 12, 400 (1974).
- (5) D. Budker, W. Gawlik, D. F. Kimball, S. M. Rochester, V. V. Yashchuk, and A. Weis, Rev. Mod. Phys. 74, 1153 (2002).
- (6) D. Budker, D. F. Kimball, V. V. Yashchuk, and M. Zolotarev, Phys. Rev. A 65, 055403 (2002).
- (7) W. Bell and A. Bloom, Phys. Rev. Lett. 6, 280 (1961).
- (8) A. Corney and G. W. Series, Proc. Phys. Soc. 83, 213 (1964).
- (9) C. Cohen-Tannoudji, J. D. DuPont-Roc, S. Haroche, F. Laloë, Rev. Phys. Appl. 5, 102 (1970).
- (10) V. Acosta, M. P. Ledbetter, S. M. Rochester, D. Budker, D. F. Jackson Kimball, D. C. Hovde, W. Gawlik, S. Pustelny, J. Zachorowski, and V. V. Yashchuk, Phys. Rev. A 73, 053404 (2006).
- (11) W. Gawlik, L. Krzemień, S. Pustelny, D. Sangla, J. Zachorowski, M. Graf, A. O. Sushkov, and D. Budker, Appl. Phys. Lett. 88, 131108 (2006).
- (12) M. V. Balabas, D. Budker, J.Kitching, P. D. D. Schwindt, and J. E. Stalnaker, JOSA B 23, 1001 (2006).
- (13) J. M. Higbie, E. Corsini, and D. Budker, Rev. Sci. Instr. 77, 113106 (2006).
- (14) K. L. Corwin, Z.-T. Lu, C. F. Hand, R. J. Epstain, and C. Wieman, Appl. Opt. 37, 3295 (1998).
- (15) G. Wa̧sik, W. Gawlik, J. Zachorowski, and W. Zawadzki, Appl. Phys. B 75, 613 (2002).
- (16) S. I. Kanorsky, A. Weis, and J. Skalla, Appl. Phys. B 60, S165 (1995).
- (17) W. Gawlik, Phys. Rev. A 34, 3760 (1986).
- (18) E. Pfleghaar, J. Wurster, S. I. Kanorsky, and A. Weis, Opt. Commun. 99, 303 (1993).
- (19) A.V. Taichenachev, A. M. Tumaikin, V. I. Yudin, M. Stähler, R. Wynands, J. Kitching, and L. Hollberg, Phys. Rev. A 69, 024501 (2004).
- (20) E. Alipieva, S. Gateva, E. Taskova, and S. Cartaleva, Opt. Lett. 28, 1817 (2003).
- (21) D. Budker, D.F. Kimball, S.M. Rochester, and V.V. Yashchuk, Phys. Rev. Lett. 85, 2088 (2000).
- (22) S. Pustelny, D. F. Jackson Kimball, S. M. Rochester, V. V. Yashchuk, and D. Budker, Phys. Rev. A 74, 063406 (2006).
- (23) D. Budker, L. Hollberg, D. F. Kimball, J. Kitching, S. Pustelny, and V. V. Yashchuk, Phys. Rev. A 71, 012903 (2005).
- (24) W. Happer, Rev. Mod. Phys. 44, 169 (1972).
- (25) S. Pustelny, W. Lewoczko, and W. Gawlik, JOSA B 22, 37 (2005).
- (26) A. N. Nesmyanov, Vapor pressures of the chemical elements, Elsevier, New York, 1963.
- (27) A. I. Okunevich, in Optical orientation of atoms and molecules (FTI, Leningrad, 1987), p. 65.
- (28) M. T. Graf, D. F. Kimball, S. M. Rochester, K. Kerner, C. Wong, and D. Budker, Phys. Rev. A 72, 023401 (2005).
- (29) A. B. Matsko, I. Novikova, M. O. Scully, and G. R. Welch, Phys. Rev. Lett. 87, 133601 (2001).
- (30) I. K. Kominis, T. W. Kornack, J. C. Allred, and M. V. Romalis, Nature 422, 596 (2003).
- (31) M. Auzinsh, D. Budker, D. F. Kimball, S. M. Rochester, J. E. Stalneker, A. O. Sushkov, and V. V. Yashchuk, Phys. Rev. Lett. 93, 173002 (2004).
- (32) S. Pustelny, A. Wojciechowski, M. Kotyrba, K. Sycz, J. Zachorowski, W. Gawlik, A. Cingoz, N. Leefer, J. M. Higbie, E. Corsini, A. O. Sushkov, M. P. Ledbetter, S. M. Rochester, D. F. Jackson Kimball, and D. Budker, Proc. of SPIE 6604, 660404 (2007).