The Distances of SNR W41 and overlapping HII regions
Abstract
New HI images from the VLA Galactic Plane Survey show prominent absorption features associated with the supernovae remnant G23.3-0.3 (SNR W41). We highlight the HI absorption spectra and the 13CO emission spectra of eight small regions on the face of W41, including four HII regions, three non-thermal emission regions and one unclassified region. The maximum velocity of absorption for W41 is 782 km/s and the CO cloud at radial velocity 955 km/s is behind W41. Because an extended TeV source, a diffuse X-ray enhancement and a large molecular cloud at radial velocity 775 km/s overlap the center of W41, the kinematic distance is 3.9 to 4.5 kpc for W41. For the HII regions, our analysis shows that both G23.42-0.21 and G23.07+0.25 are at the far kinematic distances (9.9 kpc and 10.6 kpc respectively) of their recombination-line velocities (1030.5 km/s and 89.62.1 km/s respectively), G23.07-0.37 is at the near kinematic distance (4.40.3 kpc) of its recombination-line velocity (82.72.0 km/s), and G23.27-0.27 is probably at the near kinematic distance (4.10.3 kpc) of its recombination-line velocity (76.10.6 km/s).
1 Introduction
The interaction between a supernovae remnant (SNR) and its surrounding interstellar gas (i.e. ionized hot gas, neutral atomic gas, and dense molecular gas) can effect the dynamics and physical/chemical processes in interstellar space. The interaction is considered to trigger several observable physical phenomena, e.g. OH (1720 MHz) shock-excited masers, enhanced values of the CO ()/() line ratio in a CO cloud, enhanced diffuse X-rays and very high energy -rays. These observational features have been used as direct indicators of a physical association between a SNR and its surrounding interstellar medium.
Here, the emphasis is on the distance to W41 and its overlapping HII regions using 21 cm HI absorption spectra and CO emission spectra. These methods have been employed by Tian et al. (2007a) to measure the kinematic distances of the SNR G18.8+0.3 and its associated CO clouds. Gordon et al. (1976) first estimated distance of 4.6 - 7 kpc for W41 by observations of HI emission and absorption in the W41 region. Tian et al (2007b) revised the distance using an incorrect association with a molecular cloud at about 63 km/s. Generally, HI observations may decide distances (or distance range) of the associations and distinguish if the associations are physical or only morphological. However, there exists the so-called kinematic distance ambiguity in the inner Galaxy, i.e. each radial velocity along a given line-of-sight corresponds to two distances equally spaced on either side of the tangent point. CO observations have helped to reduce the ambiguity to some degree, since a CO cloud behind a SNR will not produce HI absorption feature in the SNR’s absorption spectrum. I.e, if a CO cloud’s radial velocity is more than the maximum HI absorption line velocity in the direction of a SNR, the SNR should be located at the near distance of the maximum HI absorption line velocity. Especially, if a HII region is overlapping with a SNR, the HI and CO observations together may solve the distance ambiguity completely: the comparison of the maximum HI absorption line velocity with the recombination-line velocity of the HII region may decide whether the HII region is at the far or near distance of the recombination-line velocity (e.g. Kolpak et al. 2003). In this paper, we use these methods to directly measure distances of the SNR W41 and its overlapping HII regions, therefore verify a W41/CO cloud interaction which has been used to explain the origin of the TeV source and diffuse X-rays in the center of W41 (Tian et al. 2007b). We identify a different CO cloud, at 77 km/s, interacting with W41 and revise the distance to W41.
2 Radio Observations
The HI-line data sets come from the VLA Galactic Plane Survey (VGPS, Stil et al. 2006). The data sets are mainly based on observations from VLA of the National Radio Astronomy Observatory (NRAO). The synthesized beam for the HI line images is 1′, the radial velocity resolution is 1.56 kms, and the rms noise is 2 K per channel. The short-spacing information for the H I spectral line images is from additional observations with the 100 m Green Bank Telescope of the NRAO. The CO-line () data set is from the Galactic ring survey (Jackson et al. 2006) by employing the Five College Radio Astronomy Observatory 14 m telescope. The CO-line data in the paper have velocity coverage of -5 to 135 km/s, an angular sampling of 22′′, radial velocity resolution of 0.21 km/s, and rms noise of 0.13 K.
3 Results
3.1 HI Emission and Absorption Spectra
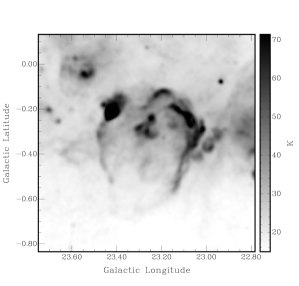
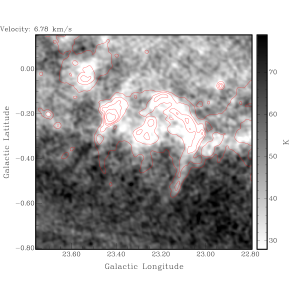
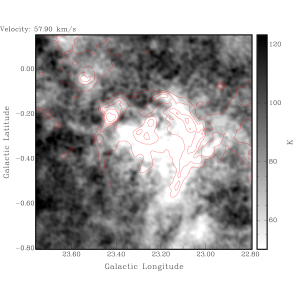
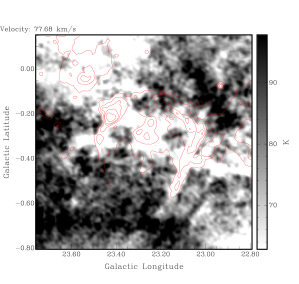
We have searched the VGPS radial velocity range from -110 to 170 km/s for features in the HI which might be related to the morphology of W41. There are HI features coincident with the SNR in three velocity ranges: 0 to 10 km/s, 50 to 63 km/s, and 69 to 79 km/s (see Fig. 1). These maps have superimposed contours (at 30, 45, 62, 148 K) of 1420 MHz continuum emission chosen to show the SNR. Clear absorption features are detected in almost the whole radial velocity range 0 to 106 km/s, which are associated with the brightest HII region G23.42-0.21 overlapping W41. These HI features are strongly correlated with the continuum intensity, indicating that they are caused by HI absorption between the continuum emission source and the earth.
In order to study the distances of W41 and its overlapping HII regions, we obtained their HI absorption spectra. The methods to construct HI absorption spectra are discussed in general by Dickey and Lockman (1990). For extended sources like W41, the methods have been extended by Tian et al. (2007a), i.e. = - = (-)(1-). and are the average brightness temperatures of many spectra from a selected area on a strong continuum emission region of the source and of an adjacent background region. Here we use a box for the source region and an annular box excluding the source box. and are the average continuum brightness temperatures for the same regions respectively. is the optical depth from the continuum source to the observer along the line-of-sight. Eight small source regions, marked in the upper left plot of Fig. 2, have been selected from the W41 area, including four thermal HII regions which have been identified before, three non-thermal emission regions originating from W41, and one unclassified region which is probably a HII region due to its strong continuum emission at 5 GHz (named as G23.24-0.11, see Becker et al. 1994). The seven other plots of Fig. 2 show the HI emission and absorption spectra of these regions. The absorption features mostly line up with valleys in the emission spectra since the background spectra also cover part of continuum emission regions. Table 1 summarizes the parameters used to obtain the spectra. To estimate uncertainties of the absorption spectra, we calculate the standard derivation of e-τ for velocities 120 km/s and -40 km/s. The values of 3 are listed in Table 1. This gives some indicator of what size of errors to expect. However, since the features are mainly not statistical but rather due to real clouds, that happen to be either in the source box (or the background box) but not in the background box (or the source box), this is only a rough indicator of what is spurious. The maximum radial velocity of absorption in the direction of each region and the available recombination-line velocities of the four HII regions are summarized in Table 2.
3.2 CO Emission Spectra
Fig. 3 shows 13CO-line emission spectra of the eight regions. The 13CO emission spectra over the full area of W41 in velocity range of -5 to 135 km/s show five high brightness-temperature CO molecular clouds, at radial velocities 533, 634, 775, 955 and 1015 km/s respectively, and two low brightness-temperature CO molecular clouds, at 41 km/s and 203 km/s respectively. The third line of Table 2 gives the radial velocity of the CO cloud which corresponds to the maximum HI absorption for each of the eight regions. The fourth line gives the radial velocity of the CO cloud behind the CO cloud corresponding to the maximum HI absorption: this velocity gives an upper limit to the distance since the continuum emission must be located in front of this CO cloud.
4 Discussion
4.1 The interaction between W41 and its surrounding CO clouds
Albert et al. (2006) studied the 12CO data and found a giant molecular cloud (GMC) with a 12CO peak emission from 70 to 85 km/s. Our 13CO emission spectra show that a GMC at radial velocity of 775 km/s is detected in all eight emission regions including the center of W41. Recent observations detected a diffuse X-ray enhancement likely associated with an extended TeV source in the center of W41 (Tian et al. 2007b). The 775 km/s CO cloud is likely the one responsible for the TeV emission by TeV protons accelerated by the SNR colliding with protons in the cloud to produce pions, which decay to -rays (Yamazaki et al. 2006). Therefore, W41 is associated with this GMC physically, i.e., W41 is adjacent to or within the cloud at 775 km/s, and their interaction is responsible for the detected X-rays, likely due to synchrotron from secondary electrons, and -rays, due to pion decay. In Tian et al. (2007b), the distance to W41 and association with a CO cloud at 63 km/s were incorrect due to association of W41 with a HI absorption feature at this velocity. We still conclude that W41 interacts with a CO cloud, but the cloud is at 775 km/s.
4.2 Distance of W41 and the overlapping HII regions
The HI emission spectra in Fig. 2 indicate a tangent point velocity of = 1122 km/s in the direction of W41. A pure circular velocity model can not be used to obtain VR due to non-circular motions (e.g. Brand & Blitz 1993). =1122 km/s is consistent with the value from fig. 8 of Weiner Sellwood (1999) who include non-circular motions. W41’s distance is limited by the maximum radial velocity for absorption of 782 km/s from the absorption spectra of W41 (regions C1, 2 and 7). Also, the CO cloud (955 km/s) is behind W41, because it shows no respective HI absorption feature due to W41 (regions C1, 2 and 7). There are two noisy absorption features at 95 km/s and -30 km/s respectively in the region 2 spectrum. Also the continuum emission of region 2 is partly due to a weak HII region G23.42-0.39. So we think the two absorption features are probably either not real due to limited accuracy of the background HI spectrum or else related with the adjacent G23.42-0.39 (see below for detail), which is so faint in Fig. 1 that it is difficult for us to obtain a reliable absorption spectrum here. Since W41 is closer than the tangent point and VR (782 km/s) is significantly less than , W41 is close enough to use the Galaxy velocity field of Brand Blitz (1993). Recent measurements of the parameters for the Galactic rotation curve model give R0=7.60.3 kpc (Eisenhauer et al. 2005) and V0=2147 km/s (Feast & Whitelock 1997, Reid & Brunthaler 2004). Figs. 6a and 6b of Brand Blitz (1993) show that the mean rotation curve is nearly flat for these values, so we use a flat rotation curve. For pure circular rotation, the distance to W41 is d 4.4 kpc (R 4.0 kpc). Fig. 10 of Brand Blitz (1993) shows a systematic velocity deviation of +5 km/s from circular rotation in the direction of W41 (also consistent with Weiner Sellwood 1999) for d 4.4 kpc. Using a systematic deviation of +5 km/s and a random velocity of 5 km/s, the radial velocity of W41 due to circular rotation is 66 to 80 km/s. This yields a distance to W41 of d= 3.9 to 4.5 kpc (R= 4.3 to 3.9 kpc).
The recombination-line velocities of the four HII regions have been obtained previously (Lockman 1989). By comparison of the HI absorption spectrum with the CO emission spectrum, we find all major CO clouds have respective HI absorption in the direction of the bright HII region G23.42-0.21 (region 3). Kolpak et al (2003) showed an HI absorption spectrum of G23.42-0.21 and suggested the distance to G23.42-0.21 (with low confidence) is at the near side of the recombination line velocity since the HII recombination line velocity, maximum absorption velocity and tangent point velocity are nearly the same. We obtained a similar absorption spectrum with the additional information of the CO emission feature velocity, but clear absorption features at 106 km/s in the HI map are associated with G23.42-0.21. We argue the maximum absorption velocity exceeds the recombination line velocity, so G23.42-0.21 is at the far kinematic distance of the recombination-line velocity (1030.5 km/s), i.e. 9.90.3 kpc (here we use the systematic velocity field given by Weiner Sellwood 1999). Similarly, the maximum absorption velocity of HII region G23.07-0.25 (region 5) is more than its respective recombination-line velocity. This shows that this HII region is also located at the far kinematic distance of its recombination-line velocity, i.e. 10.60.3 kpc for 89.62.1 km/s.
The small emission region G23.42-0.39, adjacent to the region 2, has been listed in a new compact HII region catalog (Giveon et al. 2005) based on its spectral index between 1.4 and 5 GHz, but no recombination-line is detected. Because of its faint continuum emission at 1.4 GHz (Fig. 1), we can not obtain a reliable absorption spectrum, nor a distance. HII region G23.07-0.37 (region 6) is at the near kinematic distance (4.40.3 kpc) of its recombination-line velocity 82.72.0 km/s, since there is no absorption seen beyond this velocity. For HII region G23.27-0.27 (region C2), a weak absorption feature at 952 km/s seems to be related with a CO emission at 955 km/s. However, another CO emission feature at 1032 km/s clearly doesn’t produce respective HI absorption, so we think the weak absorption feature at 952 km/s is not real. In this case, G23.27-0.27 is probably at the near distance (4.1 0.3 kpc) of its recombination-line velocity 76.10.6 km/s. Although the unclassified source G23.24-0.11 (region 4) lies on the bright arc in the northern border of W41, its maximum absorption velocity is at 102 km/s, which means the source is not part of the SNR.
5 Conclusion
The HI absorption spectra and the CO emission spectra of four HII regions, three non-thermal emission regions and one unclassified region covering W41 have been constructed. They show that the maximum radial velocity of absorption for W41 is 782 km/s and the CO cloud at 955 km/s is behind W41. Further considering the evidence that an extended TeV source, a diffuse X-ray enhancement and a GMC at 775 km/s are also located at the center of W41, we think that W41 is associated with the GMC physically. Thus we obtain a kinematic distance of 3.9 to 4.5 kpc for W41. In addition, by combining HI absorption features with known recombination-line velocities of four HII regions overlapping W41, we give the distances of the four HII regions.
References
- (1) Aharonian, F., Akhperjanian, A.G., Aye, K.-M. et al. 2005, Science, 307, 1938
- (2) Albert, J., Aliu, E., Anderhub, H. et al. 2006, ApJ, 643, L53
- (3) Becker, R. H., White, R. L., Helfand, D. J. et al. 1994, ApJS, 91, 347
- (4) Brand, J, Blitz, L. 1993, A&A, , 275, 67
- (5) Clark, D.H., Caswell, J.L. 1976, MNRAS, 174, 267
- (6) Dickey, J.M., Lockman, F. J. 1990, Annu. Rev. A&A, 28, 215
- (7) Eisenhauer, F., Genzel, R., Alexander, T. et al. 2005, ApJ, 628, 246
- (8) Feast, M., Whitelock, P. 1997, MNRAS, 291, 683
- (9) Frail, D.A., & Mitchell, G. F. 1998, ApJ, 508, 690
- (10) Giveon, U., Becker, R. H., Helfand, D. J., White, R. L. 2005, AJ, 129, 348
- (11) Gordon, C.P., Gordon, K.J., Jacobson, M.R.,1976, ApJ, 203, 593
- (12) Lockman, F, J. 1989, ApJS, 71, 469
- (13) Jackson, J.M., Rathborne, J.M., Shah, R.H. et al. 2006, ApJ Suppl., 163, 145
- (14) Kolpak, M.A., Jackson, J.M., Bania, T.M., Clemens, D.P., Dickey, J.M. 2003, ApJ, 582, 756
- (15) Reid, M.J., Brunthaler, A. 2004, ApJ, 616, 872
- (16) Stil, J.M., Taylor, A.R., Dickey, J.M. et al. 2006, AJ, 132, 1158
- (17) Tian, W.W. Leahy, D.A., Wang, Q.D. 2007a, A&A, accepted
- (18) Tian, W.W., Li, Z., Leahy, D.A., Wang, Q.D. 2007b, ApJ, 657, L25
- (19) Weiner, B.J., Sellwood, J.A. 1999, ApJ, 524, 112
- (20) Yamazaki, R., Kohri, K., Bamba, A. et al. 2006, MNRAS, 371, 1975
| Region: | C1 | C2 | 2 | 3 | 4 | 5 | 6 | 7 |
| Coordinate l: | 23.25 | 23.27 | 23.46 | 23.42 | 23.24 | 23.07 | 23.07 | 23.12 |
| Coordinate b: | -0.24 | -0.27 | -0.35 | -0.21 | -0.11 | -0.25 | -0.37 | -0.50 |
| No. source spectra | 49 | 126 | 345 | 322 | 210 | 360 | 437 | 232 |
| No. background spectra | 91 | 216 | 728 | 935 | 726 | 663 | 719 | 667 |
| (K) | 62.4 | 57.4 | 34.6 | 83.8 | 49.3 | 57.9 | 53.7 | 36.7 |
| (K) | 41.9 | 41.1 | 27.1 | 33.9 | 28.9 | 42.7 | 39.1 | 25.9 |
| Standard derivation(3) | 0.17 | 0.18 | 0.22 | 0.08 | 0.13 | 0.14 | 0.11 | 0.12 |
| Region Number: | C1 | C2 | 2 | 3 | 4 | 5 | 6 | 7 |
|---|---|---|---|---|---|---|---|---|
| km/s | SNR | HII | SNR | HII | ? | HII | HII | SNR |
| Maximum absorption velocity: | 762 | 952 | 782 | 1042 | 1021 | 1002 | 753 | 782 |
| HII recombination-line velocity: | 76.10.6 | none | 1030.5 | 89.62.1 | 82.72.9 | |||
| Nearby CO emission feature: | 775 | 955 | 782 | 1025 | 955 | 1022 | 763 | 775 |
| Far CO emission feature: | 955 | 1025 | 1022 | 843 |