The XMM-LSS catalogue: X-ray sources and associated optical data. Version I
Abstract
Following the presentation of the XMM-LSS X-ray source detection package by Pacaud et al., we provide the source lists for the first 5.5 surveyed square degrees. The catalogues pertain to the [0.5-2] and [2-10] keV bands and contain in total 3385 point-like or extended sources above a detection likelihood of 15 in either band. The agreement with deep logN-logS is excellent. The main parameters considered are position, countrate, source extent with associated likelihood values. A set of additional quantities such as astrometric corrections and fluxes are further calculated while errors on the position and countrate are deduced from simulations. We describe the construction of the band-merged catalogue allowing rapid sub-sample selection and easy cross-correlation with external multi-wavelength catalogues. A small optical CFHTLS multi-band subset of objects is associated wich each source along with an X-ray/optical overlay. We make the full X-ray images available in FITS format. The data are available at CDS and, in a more extended form, at the Milan XMM-LSS database.
keywords:
catalogues, surveys, X-rays: general1 Introduction
The XMM Large Scale Structure Survey (XMM-LSS) has been designed to provide a well defined statistical sample of X-ray galaxy clusters out to a redshift of unity, over a single large area, suitable for cosmological studies (Pierre et al. 2004). This requires the ability to detect and characterize faint extended sources, in such a way as to control both the selection effects and the contamination by spurious or misclassified pointlike sources. For this purpose, we have developed a dedicated X-ray image processing package, Xamin, which is adapted to the complex characteristics of the XMM focal plane (Pacaud et al. 2006). It is a two-step procedure combining wavelet multi-resolution analysis and maximum likelihood fits, both using Poisson statistics. The package has been extensively tested and its parameters adjusted by means of simulations, for the extended (clusters) and pointlike (AGN) source populations; the latter representing some 95% of the X-ray sources at our sensitivity of in the [0.5-2] keV band.
The first reports on cluster and AGN populations, based on the Xamin products and associated selection function, were published by Pierre et al. (2006) and Gandhi et al. (2006) respectively.
The guaranteed time pointings (G fields in Table 1) were previously analysed with an independent, more traditional pipeline analogous to the one used for the HELLAS2XMM survey (Baldi et al. 2002), as described in Chiappetti et al. (2005), providing also the standard reference for the Milan XMM-LSS database.
The XMM-LSS survey, located around is associated in the optical with the Wide Synoptic component of the Canada France Hawaii Telescope Legacy Survey111http://cfht.hawaii.edu/Science/CFHLS/ (CFHTLS - W1).
In this paper, we present the source lists obtained for the first 45 XMM-LSS pointings processed by Xamin along with the relevant information on the catalogues (Sec. 2) as well as the X-ray images (Sec. 3.1). Sec. 3.2 describes the associated optical data that we make publicly available. The online facilities and plans for future releases are presented in the two last sections.
2 The X-ray source lists
2.1 List of available pointings
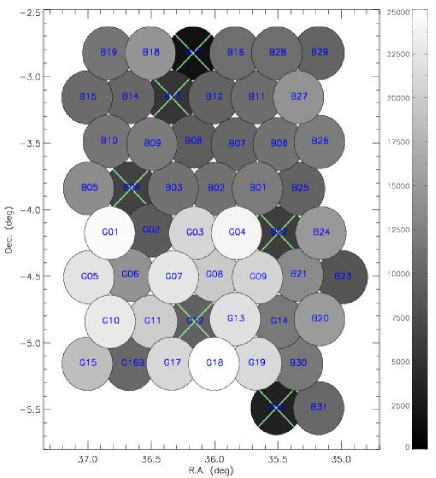
The XMM-LSS pointings pertaining to the Guaranteed Time, AO-1 and AO-2 periods are listed in Table 1 and displayed in Fig. 1. The raw X-ray observations (ODFs) were reduced using the standard XMM Science Analysis System (XMMSAS; version v6.1) tasks emchain and epchain for the MOS and pn detectors respectively. High background periods, related to soft protons, were excluded from the event lists following the procedure outlined by Pratt & Arnaud (2002).The resulting light curves were visually inspected. After this operation, a number of pointings appeared to be not usable for the purpose of the XMM-LSS survey (too low effective exposure times) and, consequently, are not included in the present version of the catalogue. The fields in question were re-observed during AO-5 (July 2006 - January 2007) and will be published in a subsequent data release.
Shifts are the astrometric corrections: RA/cos(Dec) = RAXMM-RAcorrect, Dec = DecXMM-Deccorrect (see Sec. 2.3.3); last column indicates whether the correction is based on CFHTLS W1 data (1) , see Sec. 3, or on the USNO-A2 catalogue (2).
The letter G refers to the Liège/Milan/Saclay Guaranteed Time (nominal exposure time: 20 ks) and the letter B to the observations performed during the Guest Observer phases (nominal exposure time: 10 ks).
| Field id | RA (J2000) | Dec (J2000) | Exposure times (ks) | Astrometric correction | |||||
|---|---|---|---|---|---|---|---|---|---|
| Internal | XMM ID | MOS1 | MOS2 | pn | RA (′′) | Dec (′′) | Origin | ||
| G01 | 112680101 | 02:27:25.4 | -04:11:06.4 | 24.6 | 25.3 | 21.4 | -1.60 | +0.53 | 1 |
| G02 | 112680201 | 02:25:54.2 | -04:09:05.6 | 10.1 | 9.7 | 6.7 | -1.07 | +0.00 | 1 |
| G03 | 112680301 | 02:24:45.6 | -04:11:00.8 | 21.8 | 21.7 | 17.3 | -1.07 | +1.07 | 1 |
| G04 | 109520101 | 02:23:25.3 | -04:11:07.6 | 25.5 | 25.8 | 19.5 | -1.60 | +0.53 | 1 |
| G05 | 112680401 | 02:28:05.1 | -04:31:08.1 | 23.5 | 23.9 | 12.5 | -1.07 | +1.07 | 1 |
| G06 | 112681301 | 02:26:34.4 | -04:29:00.8 | 16.4 | 16.6 | 10.5 | -0.53 | +0.53 | 1 |
| G07 | 112681001 | 02:25:25.3 | -04:31:07.1 | 22.5 | 25.1 | 18.6 | -0.53 | +0.00 | 1 |
| G08 | 112680501 | 02:23:54.6 | -04:29:00.1 | 21.2 | 21.3 | 15.9 | +0.00 | +1.07 | 1 |
| G09 | 109520601 | 02:22:45.2 | -04:31:11.1 | 22.5 | 22.7 | 16.4 | +0.00 | +0.53 | 1 |
| G10 | 109520201 | 02:27:25.4 | -04:51:04.4 | 24.7 | 24.6 | 18.5 | -1.07 | +1.07 | 1 |
| G11 | 109520301 | 02:26:05.1 | -04:51:06.1 | 21.7 | 21.8 | 16.1 | -1.06 | +0.53 | 1 |
| G12* | 109520401 | 02:24:45.4 | -04:51:11.2 | not used | -0.54 | +0.53 | 1 | ||
| G13 | 109520501 | 02:23:13.1 | -04:49:03.1 | 23.6 | 23.9 | 17.8 | -2.67 | -0.53 | 1 |
| G14 | 112680801 | 02:22:04.1 | -04:51:09.7 | 14.4 | 14.1 | 8.3 | +1.06 | +0.53 | 1 |
| G15 | 111110101 | 02:27:54.1 | -05:09:02.3 | 20.8 | 21.8 | 14.0 | -2.67 | +0.00 | 1 |
| G16a* | 111110201 | 02:26:34.2 | -05:09:03.1 | not used | -1.60 | +0.53 | 1 | ||
| G16b | 111110701 | 02:26:35.2 | -05:08:46.6 | 11.9 | 11.9 | 11.5 | +0.00 | +0.53 | 1 |
| G17 | 111110301 | 02:25:14.3 | -05:09:08.4 | 22.4 | 22.2 | 17.5 | -2.67 | -0.53 | 1 |
| G18 | 111110401 | 02:23:54.1 | -05:09:09.7 | 27.7 | 28.0 | 19.2 | -2.67 | +0.00 | 1 |
| G19 | 111110501 | 02:22:34.0 | -05:09:02.1 | 23.2 | 23.8 | 16.8 | -2.67 | +0.00 | 1 |
| B01 | 037980101 | 02:22:45.5 | -03:50:58.8 | 14.1 | 14.2 | 8.3 | -2.13 | +0.00 | 1 |
| B02 | 037980201 | 02:24:05.6 | -03:51:00.0 | 13.2 | 13.2 | 7.8 | -2.13 | +0.00 | 1 |
| B03 | 037980301 | 02:25:25.7 | -03:50:59.2 | 13.3 | 13.0 | 7.9 | -1.07 | +0.53 | 1 |
| B04* | 037980401 | 02:26:45.4 | -03:51:00.1 | not used | -1.07 | +0.53 | 1 | ||
| B05 | 037980501 | 02:28:05.4 | -03:51:00.5 | 15.7 | 15.7 | 10.5 | -0.53 | +1.06 | 1 |
| B06 | 037980601 | 02:22:05.6 | -03:31:00.2 | 13.2 | 13.2 | 7.7 | -1.60 | +0.53 | 2 |
| B07 | 037980701 | 02:23:25.7 | -03:30:56.7 | 12.3 | 12.3 | 6.9 | -3.73 | +0.00 | 2 |
| B08 | 037980801 | 02:24:34.3 | -03:29:05.1 | 10.6 | 11.5 | 6.3 | -0.53 | +1.07 | 2 |
| B09 | 037980901 | 02:26:05.4 | -03:31:01.1 | 13.9 | 13.8 | 8.9 | -0.54 | +0.53 | 2 |
| B10 | 037981001 | 02:27:14.2 | -03:28:58.7 | 13.0 | 13.2 | 8.6 | -1.07 | +2.13 | 2 |
| B11 | 037981101 | 02:22:34.2 | -03:09:02.5 | 12.4 | 12.3 | 7.9 | -3.20 | +1.07 | 2 |
| B12 | 037981201 | 02:23:54.4 | -03:09:04.1 | 11.4 | 11.3 | 7.0 | -3.20 | +0.00 | 2 |
| B13* | 037981301 | 02:25:14.4 | -03:08:57.4 | not used | -0.53 | +1.60 | 2 | ||
| B14 | 037981401 | 02:26:34.4 | -03:08:57.6 | 12.6 | 12.5 | 6.6 | -0.53 | +3.73 | 2 |
| B15 | 037981501 | 02:27:54.6 | -03:08:59.3 | 11.4 | 11.5 | 8.4 | -2.13 | +1.07 | 2 |
| B16 | 037981601 | 02:23:14.4 | -02:48:56.3 | 12.3 | 12.7 | 7.9 | -1.60 | +2.13 | 2 |
| B17* | 037981701 | 02:24:34.8 | -02:48:50.0 | not used | -2.67 | +3.73 | 2 | ||
| B18 | 037981801 | 02:25:55.0 | -02:48:49.1 | 16.0 | 16.2 | 11.4 | -1.07 | +2.13 | 2 |
| B19 | 037981901 | 02:27:14.9 | -02:48:49.5 | 13.1 | 13.1 | 8.7 | -1.07 | +2.13 | 2 |
| B20 | 037982001 | 02:20:34.8 | -04:48:46.3 | 16.1 | 16.8 | 11.7 | -1.60 | -0.53 | 1 |
| B21 | 037982101 | 02:21:14.9 | -04:28:45.9 | 15.6 | 15.6 | 9.9 | -2.13 | +0.53 | 1 |
| B22* | 037982201 | 02:22:05.5 | -04:11:03.9 | not used | +0.00 | +0.00 | 1 | ||
| B23 | 037982301 | 02:20:05.5 | -04:31:03.9 | 9.0 | 9.6 | 6.5 | -1.07 | +1.60 | 1 |
| B24 | 037982401 | 02:20:45.6 | -04:11:01.2 | 18.1 | 18.2 | 10.4 | -1.07 | +0.53 | 1 |
| B25 | 037982501 | 02:21:25.5 | -03:51:02.4 | 11.5 | 11.9 | 6.8 | -1.07 | -0.53 | 1 |
| B26 | 037982601 | 02:20:34.8 | -03:28:50.4 | 14.7 | 14.6 | 8.3 | -2.13 | +0.53 | 2 |
| B27 | 037982701 | 02:21:14.8 | -03:08:49.1 | 16.3 | 16.2 | 10.7 | -1.60 | +1.07 | 2 |
| B28 | 147110101 | 02:21:55.1 | -02:49:02.4 | 11.4 | 11.6 | 9.1 | -1.60 | +0.00 | 2 |
| B29 | 147110201 | 02:20:35.1 | -02:49:00.1 | 10.6 | 10.6 | 8.2 | -1.60 | +0.00 | 2 |
| B30 | 147111301 | 02:21:15.1 | -05:09:00.7 | 12.4 | 12.5 | 9.9 | -1.07 | +0.53 | 1 |
| B31 | 147111401 | 02:20:36.3 | -05:28:59.5 | 10.8 | 11.0 | 8.4 | -0.53 | +0.53 | 1 |
| B32* | 147111501 | 02:21:56.0 | -05:28:56.4 | not used | -3.20 | +0.53 | 1 | ||
2.2 Processing and Xamin output source parameters
Photon images in different energy bands are then created with a scale of 25 pixel-1. Images from the three detectors (pn, MOS1, M0S2), pertaining to the same band, are co-added. The resulting image is in turn filtered in wavelet space222à trou algorithm, combined with a Poisson noise model; see Starck & Pierre (1998) to remove the noise at a given significance level and subsequently scanned by a source detection algorithm set to a low threshold to obtain a primary source list. Detailed properties of each detected source are further assessed from the individual photon images using Xamin, a maximum likelihood profile fitting procedure333the likelihood is computed with respect to a flat image designed for the XMM-LSS survey. The specific goal of this second pass is to monitor in a clean and systematic way the characterization of extended X-ray sources and associated selection effects. The principle and performances of Xamin, for extended and point-like sources, are described in detail by Pacaud et al. (2006) and we recall here the main lines of the procedure. Basically, for each source, two spatial emission models convolved by the XMM Point Spread Function (PSF) are tested: (pnt) a point source and (ext) a -profile assuming a constant slope of 2/3. The main parameters returned are the position and the fitted countrates and, for model ext, the best estimate of the core radius of the -model. Further, for each model, the likelihood444The values actually provided are the natural logarithm of the likelihoods but, to follow the widely spread usage, we shall call them simply “likelihood” throughout the paper. We refer to Pacaud et al. (2006, Sec. 2.3.1) for clarification of this terminology issue. of the source is computed, as well as the likelihood of the extension for model ext. The fits are simultaneously performed on the pn and on the MOS1+MOS2 sum images only requiring the source centre to be the same in both images555In the case of model ext, an additional fitting condition imposes that the core radii inferred from the pn and MOS1+MOS2 images are the same. The procedure takes into account all main technical characteristics such as: the blurring of the PSF and the vignetting as a function of off-axis angle and photon energy, the gaps between the CCD of the pn and MOS arrays, and the various background contributions. Results of the ext fit allow us to define two classes of extended objects in the Xamin parameter space: the C1 and C2 classes (see Sec. 2.3.4). Table 2 summarises the output parameters of the pipeline. Table 3 provides the background level, averaged over all pointings included in the present catalogue. The measurements were performed on the X-ray images (obtained after removing bad time intervals) by masking the detected source regions, for three ranges of off-axis distance. We recall that the background consists of two components: (1) the cosmic background which is affected by the vignetting and (2) the particle background, which is significant at high energy and not affected by the vignetting. As a rule of thumb, a point-like source detected with 15 net photons in any of the 3 rings shows a signal to noise ratio of 3.6 and 3.3 for the [0.5-2] and [2-10] keV bands respectively (when considering a circular aperture having a radius of 10″).
See Pacaud et al. (2006) for the statistical definition of the derived likelihood values
Notes: a computed for both point-like and extended profile fits,
b issued for each of the three EPIC detectors.
| Parameter | Notes | Content |
|---|---|---|
| CUTRAD | Size of the fitting box | |
| EXP | b | Mean exposure time in the box |
| GAPFLAG | b | Distance to nearest CCD gap |
| GAP_NEIGHBOUR | Distance to nearest detected neighbour | |
| in the fitting box | ||
| EXT | Best fit core radius | |
| EXT_LH | Extension likelihood | |
| DET_LH | a | Detection likelihood |
| X_IMA,Y_IMA | a | Best fit position in pixel |
| RA,DEC | a | Best fit sky coordinates |
| RATE_MOS | a | EPIC-MOS count rate |
| RATE_PN | a | EPIC-pn count rate |
| SCTS_MOS | a | Estimated source counts in MOS1+2 |
| SCTS_PN | a | Estimated source counts in pn |
| BG_MAP_MOS | a | Background level in MOS1+2 |
| BG_MAP_PN | a | Background level in pn |
| PIX_DEV | a | Distance between input/output position |
| N_ITER | a | Number of iterations in the fit |
| Off-axis | [0.5-2] keV | [2-10] keV |
|---|---|---|
| 0′- 5′ | 7.1 | 12.7 |
| 5′- 10′ | 6.3 | 12.4 |
| 10′- 13′ | 5.8 | 12.2 |
2.3 Source list description
In this paper, we present the source lists for two bands, [0.5-2] and [2-10] keV, named B and CD respectively. Tables 9 and 10 display the parameters we make available: in addition to the Xamin output, a number of parameters are a posteriori calculated in order to facilitate the interpretation of the data set. In its present state, Xamin does not perform error calculations. Mean statistical errors were estimated by means of extensive simulations. Pacaud et al. (2006) presented a detailed account of uncertainty estimates for the extended sources (count rate and core radius). In the present paper, further error information is provided for the point source population; we note that only the first 2 digits are to be considered significant for the count rate and for the core radius as well as for the derived quantities.
2.3.1 Thresholds
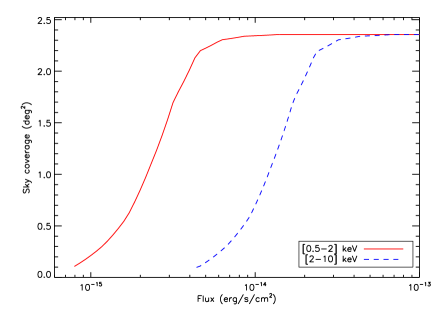
Xamin processes sources only out to an off-axis distance of 13′ by applying a detection mask centred on the mean optical axis of the 3 telescopes, considering in this way only sources that are visible by the 3 detectors. The total geometrical area of the present catalogue corresponding to the validated pointings indicated on Fig. 1 amounts to 5.5 . The present version of the B and CD band catalogues contains the extended sources identified as C1 and C2 (see Sec. 2.3.4) to which are added sources having a point source detection likelihood () greater than 15 (so-called non-spurious). As shown in Fig. 2, this ensures a 90% completeness limit of 4 in the B band within an off-axis distance of 10′ for the 10ks pointings (beyond 10′, the sensitivity falls below 50% of the value at the centre); in average, this corresponds to 85 and 70 sources per 20 ks and 10 ks pointing respectively, judged to be real within the inner 13′.
2.3.2 Countrate and Flux
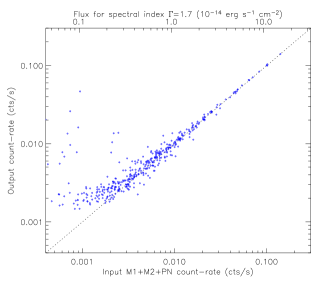
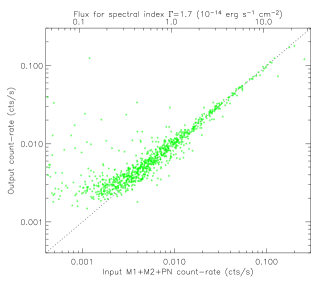
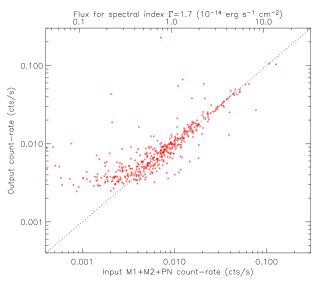
Xamin fits the MOS and pn count-rates independently666while the source position and extent are fixed to be the same for the 3 detectors (assuming that the two MOS have the same response). We performed a number of point source tests by simulating a set of 30 images in which the logN-logS distribution was injected. We display in Fig. 3 the full range of simulations detailing the photometric accuracy out to an off-axis distance of (Pacaud et al. 2006, presented averaged performances). The Eddington bias is obvious for faint sources and increases with the off-axis distance; in particular the photometry appears to be unreliable for a number of sources detected with a total count-rate (pn+MOS1+MOS2) between 0.002 and 0.005 count/s at off-axis angle . These sources are however detected with a likelihood greater than 15, indicating that they are real. They are thus left in the public source catalogue but their photometry should be handled with caution. Mean values for the photometric bias and accuracy are summarized in table 4.
| Band | B | CD |
|---|---|---|
| Countrate (count/s) | b, e | b, e |
| off-axis | ||
| 9, 21 | 9, 22 | |
| 7, 15 | 8, 16 | |
| 6, 12 | 6, 12 | |
| 4, 8 | 4, 8 | |
| 1, 4 | 1, 4 | |
| off-axis | ||
| 10, 26 | 11, 30 | |
| 9, 19 | 9, 21 | |
| 7, 15 | 5, 11 | |
| 5, 10 | 2, 5 | |
| 2, 5 | 1.3 | |
| off-axis | ||
| - | - | |
| 10, 24 | 11, 29 | |
| 9, 19 | 9, 21 | |
| 6, 13 | 7, 14 | |
| 3, 7 | 3, 7 |
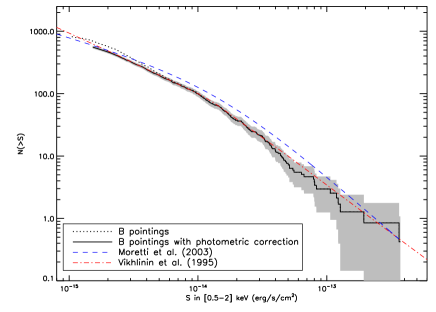
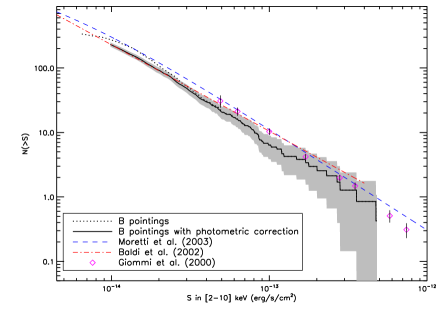
Count-rate values are in turn converted into fluxes assuming a standard power law spectrum (photon index of 1.7) and the mean value of the region ( cm-2). The Energy Conversion Factors are given in Table 5. The observed logN-logS distributions are presented in Fig. 4; they are in good agreement with the Vikhlinin et al. (1995) (ROSAT), Moretti et al. (2003) (ROSAT, Chandra and XMM), Baldi et al. (2002) (XMM) and Giommi et al. (2000) (BeppoSAX) data points.
| Detector | B band | CD band |
|---|---|---|
| MOS | 5.0 | 23 |
| pn | 1.5 | 7.9 |
Note that the resulting pn and MOS fluxes may be quite different for some sources. In most of the cases this is due to the fact that part of the source is occulted by a CCD gap in one of the detectors to the point where the information is not recoverable. Such cases can be identified from the gap-related columns (Tables 2 and 9) and it is suggested to use the fitted parameters obtained from the detectors on which the source is not affected by a gap (if any). For the sake of simplicity, a single mean flux value is provided ([FLUX(MOS)+FLUX(pn)]/2)777as the MOS countrate is about 1/3 of the pn countrate for cluster spectra, the averaged MOS flux involves a number of photons comparable to that of the pn, thus justifying the simple mean along with column fluxflag indicating the difference between the fluxes inferred from the MOS1+MOS2 combination and the pn (0: less than 20%; 1: between 20-50%; 2: greater than 50%). For the two single-band catalogues, the sources are roughly equally distributed between the three categories of flux quality. Fluxes assuming a thermal spectrum as well as temperature and luminosity information for the extended sources classified as C1 and C2, confirmed as clusters, can be found in the XMM-LSS cluster database888http://l3sdb.in2p3.fr:8080/l3sdb/.
2.3.3 Positional accuracy and astrometric corrections
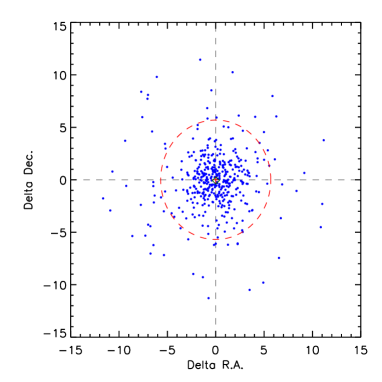
The positional accuracy for the point source population was also estimated from the simulations. Results are displayed in Fig. 5 and summarised in Table 6. We recall here that for the point-like fit, as explained by Pacaud et al. (2006), positions are fixed to those of the first pass catalogue (Sextractor detections on the wavelet filtered image).
| Band | B | CD |
| Countrate (count/s) | Error (′′) | Error (′′) |
| off-axis | ||
| 2.0 | 2.0 | |
| 1.7 | 1.7 | |
| 1.3 | 1.3 | |
| 0.8 | 0.8 | |
| off-axis | ||
| 2.0 | 2.0 | |
| 1.8 | 1.9 | |
| 1.5 | 1.5 | |
| 1.0 | 1.0 | |
| off-axis | ||
| - | - | |
| 1.9 | 2.0 | |
| 1.6 | 1.7 | |
| 1.2 | 1.3 |
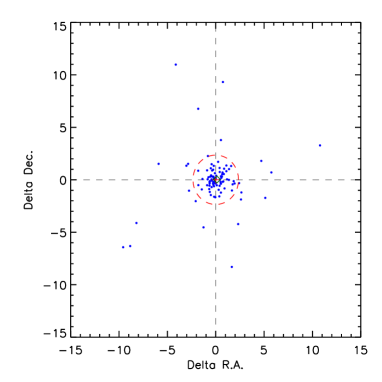
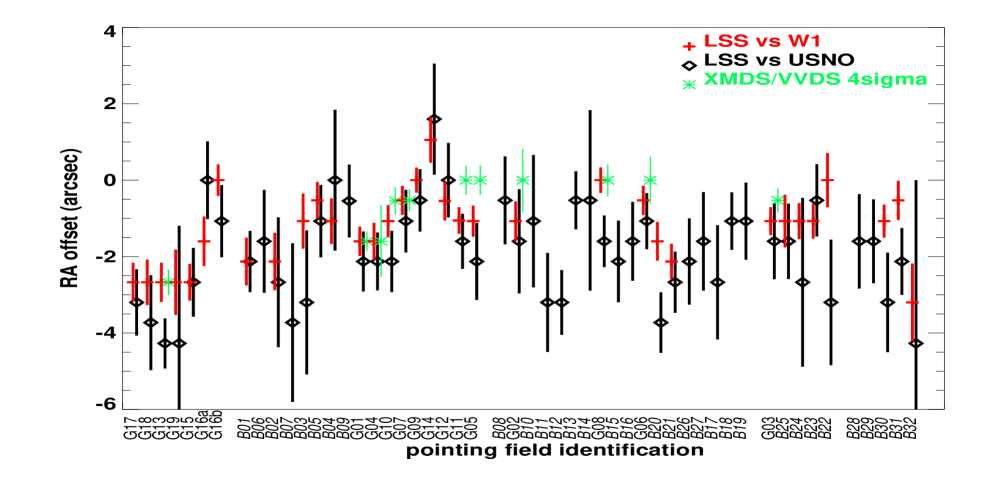
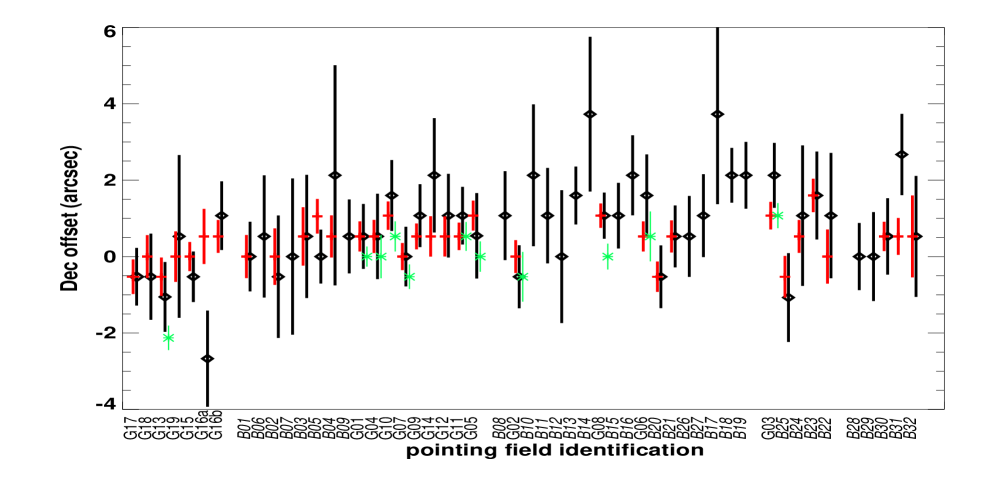
In parallel, in order to compensate for possible inaccuracies in the XMM pointing positions, a global rigid astrometric correction was estimated using the SAS task eposcorr. We generated, for each XMM pointing, a reference X-ray list with all “non spurious” point-like sources along with a reference optical list containing all CFHTLS W1 objects within 6″ of the X-ray objects, being brighter than and having a ”good” or ”fair” chance probability as defined in Sec. 3.3 (in the case where an X-ray source had more than one optical counterpart candidates, we retained only the one with the smallest chance probability). For the three topmost rows of XMM pointings in Fig. 1, for which the CFHTLS data were not yet processed, the optical list was made from the USNO-A2 catalogue. The reference files were fed into eposcorr using the parameter maxsig=2 to force removal of spurious matches. The offsets computed by eposcorr are plotted in Fig. 7. Offsets computed using USNO-A2 and CFHTLS objects are usually compatible within errors (with the nominal eposcorr errors being larger in the USNO-A2 case). The offsets given in Table 1 were applied to all coordinate sets for each source in the database. The database column Xastrocorr indicates whether the origin of the astrometric correction is the CFHTLS W1 or the USNO-A2 catalogue. Astrometrically corrected positions are used in the subsequent operations: removal of the redundant sources, source naming and cross-identification with the optical catalogue. Simulations of pairs of point sources separated by 20″ show that 67% of the pairs are resolved for sources having 30 photons each; all pairs being resolved when the sources contain 500 photons. As shown by Pacaud et al. (2006), a detection likelihood threshold of 15 eliminates almost all spurious detections (the corresponding contamination level is 1%).
2.3.4 Extended source classification
Pacaud et al. (2006) and Pierre et al. (2006) presented in detail the criteria for defining galaxy cluster candidates. The selection is performed in the Xamin output parameter space obtained in the soft band. This band presents the highest signal to noise ratio (S/N) at any redshift for typical cluster spectra (as well as for galaxy thermal halos) thus ensuring the highest completeness level for the extended source detection. The cluster candidate sample consists of two classes:
- The C1 class is defined such that no point sources are misclassified as extended and is described by extent , likelihood of extent and likelihood of detection999for the ext fit . Note that while the C1 class is meant to be uncontaminated in terms of point-like sources, it contains a few nearby galaxies whose X-ray emission is unambiguously extended (Pacaud et al. submitted).
- The C2 class is described by extent and likelihood of extent (no condition on the likelihood of detection) and typically displays a contamination rate of 50%.
There are 73 C1 & C2 objects flagged in the catalogue, column Bc1c2. Note that, for the unique purpose of band merging (see below), a similar classification has been applied in the hard band. In this band, there are only 21 sources flagged as C2 and 1 flagged as C1, which are not detected in the soft one. Subsequent X-ray/optical inspection of these latter sources does not reveal, as expected, any new cluster. They are mostly weak sources at extreme off-axis angle, or unresolved doubles, or cluster X-ray centroids displaced by more than 6″ from the soft band position.
2.3.5 Band merging
Because X-ray colours serve as a useful piece of information for numerous science studies, we provide, in addition to the individual catalogues, the two-band merged catalogue. Band merging is a delicate operation given the rather large XMM PSF (FWHM at 1 keV on axis) and its variation with energy and off-axis distance. It may also happen that a close pair is resolved in one band only, because of too low a photon number in the other band. In order to provide the community with an efficient and reliable tool, the construction of the merged catalogue received special attention and is described below.
As an X-ray source can be detected in one or two bands and, for each band, is independently fitted by the extended and point source models with the coordinates free, we adopt the following merging procedure. For each band, a source is classified as extended (E) if it satisfies extent and likelihood of extent (i.e. C1 or C2 class); if not, it is classified as point-like (P). Then, pointing per pointing, we flag associations between the 2 bands within a search radius of 6″. Note that we allow associations involving spurious sources () at most in one band. We kept the information (rate, flux, etc.) about entries below this threshold in the merged catalogue, since it could be more useful (e.g. for upper limits) than no information at all, but we flag those cases with Bspurious=1 or CDspurious=1. Finally, for each soft-hard couple in the merged catalogue, we define the best band, i.e. the band in which the detection likelihood of the source is the highest and from which the coordinates are taken. Details of the merging process are summarised in Table 7.
Starting from 2980 non-spurious sources in the soft band and 1255 non-spurious sources in the hard band, the resulting merged catalogue contains 3385 sources: out of them 50.5% are detected as point-like in the soft band only, 36.3% as point-like in both bands, 10.2% as point-like in the hard band only; 2.1% are candidate clusters of galaxies (soft band only). The remaining 0.8% are mostly borderline cases (cf end of Sec. 2.3.4). We note that in an extremely limited number of cases (4 couples of entries) the merging process gives ambiguous results, i.e. a detection in one band can be associated with two different detections in the other band. The flagging and naming of such cases is described in Sec. 2.3.7.
A source is defined as extended (E) in a given band if it satisfies extent and likelihood of extent in this band. Otherwise it is defined as point-like (P).
For all sources, but the C1 clusters of galaxies, flux is computed from the ECF factors given in Table 5 using the point source rates.
For the C1 clusters, the fluxes are set to -1 as the reader is addressed to the XMM-LSS cluster database (spatial and spectral fitting providing accurate flux and luminosity measurements)
The numbers in [] indicate the number of spurious sources encountered in the inter-band associations (the counterpart in and B or CD is flagged as spurious i.e. has )
| B band | CD band | best band | Coordinates from | Flux in B | Flux in CD | # of sources |
|---|---|---|---|---|---|---|
| E | undetected | B | B E_fit | -1 for C1, flux for C2 | -1 | 59 |
| P | undetected | B | B P_fit | flux | -1 | 1710 |
| undetected | E | CD | CD E_fit | -1 | flux | 22 |
| undetected | P | CD | CD P_ it | -1 | flux | 347 |
| E | E | where detlik_ext is max | best band E_fit | -1 for C1, flux for C2 | -1 for C1, flux for C2 | 2 |
| E | P | where detlik_ext is max | best band E_fit | -1 for C1, flux for C2 | -1 for C1, flux for C2 | 12 [4 CD] |
| P | E | where detlik_pnt is max | best band P_fit | flux | flux | 5 |
| P | P | where detlik_pnt is max | best band P_fit | flux | flux | 1228 [36 B, 358 CD] |
For all entries we provide in the database the distance between the positions found by Xamin in the two energy bands (which in most cases could be used to solve the above ambiguities). Such an inter-band distance, for all the cases present in both bands, except for the few ambiguities, is within 2″ in 35% of the cases, within 4″ in 79% and above 5″ only in 9%. These percentages change to 39%, 83% and 7% if we exclude detections flagged as spurious in one band. If we compare the inter-band distance with the combination of the position errors computed according to the prescription in Table 6, we have that in 64% of the cases the inter-band distance is less than the error, in 1.4% of the cases is above .
2.3.6 Removal of redundant sources
Finally, in the case of redundant objects detected in the regions where the pointings overlap, we keep in the catalogues only the detection pertaining to the pointing where the source is the closest to the optical centre (cf columns Boffaxis, CDoffaxis in Table 9). Except for a few ambiguous cases described in Section 2.3.7, a value of 6″ is found to be the adequate search radius to identify redundant detections. In this way, 280 doublets and a few triplets were identified and reduced to a single source.
2.3.7 Source naming
Objects in the merged catalogue are labelled following the IAU-style convention, i.e. XLSS Jhhmmss.s-ddmmss. The coordinates used in assigning the name are the ones deduced after the rigid astrometric correction, and chosen as official, i.e. those for the best band (see Table 7).
In the individual band catalogues, the sources are assigned supplementary names, following the same standard - XLSSx JHHMMSS.S-DDMMSS - where x is B or CD and stands for the B and CD bands respectively. In this case, the coordinates correspond to the extended (E) or point-like (P) fit in the relevant band (Table 7). As a consequence of the merging procedure (Sec.2.3.5), the XLSS coordinate designation will coincide with one of the XLSSB or XLSSCD (i.e. for the best band).
In a limited number of cases (8 entries), a source in a band happens to be associated with two different objects in the other band. These couples of catalogue entries are flagged by a non-zero value in column Xlink, the registered value being a pointer to the other “ambiguous” entry in the couple. For those cases, the ambiguity in the XLSS name is resolved (when necessary, i.e. in 6 out of 8 cases) by the addition of a suffix : the two members of a couple will appear as XLSS JHHMMSS.S-DDMMSSa and XLSS JHHMMSS.S-DDMMSSb.
3 Associated data products
3.1 X-ray images
For each pointing, we make available - via the XMM-LSS database in Milan- the following images in FITS format. They are accessible as “data products” : for every source in the catalogue, a clickable link points to the images of the relevant pointings.
- The B and CD band photon images for the 3 detectors (after the event filtering).
- Exposure maps for the 3 detectors and the 2 bands. All images have a pixel size of 2.5′′. Note that the World Coordinate System (WCS) of the X-ray images is the one generated by the SAS, therefore it does not take into account the astrometric correction described in section 2.3.3 and quoted in Table 1. Consequently when overlaying X-ray source positions exactly on the X-ray images, one should use the coordinates labelled as “raw” in Table 9, although this does not make much difference for most of the sources, given the pixel size.
3.2 Optical data
For each X-ray source of the merged catalogue, we provide:
(i) the list of optical objects within a radius of 6′′ around each X-ray source, extracted from the CFHTLS catalogue101010currently, from the T0003 W1 field release by Terapix: http://terapix.iap.fr/. These data are available in the XMM-LSS database in Milan only, through the XLSSOPT table. Queries on X-ray lists are allowed and return the magnitudes and further optical information derived from the Terapix merged panchromatic catalogues.
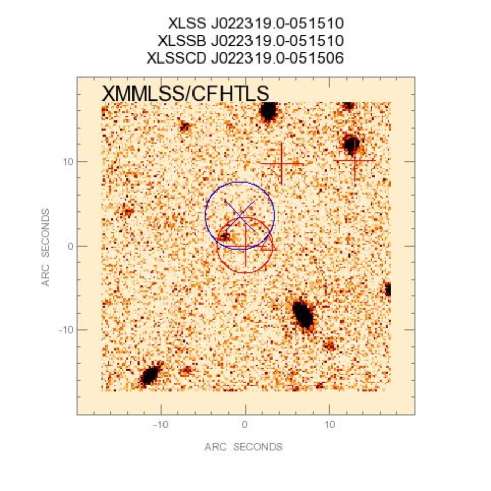
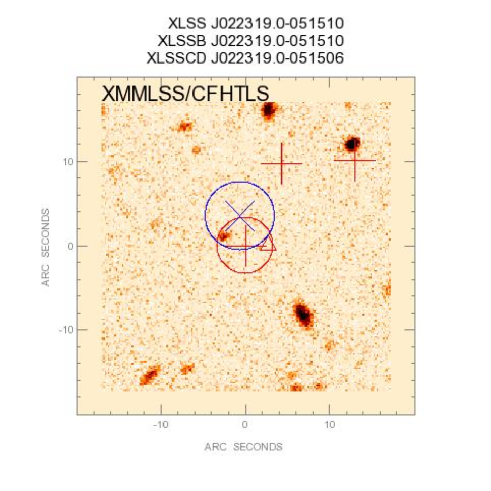
(ii) CFHTLS postage stamp images in the and bands (PNG format); in the case where a CFHTLS image is not yet processed, we provide a low exposure CFH12K image when available. An example is shown on Fig 6.
3.3 A few statistics
Out of our 3385 X-ray sources, 2208 have at least one optical candidate closer than 6″ , 1071 fall in the area without CFHTLS coverage111111observed, but currently still under processing (corresponding to the topmost three rows of XMM pointings in Fig. 1), while 106 have no optical association. The total number of associated optical objects is 6275 (the radius used here is 6 arcsec irrespective of the fact the object is extended or point-like). A total of 472 X-ray sources have a single candidate within 6″ , 613 have two and the rest has more. The number of optical counterparts brighter than is 1990 of which 55%, 36%, 14% are closer than respectively 3″, 2″, 1″ to an X-ray source (detected in any band). If we consider only the soft (B) band sources the numbers are 1826, 56%, 37%, 14% respectively, while for hard (CD) band sources they are 1094, 59%, 40%, 17%.
We further provide the distance between the X-ray and optical positions as well as an estimate of the probability of chance coincidence
where is the sky density of optical objects having an magnitude brighter than the magnitude of the candidate counterpart, computed from the full CFHTLS W1 catalogue. Defining as “good” or “fair”, respectively, the X-ray/optical matches having and (as described by Chiappetti et al. (2005)), we find 945 good associations and 637 fair ones. All the optical objects brighter than and within 1″ and 87% of those within 2″ have a good probability, while for a distance within 3″ the percentage lowers to 69% for soft sources and 73% for hard sources.
4 Summary of online availability
| Data sets | Location | Address | |
|---|---|---|---|
| Merged XLSS catalogue, main parameters | CDS | http://cdsweb.u-strasbg.fr/cgi-bin/qcat?J/MNRAS/vol/pag | |
| Single-band catalogues: | XLSSB, XLSSCD | Milan | http://cosmos.iasf-milano.inaf.it/lssadmin/Website/LSS/Query |
| Merged catalogue (all parameters): | XLSS | ||
| X-ray images | |||
| Optical catalogue : | XLSSOPT | ||
| Optical postage stamps | |||
Online data access is summarised in Table 8. Namely, we provide :
-
•
The raw Xamin results in individual catalogues for the B [0.5-2] keV and CD [2-10] keV bands. Only sources above a detection likelihood of 15 are made available. Redundant sources detected in overlapping regions of different pointings are removed; data from the pointing where each object has the smallest off-axis angle are retained in the catalogue. In addition, fluxes assuming a power law spectrum are provided for each point-like source.
-
•
The B-CD band merged catalogue assuming a correlation radius of 6″. This required the definition of the best band from which a number of parameters, such as the position, are taken and, hence, a selection of information from the single band catalogues. Source counterparts in the other band are made available even if they have a detection likelihood below 15 .
-
•
Optical: panchromatic CFHTLS catalogue within 6″of each source of the merged catalogue as well as i’ and g’ band png images.
The main parameters (listed in Tables 9 and 10) of the merged X-ray catalogue are available in electronic form at the Centre de Données de Strasbourg (CDS). The single-band and band-merged catalogues with all columns, as well as the associated data products (X-ray images and optical information) are accessible, with fully interactive selection, through the XMM-LSS database located in Milan and described by Chiappetti et al. (2005). User login details can be found in the entry web page.
5 Future
From now on, the XMM-LSS catalogue and associated data sets will be regularly incremented following the receipt of new XMM and CFHTLS pointings. In parallel, Xamin is being upgraded with the inclusion of information on the photon energy for the source characterization, in such a way as to better discriminate between AGN and cluster sources. When the new version is validated, we foresee reprocessing the entire data set and making it publicly available with the corresponding documentation.
Acknowledgments
The results presented here are based on observations obtained with XMM-Newton, an ESA science mission with instruments and contributions directly funded by ESA Member States and NASA. The cluster optical images were obtained with MegaPrime/MegaCam, a joint project of CFHT and CEA/DAPNIA, at the Canada-France-Hawaii Telescope (CFHT) which is operated by the National Research Council (NRC) of Canada, the Institut National des Sciences de l’Univers of the Centre National de la Recherche Scientifique (CNRS) of France, and the University of Hawaii. This work is based in part on data products produced at TERAPIX and the Canadian Astronomy Data Centre as part of the Canada-France-Hawaii Telescope Legacy Survey, a collaborative project of NRC and CNRS. AG acknowledges support from Centre National d’Etudes Spatiales. The Italian members of the team acknowledge financial contribution from contract ASI-INAF I/023/05/0. AD, OG, EG, PGS and JS acknowledge support from the ESA PRODEX Programme ”XMM-LSS”, and from the Belgian Federal Science Policy Office for their support. HQ acknowledges partial support from the FONDAP Centro de Astrofisica. PG is a Fellow of the Japan Society for the Promotion of Science.
References
- Baldi et al. (2002) Baldi A., Molendi S., Comastri A., Fiore F., Matt G., Vignali C., 2002, ApJ, 564, 190
- Chiappetti et al. (2005) Chiappetti L. et al., 2005, A&A, 439, 413
- Gandhi et al. (2006) Gandhi P. et al., 2006, A&A, 457, 393
- Giommi et al. (2000) Giommi P., Perri M., Fiore F., 2000, A&A, 362, 799
- Moretti et al. (2003) Moretti A., Campana S., Lazzati D., Tagliaferri G., 2003, ApJ, 588, 696
- Pacaud et al. (2006) Pacaud F. et al., 2006, MNRAS, 372, 578
- Pierre et al. (2006) Pierre M. et al., 2006, MNRAS, 372, 591
- Pierre et al. (2004) Pierre M. et al., 2004, Journal of Cosmology and Astro-Particle Physics, 9, 11
- Pratt & Arnaud (2002) Pratt G. W., Arnaud M., 2002, A&A, 394, 375
- Starck & Pierre (1998) Starck J.-L., Pierre M., 1998, A&AS, 128, 397
- Vikhlinin et al. (1995) Vikhlinin A., Forman W., Jones C., Murray S., 1995, ApJ, 451, 553
| Column name | units | meaning and usage | X | m | o | C |
|---|---|---|---|---|---|---|
| Bseq or CDseq | – | internal sequence number (unique) | X | X | X | |
| Bcatname or CDcatname | – | IAU catalogue name XLSSx Jhhmmss.s-ddmmss, x=B or CD | X | X | X | |
| Xseq | – | pointer to merged entry see Table 10 | X | X | X | |
| Xcatname | – | pointer to merged entry see Table 10 | X | X | X | |
| Xfield | – | XMM pointing 1-32 for B01-B32 1001-1019 for G01-G19 | X | |||
| expm1 | s | MOS1 camera exposure in the band | X | |||
| expm2 | s | MOS2 camera exposure in the band | X | |||
| exppn | s | pn camera exposure in the band | X | |||
| gapm1 | ″ | MOS1 distance to nearest gap | X | |||
| gapm2 | ″ | MOS2 distance to nearest gap | X | |||
| gappn | ″ | pn distance to nearest gap | X | |||
| Bnearest or CDnearest | ″ | distance to nearest detected neighbour | X | X | ||
| Bc1c2 | 0—1—2 | 1 for class C1, 2 for C2, 0 for undefined | X | X | X | |
| CDc1c2 | 0—1—2 | 1 for class C1, 2 for C2, 0 for undefined | ||||
| Bcorerad or CDcorerad | ″ | core radius EXT (for extended sources) | X | X | X | |
| Bextlike or CDextlike | – | extension likelihood EXT_LH | X | X | X | |
| Bdetlik_pnt or CDdetlik_pnt | – | detection likelihood DET_LH for pointlike fit | X | |||
| Bdetlik_ext or CDdetlik_ext | – | detection likelihood DET_LH for extended fit | X | |||
| Boffaxis or CDoffaxis | ′ | off-axis angle | X | X | ||
| Brawra_pnt or CDrawra_pnt | degrees | source RA (not astrometrically corrected) for pointlike fit | X | |||
| Brawdec_pnt or CDrawdec_pnt | degrees | source Dec (not astrometrically corrected) for pointlike fit | X | |||
| Brawra_ext or CDrawra_ext | degrees | source RA (not astrometrically corrected) for extended fit | X | |||
| Brawdec_ext or CDrawdec_ext | degrees | source Dec (not astrometrically corrected) for extended fit | X | |||
| Bra_pnt or CDra_pnt | degrees | source RA (astrometrically corrected) for pointlike fit | X | |||
| Bdec_pnt or CDdec_pnt | degrees | source Dec (astrometrically corrected) for pointlike fit | X | |||
| Bra_ext or CDra_ext | degrees | source RA (astrometrically corrected) for extended fit | X | |||
| Bdec_ext or CDdec_ext | degrees | source Dec (astrometrically corrected) for extended fit | X | |||
| Bposerr or CDposerr | ″ | error on coordinates according to Table 6 | X | X | ||
| Bratemos_pnt or CDratemos_pnt | cts/s | MOS count rate for pointlike fit | X | |||
| Bratepn_pnt or CDratepn_pnt | cts/s | pn count rate for pointlike fit | X | |||
| Bratemos_ext or CDratemos_ext | cts/s | MOS count rate for extended fit | X | |||
| Bratepn_ext or CDratepn_ext | cts/s | pn count rate for extended fit | X | |||
| countmos_pnt | cts | MOS number of counts for pointlike fit | X | |||
| countpn_pnt | cts | pn number of counts for pointlike fit | X | |||
| countmos_ext | cts | MOS number of counts for extended fit | X | |||
| countpn_ext | cts | pn number of counts for extended fit | X | |||
| bkgmos_pnt | cts/pixel | MOS local background for pointlike fit | X | |||
| bkgpn_pnt | cts/pixel | pn local background for pointlike fit | X | |||
| bkgmos_ext | cts/pixel | MOS local background for extended fit | X | |||
| bkgpn_ext | cts/pixel | pn local background for extended fit | X | |||
| Bflux or CDflux | erg/cm2/s | source flux (undefined i.e. -1 for extended) | X | X | ||
| Bfluxflag or CDfluxflag | 0 to 2 | 0 if MOS-pn difference , 1 between 20%-50%, 2 above 50% | X | X |
| Column name | units | meaning and usage | X | m | o | C |
|---|---|---|---|---|---|---|
| Xseq | – | Internal sequence number (unique) | X | X | X | |
| Xcatname | – | IAU catalogue name XLSS Jhhmmss.s-ddmmssc, see Sec. 2.3.7 | X | X | X | |
| Bspurious and CDspurious | 0 or 1 | set to 1 when soft/hard component has DET_LH | X | |||
| Bdetlike and CDdetlike | – | detection likelihood EXT_LH (pnt or ext according to source class) | X | X | X | |
| Xra | degrees | source RA (astrometrically corrected) (pnt or ext according to source class and in best band) | X | X | X | |
| Xdec | degrees | source Dec (astrometrically corrected) (pnt or ext according to source class and in best band) | X | X | X | |
| Bra and CDra | degrees | source RA (astrometrically corrected) (pnt or ext according to source class) | X | X | X | |
| Bdec and CDdec | degrees | source Dec (astrometrically corrected) (pnt or ext according to source class) | X | X | X | |
| Xbestband | 2 or 3 | band with highest likelihood : 2 for B, 3 for CD | X | |||
| Xastrocorr | 1 or 2 | astometric correction from CFHTLS (1) or USNO (2) | X | |||
| Xmaxdist | ″ | distance between B and CD positions | X | |||
| Xlink | – | pointer to Xseq of secondary association, see Sec. 2.3.7 | X | |||
| Bratemos and CDratemos | cts/s | MOS count rate (pnt or ext according to source class) | X | X | X | |
| Bratepn and CDratepn | cts/s | pn count rate (pnt or ext according to source class) | X | X | X |
| Column name | units | meaning and usage | Terapix |
|---|---|---|---|
| Oseq | – | internal sequence number (unique) | n/a |
| Oid | – | original Terapix id in field | id |
| Ofield | – | CFHTS field identification in form | n/a see caption |
| Ora | degrees | RA of the optical candidate | ra |
| Odec | degrees | Declination of the optical candidate | dec |
| Oflag | – | binary flag combining 0/1 galaxy/star, 0/4 normal/masked, 0/8 normal/saturated | flag |
| Ou | magnitude | magnitude | u |
| Og | magnitude | magnitude | g |
| Or_ | magnitude | magnitude | r |
| Oi | magnitude | magnitude | i |
| Oz | magnitude | magnitude | z |
| Ou_e | magnitude | error on magnitude | uerr |
| Og_e | magnitude | error on magnitude | gerr |
| Or_e | magnitude | error on magnitude | rerr |
| Oi_e | magnitude | error on magnitude | ierr |
| Oz_e | magnitude | error on magnitude | zerr |
| distance | ″ | distance from the X-ray corrected position to the optical position | n/a |
| prob | – | chance probability of X-ray to optical association (see text) | n/a |