Phase diagram of randomly pinned vortex matter in layered superconductors: dependence on the details of the point pinning
Abstract
We study the thermodynamic and structural properties of the superconducting vortex system in high temperature layered superconductors, with magnetic field normal to the layers, in the presence of a small concentration of strong random point pinning defects via numerical minimization of a model free energy functional in terms of the time-averaged local density of pancake vortices. Working at constant magnetic induction and point pinning center concentration, we find that the equilibrium phase at low temperature () and small pinning strength () is a topologically ordered Bragg glass. As or is increased, the Bragg glass undergoes a first order transition to a disordered phase which we characterize as a “vortex slush” with polycrystalline structure within the layers and interlayer correlations extending to about twenty layers. This is in contrast with the pinned vortex liquid phase into which the Bragg glass was found to melt, using the same methods, in the case of a large concentration of weak pinning centers: that phase was amorphous with very little interlayer correlation. The value of the second moment of the random pinning potential at which the Bragg glass melts for a fixed temperature is very different in the two systems. These results imply that the effects of random point pinning can not be described only in terms of the second moment of the pinning potential, and that some of the unresolved contradictions in the literature concerning the nature of the low and high phase in this system are likely to arise from differences in the nature of the pinning in different samples, or from assumptions made about the pinning potential.
pacs:
74.25.Qt, 74.72.Hs, 74.25.Ha, 74.78.BzI Introduction
The effects of random point pining on the properties of vortex matter in high-temperature superconductors have been extensively investigated review in a large number of experimental, theoretical, and numerical studies. However, many questions about the phase diagram of this system remain controversial. The existence of a topologically ordered Bragg glass (BrG) phase natt ; giamarchi with long-range bond-orientational order and power-law decay of translational correlations at low temperatures and low fields in systems with weak pinning has been experimentally established klein . The BrG phase melts into a disordered vortex liquid (VL) as the temperature is increased. It also becomes unstable as the pinning strength is increased (or equivalently, the magnetic field is increased for a fixed amount of pinning) with the temperature held fixed at a low value. There is no consensus at present about the nature of the phase into which the BrG transforms under these conditions. The theoretical proposal mpa ; ffh of the existence of a vortex glass (VG) with long-range coherence of the superconducting phase and divergent barriers for the motion of vortex lines in the limit of zero current has received support from many experiments vglexp ; zeldov1 ; zeldov2 . However, other experimental studieslobb have questioned the the existence of a VG phase thermodynamically distinct from the high-temperature VL. Different numerical studies bokil ; olsson ; lidmar ; nh have also reached different conclusions about the existence of the VG phase.
The possible existence of other disordered phases, distinct from the VL and VG phases mentioned above, has also been suggested in several studies. One of these phases is the “vortex slush” (VS) – a disordered, liquid-like phase with no superconducting phase coherence that is distinguished from the VL in that the translational correlation length in this phase is substantially larger than that in the VL. The existence of this phase in superconductors with random point pinning has been predicted theoretically slush_th1 ; slush_th2 and several experimental studies slush1 ; slush2 ; slush3 have presented evidence for the occurrence of a first-order transition between VL and VS phases (followed by a continuous transition from the VS to the VG phase) as the temperature is decreased at fixed magnetic field. A numerical study nh has also provided evidence for the existence of the VS phase, although the validity of this evidence for macroscopic systems has been questioned in later work teitel .
Another glassy phase proposed to exist in both high-temperature and conventional superconductors with random point pinning is the “multidomain glass” (MG) banerjee ; gautam in which the vortices are supposed to form crystalline domains with typical size substantially larger than the translational correlation length in the VL phase. In this MG phase, the vortex positions do not exhibit any long-range translational or orientational order and there is no superconducting phase coherence. It has been argued banerjee ; gautam that a variety of interesting “glassy” behavior observed banerjee near the melting transition of the BrG phase may be explained by assuming that a small sliver of MG phase exists between the BrG and VL phases, so that the BrG first transforms to the MG phase as the temperature is increased, and then the MG melts into the VL at a slightly higher temperature. Results of recent muon-spin-rotation experiments divakar ; menon2 have been interpreted as evidence for the occurrence of vortex structures similar to that expected in the MG phase in the disordered glassy phase of a high-temperature superconductor.
There is an additional controversy about the structure of the disordered vortex state at low temperatures and strong pinning (or high magnetic field). Early decoration experiments deco1 on layered high-temperature superconductors showed evidence for an amorphous arrangement of vortices in the disordered phase. However, more recent experiments deco2 on a low-temperature superconductor, , have shown the occurrence of polycrystalline disordered structures. A similar disagreement exists between the results of different simulations: while a simulation sim1 of the structure of a two-dimensional vortex system with random point pinning shows a polycrystalline arrangement of the vortices, another numerical study of a similar system rodriguez has found amorphous structures without well-defined crystalline regions separated by grain boundaries. The reason for this disagreement remains to be understood.
The question we wish to address in this work is whether the differences (summarized above) among the results of different studies of the properties of vortex matter with random point pinning arise, at least in part, from differences in the details of the pinning potential. It is often quite difficult to obtain reliable information about the microscopic pinning centers present in an experimentally studied sample. Therefore, it is possible that samples of the same superconductor studied in different experiments have different pinning potentials. This may account for some of the differences in the experimental results. Similarly, the pinning potentials used in different simulations are often quite different from one another. It is, therefore, important to determine the extent to which the details of the pinning potential are relevant in determining the properties of the system. Here we tackle this issue by studying the thermodynamic and structural properties of the mixed phase of a highly anisotropic layered high-temperature superconductor in the presence of a small concentration of randomly located strong point pinning centers. The pinning centers on different layers are assumed to be completely uncorrelated. The primary motivation for this study is to examine the dependence of the phase diagram of this system and the structure of the disordered phase on the details of the random pinning potential by comparing the results obtained with previous resultsdv06 obtained from using the same methods for the same system, but with a much larger concentration of weaker point defects.
In theoretical studies, the random pinning potential is usually assumed to be a random Gaussian variable with zero mean, whose statistics is completely specified by the second moment of its distribution, , where is a short-ranged function (its range is usually assumed to be of the order of the superconducting coherence length ) normalized to unity at , and the parameter measures the strength of pinning. For pinning due to a collection of randomly distributed point pinning centers, is proportional to the product of the depth of the pinning potential of an individual pinning center and the square root of the concentration of pinning centers. Thus, two systems, one with small and large (i.e. a large concentration of weak pinning centers) and a second one with large , but small (i.e. a small concentration of strong pinning centers) may have very similar values of the parameter , so that an analytical treatment based on the assumption of Gaussian randomness would predict the same behavior for the two systems. Physically, however, it is not al all obvious that the properties of these two systems would be very similar. The main objective of our study is to examine this question.
Our study proceeds by numerical minimization of a discretized version of the Ramakrishnan-Yussouff (RY) ry free-energy functional for the system of pancake vortices in a highly anisotropic layered high-temperature superconductor, in a magnetic field normal to the layers. Different phases of the system correspond to different local minima of the free energy in this mean-field description, and a crossing of the free energies of two different minima represents a first-order phase transition. Information about the structure of different phases is obtained from various correlation functions of the density distributions at the corresponding free-energy minima. We have previously used this method to study the thermodynamic and structural properties of this system in the presence of a small concentration of strong columnar pinning centers perpendicular to the layers us1 ; us2 ; prbd , and also a large concentration of randomly placed weak point pinning centers dv06 . We found the phase diagrams in the two cases to be quite different. In the system with a small concentration of strong columnar pins, the low-temperature BrG phase exhibited a two-step melting, via an intermediate polycrystalline Bose glass phase, to the VL. This is qualitatively similar to the prediction banerjee ; gautam of two-step melting (via an intermediate MG phase) of the BrG phase in systems with random point pinning. In contrast, we found a single first-order melting of the BrG phase in the system with a large concentration of weak random point pinning centers. The structure of the disordered phase was amorphous in this case.
The pinning potentials in these two cases differ in two important ways. First, the pinning potential on different layers are perfectly correlated for columnar pins and completely uncorrelated for point pinning. Second, the system with columnar pins has a small concentration of strong pining centers, whereas the one with point pinning has a large concentration of weak pinning centers. It is not clear which one of these two differences is the primary reason for the observed differences in the properties of these two systems. More important is the possibility that, in the case of point pinning alone, differences in the concentration and strength of the pinning centers can account for the apparently conflicting behaviors discussed above. To shed light on these issues, we consider here a system with a small concentration of strong pinning centers whose positions on different layers are completely uncorrelated. The values of the areal concentration of pinning centers on each layer and the strength of the pinning potential of each pinning center are chosen so as to include the region where the values of the parameter are similar to those for the system with large and small studied earlier dv06 . Thus, a comparison of the results obtained here with those of Ref. dv06, can provide useful information about the dependence of the properties of disordered vortex matter on the details of the random pinning potential. The model of pinning considered here may be appropriate for films of high-temperature superconductors in which meandering lines of dislocations film1 ; film2 or artificially introduced material defects film3 act as strong columnar pinning centers that are not perfectly correlated across layers.
We consider a fixed value of the magnetic induction = 2kG and study the phase behavior for different values of the strength of the pinning potential, keeping the low pin concentration fixed (a discussion of how the behavior is expected to depend on the value of may be found in Ref. dv06, ). For relatively small values of , we find a topologically ordered BrG phase at low temperatures, which melts into a VL via a first-order transition as is increased. As is increased, the temperature at which this melting transition occurs decreases, and the transition line in the plane tends to become parallel to the -axis for large , indicating that the BrG phase does not exist if the pin strength exceeds a critical value. We find that the disordered phase into which the BrG transforms as is increased at low is glass-like: the vortices are strongly localized at points that do not form a structure with long-range translational or orientational correlation. However, this phase transforms continuously into the high-temperature VL as is increased at constant : we do not find any evidence for a phase transition between this glassy state and the VL.
Although the general features of the phase diagram are qualitatively similar to those found in our earlier study, dv06 several other features found here are substantially different. The structure of the glassy state at large and low is quite different from that of the disordered phase found in Ref. dv06, . In the glassy phase of the present system, the vortices on each layer form a polycrystalline structure with crystalline domains separated by grain boundaries, in contrast to the amorphous structure found in Ref. dv06, . Also, the vortex positions on different layers are now significantly correlated, with a correlation length of the order of 20 layer spacings. This is very different from the previously founddv06 glassy state, which does not exhibit any interlayer correlation in the vortex positions. The glassy state found here has the characteristics of the VS and MG phases mentioned above. For this reason, we classify this state as a VS, whereas the glassy state found in Ref. dv06, was identified as a pinned vortex liquid. Another difference in the properties of these two systems lies in the location of a crossover line that separates the region in the plane in which the VS is “glassy” in the sense that the peak vortex densities are high from that in which these densities are more liquid-like. This crossover line is obtained using a criterion prbd based on percolation of liquid-like regions. The location of this crossover line in relation to the first order line in the plane bounding the BrG phase is quite different in the two systems. We also find that the rms value of the random pinning potential at which the BrG melts in the present system is about an order of magnitude smaller than that at which the BrG to pinned vortex liquid transition occurs in the system of Ref. dv06, at the same temperature. These differences illustrate the importance of the details of the pinning potential in determining the properties of disordered vortex matter, and suggest that the predictions of analytic calculations in which the effects of random pinning are assumed to be described completely by the second moment of the distribution of the pinning potential may not be quantitatively correct.
The rest of this paper is organized as follows. The model considered here and the method of calculation are described in section II. In section III, we describe in detail the results of our calculations and compare these results with those obtained in Ref.dv06, . Section IV contains a summary of our main results and a few concluding remarks.
II Model and Methods
We consider the system of pancake vortices in a highly anisotropic layered superconductor with vanishingly small Josephson coupling between layers in a magnetic field perpendicular to the layers. In this system, the pancake vortices on different layers are coupled only via their electromagnetic interaction. Our starting point is the expression for the free energy of the vortex system as a functional of the time-averaged areal density of pancake vortices . Here is a two dimensional vector and the discrete index numbers the layers. We write
| (1) |
where the first term in the right-hand side is the free energy in the absence of pinning, while the second includes the pinning effects. For the first term we use the RY form ry :
| (2) |
where is the inverse temperature and the deviation of from its average value , the density of the uniform liquid ( where is the magnetic induction and the superconducting flux quantum). We have taken our zero of the free energy at its uniform liquid value. denotes the direct pair correlation function of the uniform vortex liquid at density . This static correlation function is assumed known and contains the required information about the interactions. We have taken for the expression obtained from the hypernetted chain approximation in Ref. menon1, . We use parameter values appropriate to BSCCO, taking the same numerical values as in Ref. dv06, .
For the second (pinning) term in Eq. (1) we write:
| (3) |
where is the pinning potential at point on layer . The pinning potential is assumed to be produced by random atomic scale point defects. We characterize the concentration of these point defects by the fraction of the cells in the underlying BSCCO crystal lattice (which we take to be orthorhombic with in-plane lattice spacing and interlayer distance ) that contain defects.
To study the properties of the vortex system, we discretize the free energy by introducing variables in a triangular computational lattice of size with periodic boundary conditions, where is the number of layers. Here where is the area of the in-plane unit cell of the computational lattice and denotes the location of the th computational lattice point in the th layer. We then minimize the free energy functional with respect to the variables using previously described procedures.cdo ; prbv All of the results presented here are for computational lattices with and . We work at constant field . We take the computational lattice constant to be , where denotes the equilibrium valueprbv of the lattice constant of the vortex lattice of the pure system for near its melting transition. With these choices, the number of pancake vortices per layer is . All lengths are measured in units of defined by .
To determine the pinning potential associated with each computational cell, we generate in each layer a random set of points, where is the number of defects per layer, . We then have where is the pinning potential strength, which we will give in degrees , and the number of defect points associated with the computational site. We consider here relatively large values of and small values of (see below). In that case the most frequent value of the integer is zero and it rarely exceeds unity. With these conventions the average of is zero while its fluctuations are . In most of our calculations, the concentration of pinning defects was fixed at a value that corresponds to having pins per layer, but we have also checked that results for 32 and 64 pins per layer are qualitatively the same and quantitatively very similar. The pin concentration of 24 per layer corresponds, in physical units, to having pinning defects for every hundred unit cells in the underlying crystal lattice. This is in contrast to the value used in Ref. dv06, which was one defect per hundred unit cells of the crystal lattice. Thus the value of used here is about four orders of magnitude smaller. In contrast we use values of the strength one or two orders of magnitude larger, so that the product that determines the second moment of the random pinning potential is comparable in the two cases.
III Results
In this section we discuss the results obtained using the methods described in the preceding section. Tests of the accuracy of our numerical procedures were extensively reported in Ref. dv06, and need not be reported again here. Different phases, corresponding to different vortex density structures, are obtained by starting the minimization process with different initial conditions. For a new pin configuration, one can start either with uniform conditions (all variables set to their average value) or with “crystal like” initial conditions where the initial values of the variables are set by minimizingprbv the pinning energy of the equilibrium crystal configuration in the absence of pinning. The first set of initial conditions leads to a disordered configuration provided that such a configuration exists, at the values of and considered, as a local free energy minimum, that is, either a stable or a metastable configuration. Similarly, the second set of initial conditions leads to an ordered state of the BrG type, if such a state is at least metastable. Once a local minimum configuration has been obtained at a certain and , it can be used as the initial condition for a run at nearby values of these parameters. This procedure is efficient since convergence is then fast unless in changing the parameter values the boundary of stability of the phase in question is crossed. We have used this method to carry out various annealing and thermal cycling procedures us2 ; prbd that ensure that the free-energy minima considered in our studies represent low-lying local minima of the free energy. Results for different random pin configurations at the same values of and are extremely consistent and we have found it sufficient to average over three different configurations in order to obtain quantities such as the location of phase boundaries.
III.1 Structure of free-energy minima
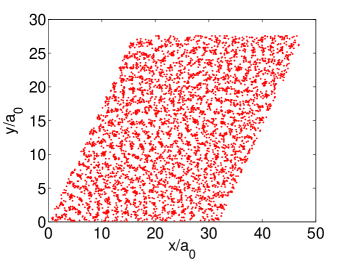
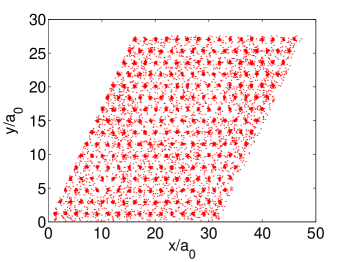
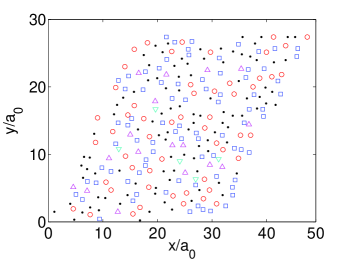
The structure of the free energy minima can be determined by studying different correlation functions, that are readily obtained from the at that local minimum, and by direct visualization. In Fig 1 we consider the option of directly visualizing the vortex lattice. From the values of , we extract the average vortex positions by locating a vortex at site of layer if the value of at such a site exceeds all values of for any site within radius of site . In both panels of Fig 1, a single dot is plotted corresponding to the position of a vortex at any layer. In the top panel which is for the disordered phase at , , this is done for twenty consecutive layers, chosen at random, while in the bottom panel, which is for the ordered phase at and , this is done for all 128 layers. The difference between the two phases can be seen clearly from these plots. The ordered phase exhibits a nearly crystalline arrangement of the vortices, while no such order is visible in the plot for the disordered phase. If all 128 layers were included in the top panel, the plot would be nearly filled by the dots. Thus, while there are, as we will see, some interlayer correlations in the vortex positions in the disordered phase, their range is much shorter than that in the ordered one.
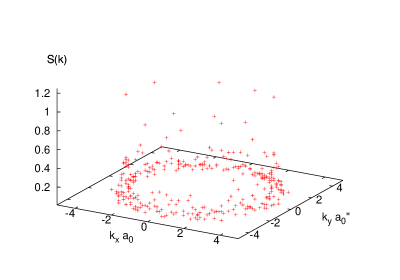

Turning now to the correlation functions, we show in Fig. 2 the two-dimensional static structure factor defined as:
| (4) |
where is the Fourier transform of , with being the two-dimensional wave-vector in the layer plane and the wave-vector in the direction normal to the layers. With the normalization chosen (the total number of pancake vortices) should be of order unity for a disordered state. Its maximum possible value is itself, which equals 32768 in our samples. Both panels of Fig 2 correspond to , where both phases are locally stable. The top panel corresponds to the disordered phase and the lower panel to the ordered phase which is the globally stable one, as we will see below, at these values of . Noting the very different vertical scales and the well-defined hexagonal pattern in the lower panel, a clear difference between the two phases in the degree of order in the transverse planes becomes quite obvious.
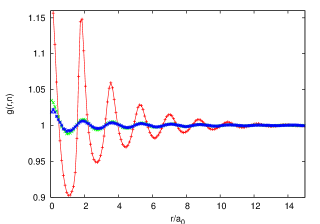
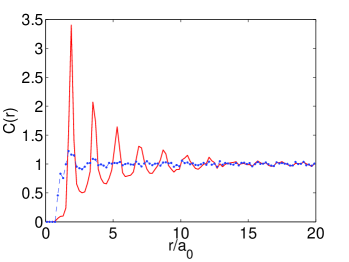
This is confirmed by the results for the correlations in real space, shown in Fig 3, which pertain also to the out-of-plane correlations. We define as the angularly averaged Fourier transform of , normalized by . Here is the in-plane distance and indexes the distance between planes. Thus, is simply the in-plane, angularly averaged correlation function . We plot, in Fig 3, at , . At these values the ordered phase is globally stable and the disordered one, metastable. In the top panel (disordered phase) we plot the cases . We see that the decay of as a function of either or is rather fast, particularly the latter. On the bottom panel, for the ordered phase, where we plot only the two values , the situation is very different: the decay with is markedly slower but the most remarkable feature is that the and results are nearly identical, indicating long-range correlations in the direction normal to the planes.
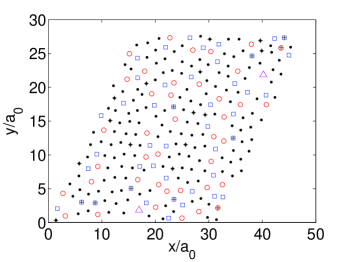
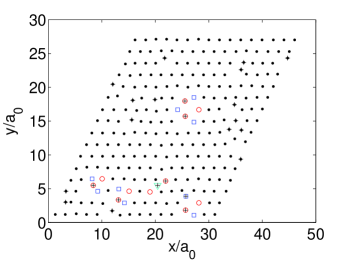
We now return to the vortex lattice, as in Fig. 1, and re-examine it via a Voronoi construction. We recall that the Voronoi construction is nothing but the usual Wigner-Seitz procedure on a perfect lattice, but performed in an arbitrary network. The number of sides of a Voronoi cell associated with a vertex of the network (location of a vortex in our case) represents the number of neighbors of that vertex. These numbers of neighbors are represent by a symbol (and color) code in Figure 4. There we display Voronoi plots for one layer, chosen at random, of the systems whose vortex configurations are shown in Fig. 1. One can see that in the ordered phase (bottom panel) nearly all the vortices have six neighbors and that the most common deviation is a pair of adjacent sites with five and seven neighbors, which corresponds to a dislocation. These dislocations invariably occur near pinning sites (in fact, all the visible deviations from a perfect crystalline arrangement of the vortices are found near pinning sites which are almost always occupied by vortices, except in very rare occurrences of two pinning sites very close to each other), and they form tightly bound clusters with net Burgers vector equal to zero. The top plot is very different: there we can see nearly ordered domains in which the vortices have the regular number of six neighbors. These domains are small and separated by regions that are much more disordered, consisting mainly of sites with five and seven neighbors. These regions might be called grain boundaries if they were uniformly thinner.
¿From these plots and similar data obtained in the ranges , , we conclude that we have here two different phases, separated by a first-order transition. The evidence given up to this point suffices to show that the ordered phase is a Bragg glass. The nature of the disordered phase requires more detailed characterization, which is addressed in the following subsection.
III.2 Vortex slush and pinned vortex liquid
In this section, we present the results of a detailed characterization of the structure of the disordered phase. We compare and contrast these characterization results with those obtained for the disordered phase in our earlier study dv06 of the structure of the disordered phase of the same vortex system in the presence of a much larger ( of the underlying crystal lattice) concentration of randomly placed weak (small ) pinning centers. To make this comparison meaningful, we particularly consider cases where despite the differences in the values of and , the values of the parameter in the two cases are comparable. As explained above, if the effects of random pinning were determined entirely by the value of , then the structures of the disordered phases in the two systems would have been very similar. As we will seen in detail, we find very significant differences between the structures of the two disordered phases: indeed, we show that while the disordered phase in the system with a large concentration of weak pinning centers has very little short-range order (this led us to conclude dv06 that this phase should be identified as a pinned vortex liquid), the disordered phase in the present system with a small concentration of strong pinning centers exhibits substantial short-range order, both in the layer plane and in the direction normal to the layers, leading us to identify this phase as VS or MG.
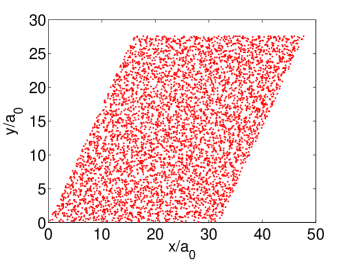
We begin with a qualitative comparison of the peak-position plots (see Fig. 1, top panel), and of the Voronoi plots (see Fig 4, top panel). In Fig. 5, we have shown the positions of the local density peaks on randomly selected 20 consecutive layers of a disordered free-energy minimum obtained at K for a sampledv06 with the larger value of and weak (K) pinning centers. The dots that represent the peak positions fill the sample area quite randomly, in contrast to the plot shown in the top panel of Fig. 1, which shows a definite short-range structure, indicating the presence of correlations among the positions of the local density peaks. Similarly, a typical Voronoi plot for a randomly chosen layer of the minimum for which results are given in Fig. 5 is shown in Fig. 6. Again, in comparison with the analogous plot shown in the top panel of Fig. 4, this Voronoi plot shows a much higher degree of disorder. In particular, the total number of “vortex lattice” sites with six nearest neighbors is substantially smaller in Fig. 5, and there is no evidence for the presence of any crystalline domain (for this reason, we classified dv06 the structure of these minima as amorphous, not polycrystalline, in our earlier study). These two plots, therefore, suggest that the disordered minima obtained in the present study exhibit a much higher degree of short-range order than those found earlier for a system with a large concentration of weak pinning centers.
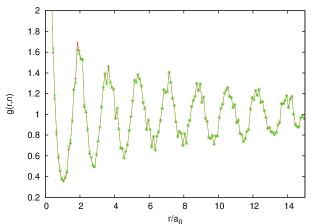
To make these observations more quantitative, we have calculated two correlation functions, and , that represent, respectively, the degree of correlation among the vortex positions (i.e. the positions of the local peaks of the density field) in the layer plane and across layers. The function is the usual angularly averaged pair-distribution function of vortex positions on the same layer, averaged over all the layers. It should not be confused with the correlation function considered in section III.1 which represents the two-point correlation of the time-averaged local density: therefore, is sensitive to both the positions and the heights of the local density peaks, whereas provides more accurate information about the correlation in the peak positions because it is insensitive to the heights of the local density peaks. The function is defined as follows: For each peak position on a layer, we calculate the number of peaks on another layer, separated by layer spacings from the original one, that lie within a small in-plane distance from it. This number is then averaged over all the peak positions on all the layers and divided by , the average number of vortices in a circular area of radius , to obtain . The values of are found to be insensitive to the choice of as long as is small compared to the average distance between nearest-neighbor vortices (, see Fig. 3, top panel) on the same layer. The results reported here were obtained using . It is clear from the definition of that this function measures the degree of alignment between vortices on two layers separated by layer spacings. If the vortex positions on different layers are completely uncorrelated, then should be equal to unity for all . Values of indicate some degree of alignment between the vortex positions on different layers.
Typical results for these two correlation functions are shown in Figs. 7 and 8. The results for a system with a small concentration of strong pinning centers (present study) are shown for K and K, whereas the results for a system with a large concentration of weak pinning centers (Ref. dv06, ) are for the same parameters as in Figs. 5 and 6. These were chosen so as to make the values of for the two systems very similar. Also, the functions and that describe correlations among average vortex positions are meaningful only when the local density peaks are sufficiently high (the vortices are strongly localized), so that the average vortex positions can be defined without ambiguity. This criterion is satisfied for the parameter values for which results are shown in Figs. 7 and 8.
The plots in Fig. 7 clearly show that the disordered phase in the present (low ) system exhibits a substantial degree of in-plane (short-range) positional order, while the disordered phase in the system with a large concentration of weak pinning centers has almost no in-plane correlation in the vortex positions. The function for this low and high system exhibits six clear peaks of decreasing height, indicating the existence of in-plane positional correlations up to a distance of about . This length scale is consistent with the typical size (20–30 vortices, see Fig. 4, top panel) of in-plane crystalline domains at the disordered free-energy minima found in the present work. In contrast, the for the system with a large concentration of weak pinning centers exhibits no prominent peaks, indicating that the disordered phase of this system has very little in-plane positional order and crystalline domains can not be meaningfully defined in this case.
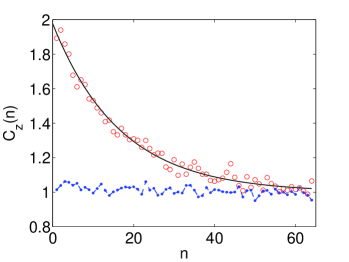
A similar difference in the degree of out-of-plane correlations in the vortex positions is also found in Fig. 8 where the function is plotted for the two free-energy minima of Fig. 7. The data for the system with a large concentration of weak pinning centers are all close to 1.0, even for values of near 1. This implies that the vortex positions on different layers are essentially uncorrelated in this case. On the other hand, for the present system starts at a value close to 2.0 for near 1, and approaches unity only as approaches about , (the largest value of for which can be defined in our system of layers with periodic boundary conditions is ). These results indicate that the vortices on different layers are aligned to some extent in the disordered phase of the present system. We find that the dependence of on the layer separation can be represented quite well by the functional form where the “correlation length” provides a measure of the degree of out-of-plane alignment of the vortices. A fit of the data to this functional form (with , ) is shown by the solid line in Fig. 8. Similar values of are found for other values of the parameters in the disordered phase of the present system, indicating that the vortex positions on different layers are substantially correlated in the system with a small concentration of strong pinning centers.
It is clear from all the results described above that the disordered free-energy minima found in the present study exhibit a substantial degree of short-range positional order. The in-plane structure can be described as polycrystalline, with 20-30 vortices in each crystalline domain. The vortex positions on different layers are also correlated, with a correlation length of 15-20 layer spacings. These features are similar to those expected for the VS and MG phases that have been predicted to exist in vortex systems with random point pinning. We, therefore, identify the disordered phase in the present system as VS. This is qualitatively different from the disordered phase found in our earlier study dv06 of a vortex system with a large concentration of weak pinning centers. In that case, the disordered phase, which does not exhibit any appreciable in-plane or out-of-plane correlation in the vortex positions, was identified as pinned vortex liquid which should be distinguished from the VS found in the present work.
III.3 Phase Diagram
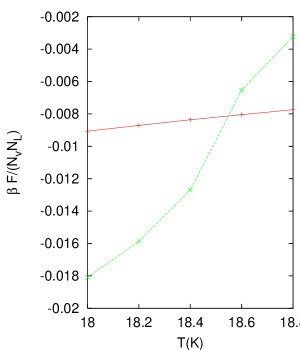
To determine the phase diagram one simply looks for free energy crossings as a function of and . This is quite straightforward. An example is shown in Figure 9, where we consider the free energy per vortex, in units of , for the BrG and VS phases at constant as a function of temperature. In the range plotted both phases are locally stable. The BrG minimum becomes unstable just beyond the right edge of the plot. The symbols correspond to the results for the free energy and they are connected by straight lines. Error bars from statistical averaging over different pin configurations are smaller than the symbols. The first order transition between the two phases is easily located from such data. A similar first order transition from the BrG to the VS phase is found as the pinning strength is increased while keeping constant at a low value. The BrG minimum becomes unstable as or is increased slightly above the value at which the transition to the VS phase occurs. The VS minimum, on the other hand, remains locally stable for all the values of and considered here.
For relatively small values of and large , the values of the density at the local peaks of the density field in the VS phase do not greatly exceed (see below) the average liquid density value except for peaks at the pinning centers. In that sense, the VS phase might be said to be liquid-like. On the other hand, for large and low , these local peak density values are substantially larger than , indicating strongly localized vortices. A VS minimum with these properties should be viewed as solid-like (glass). However, for the parameter range explored here, we do not find any evidence for a transition within the VS state between the high -low and the low -high structures. A liquid-like minimum obtained by starting the free-energy minimization from disordered initial conditions at a high evolves continuously to a glassy VS minimum as it is “followed” to a low temperature by reducing in small steps and performing the free-energy minimization at each new temperature with the minimum obtained at the previous temperature as the initial state. Similarly, a glassy VS minimum obtained at low and large by starting the minimization from disordered initial conditions (or by starting from a BrG minimum and increasing to a value at which the BrG minimum becomes unstable and a disordered minimum is found) evolves continuously to the high-temperature liquid-like structure as is increased in small steps.
Thus, our results do not show the first-order VL to VS transition found in some experiments slush1 ; slush2 ; slush3 and in a simulation nh . However, these experiments and simulation show that the line of first-order VL to VS transitions ends at a critical point as the pinning strength (in the simulation) or the magnetic field (in the experiments) is increased. It is likely that the parameters used in our study correspond to values beyond this critical point, so that no VL to VS transition is found. In a study us1 ; us2 ; prbd of the same vortex system in the presence of a small concentration of strong columnar pins (with values of comparable to those used here) perpendicular to the layers, we found a first-order transition from the high-temperature VL to a polycrystalline Bose glass phase as was decreased, but only when the ratio of the number of pinning centers to the number of vortices per layer was less than about 1/32. The value of this ratio in the present study (24/256 = 3/32) is larger than 1/32. This suggests that a first-order VL to VS transition may occur in the present system for a smaller concentration of pinning centers. It is, however, difficult to test this possibility numerically. The typical size of crystalline domains in a VS state will increase as the concentration of pinning centers is reduced. A multi-domain structure can be distinguished from a crystalline one in a numerical study only if the sample size is substantially larger than the typical domain size. So, to study polycrystalline free-energy minima in the present system for a much smaller concentration of pinning centers, one would require samples containing a few thousand vortices per layer. Samples of such size could be studied for columnar pins because the problem is then effectively two-dimensional, but a similar study for the present case (where the problem is three-dimensional) would be computationally intractable.
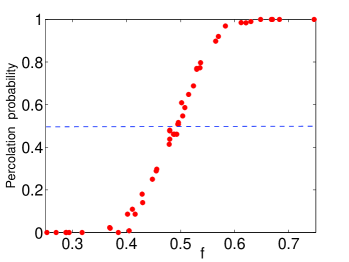
A crossover line between liquid-like and glassy behaviors of the VS phase can be drawn in the plane by using a criterion based on percolation. In Ref. prbd, , we found that a local peak of the density field may be classified as “liquid-like” (the corresponding vortex is weakly localized) if , the value of the density variable at the peak, does not exceed . Otherwise it is characterized as “solid-like”, representing a strongly localized vortex. One can then readily examine whether or not, at a certain and , the regions with percolate across any of the layers in a sample. If such regions percolate in a majority of the layers, then the corresponding VS minimum may be classified as “liquid-like”; otherwise, the minimum should be called “glassy”. Similar percolation criteria have been used in other studies perc1 ; perc2 to differentiate between liquid and glassy phases. We have done this for all values of and studied. The probability that liquid-like sites percolate across a layer depends on the fraction of such sites. This dependence is shown in Fig. 10, where we see that the percolation probability is 1/2 very close to . We have therefore adopted the criterion that percolation of liquid-like regions occurs at , which is also the percolation threshold for random site percolation on a triangular lattice.
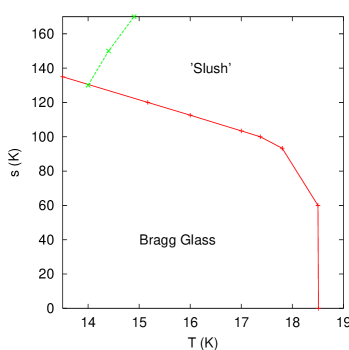
The phase diagram of the system in the plane is shown in Fig. 11, top panel. The plus signs connected by solid red segments locate the line of first order transitions separating, as explained above, the BrG and the VS phases. We have also indicated in the panel the percolation line for high and low – percolation of liquid-like regions in the VS phase occurs as this line is crossed from the left or from above. A few features of the phase diagram are worth pointing out. The temperature at which the melting transition of the BrG phase occurs is quite insensitive to the value of for relatively small values of . As is increased further, the transition temperature decreases and the phase boundary tends to become parallel to the temperature axis for large . The decrease in the transition temperature with increasing is in qualitative agreement with the prediction of analytic calculations.gautamprl ; goldsc ; gld2 The BrG phase exists only if the pinning strength is sufficiently small. The shape of the BrG–VS phase boundary in our phase diagram is similar to that found in the simulation of Ref. nh, in which the ratio of the number of pinning centers to the number of vortex lines is similar to the value used here. The location of the percolation line relative to the BrG–VS phase boundary is also similar to that of the VS–VG transition line found in Ref. nh, . This, however, may be a coincidence, since the percolation line in our phase diagram does not correspond to a true phase transition, whereas the VS–VG transition line in Ref. nh, represents a phase transition signaled by the appearance of superconducting phase coherence which can not be studied in our calculation.
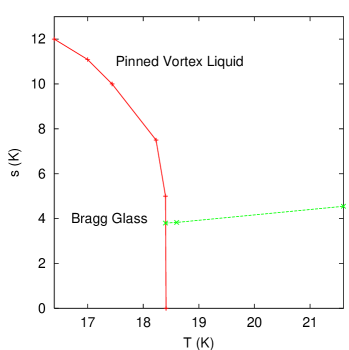
For comparison we have included in Fig. 11 (lower panel) the phase diagram obtaineddv06 for a high concentration of weak pinning centers, including also the percolation line, which was not reported earlier. The general shapes of the phase boundaries obtained in the two cases are similar. However, a quantitative comparison shows that a low concentration of strong pinning centers considered in the present study is much more effective in destroying the nearly crystalline order of the BrG phase than a large concentration of weak pinning centers considered previously. For example, in the phase diagram shown in the top panel of Fig. 11, the transition of the BrG phase to the VS phase at occurs at , for which the rms pinning potential is (see Section II). In contrast, the transition at in the phase diagram in the bottom panel of Fig. 11 occurs near , for which the rms value of the pinning potential is . Thus, the rms value of the random pinning potential at which the BrG phase undergoes a transition to a disordered phase at a fixed temperature in a system with a large concentration of weak pinning centers is about 10 times larger than that in a system with a small concentration of strong pinning centers. This implies that the kind of pinning considered in the present study is much “stronger” (i.e. more effective in destroying BrG order) than that considered in Ref. dv06, .
The comparison between the two phase diagrams also points out a serious flaw in analytic calculations in which the random pinning potential is assumed to be Gaussian and its effects are assumed to be determined completely by its rms value (second moment). Our results show that the details of the pinning potential, not just its second moment, are very important in determining the phase behavior: the value of the second moment of the pinning potential at which the BrG phase undergoes a transition to a disordered phase at a fixed temperature can vary by orders of magnitude, depending on the details of the pinning potential. Thus, the predictions of analytic calculations gautamprl ; goldsc ; gld2 ; nelson ; larkin of the phase diagram of superconductors with random pinning, in which the effects of the pinning potential are assumed to be determined by its second moment only, can not be quantitatively accurate – the details of the pinning potential have to be taken into account for an accurate theoretical determination of the locations of the phase boundaries.
Fig. 11 also shows that the location of the percolation line relative to that of the transition line of the BrG phase is very different in the two cases. In the top panel, the percolation line intersects the BrG–VS transition line at a relatively low temperature where the latter is almost parallel to the -axis, whereas in the bottom panel, the intersection is near the high-temperature, “vertical” part of the boundary of the BrG phase. The value of the dimensionless quantity , which measures the ratio of the rms value of the pinning potential to the thermal energy is, along the percolation line, nearly the same in the two cases, indicating that the rms value of the pinning potential provides a fairly accurate account of the effectiveness of random pinning in localizing the vortices. The difference in the location of the percolation line relative to the phase boundary of the BrG phase again arises because the rms value of the pinning potential is not, by itself, a good indicator of the effectiveness of the pinning potential in destroying BrG order.
IV Summary and discussion
We have considered here a layered superconductor with a small concentration of strong random point pinning centers and a fixed magnetic induction, normal to the layers. We have described the phase diagram in the plane, where is the pinning strength. We find that the stable phase at sufficiently low values of and is clearly a Bragg glass (BrG), as in the high case.dv06 The melting line in the plane at low is nearly horizontal. Upon increasing or the BrG melts via a first order transition into a disordered phase. We find that this phase is clearly polycrystalline (see top panels in Figs 1 and 4) with well defined crystalline domains separated by domain walls. It has characteristics of the VS phase discussed in the literature,nh ; slush_th1 ; slush_th2 ; slush1 ; slush2 ; slush3 and of the also proposedbanerjee ; gautam MG phase. We therefore characterize this phase (see Fig. 11 and the text) as a VS. There is a very clear difference between this and the high , low case as to the nature of this disordered phase. For large and low , this phase was founddv06 to be an amorphous, pinned VL state, with almost no correlations in the layer plane or between different layers (see Figs. 6 and 7). A key result of this paper is this contrast between the behavior of the system studied here and that of the corresponding systemdv06 with a much larger concentration of weak pinning centers.
The phase diagrams of these two systems in the plane are qualitatively similar, but very different quantitatively. The value of the second moment of the random pinning potential at which the transition of the BrG to the VS occurs in the present system is much smaller than that at the BrG to pinned VL transition in Ref. dv06, at the same temperature. Also, the location of the percolation line relative to the phase boundary of the BrG phase is quite different in the two systems. These results imply that the notion that the parameter suffices to characterize the effects of the random point pinning potential (in other words, that it is enough to specify its second moment) is too simplistic and may be quantitatively inaccurate. The assumption of Gaussian randomness, which implies that only the value of the second moment of the distribution of the random pinning potential is relevant, is valid only in a rather limited sense, namely only when the pinning potential seen by a vortex is the sum of contributions from a large number of weak pinning centers. The validity of the Gaussian assumption does not extend further than that, as we have proved here. Although the limited validity of this assumption was mentioned in a few existing studies,gautamprl ; goldsc which did not however quantify its degree of inadequacy, it has been generally ignored.
Our results suggest that many of the experimental and theoretical controversies found in the literature (which we have reviewed in our Introduction) about the behavior of this system originate in differences in the insufficiently characterized nature of the point pinning. This conclusion, besides its obvious theoretical import, has also strong practical implications since a good understanding of the effects of pinning is the key to obtaining the larger values of the critical current that are needed for the high temperature superconductors to fulfill their promise as potentially useful materials.
Acknowledgements.
This work was supported in part by NSF (OISE-0352598) and by DST (India).References
- (1) G. Blatter, M.V. Feigelman, V. B. Geshkenbein, A. I. Larkin, and V. M. Vinokur, Rev. Mod. Phys. 66, 1125 (1994).
- (2) T. Nattermann, Phys. Rev. Lett. 64, 2454 (1990).
- (3) T. Giamarchi and P. Le Doussal, Phys. Rev. B 52, 1242 (1995).
- (4) T. Klein, I. Joumard, S. Blanchard, J. Marcus, R. Cubitt, T. Giamarchi and P. Le Doussal, Nature (London) 413, 404 (2001).
- (5) M. P. A. Fisher, Phys. Rev. Lett. 62, 1415 (1989).
- (6) D. S. Fisher, M.P.A. Fisher and D.A. Huse, Phys. Rev. B 43, 130 (1992).
- (7) A. M. Petrean, L. M. Paulius, W.-K. Kwok, J. A. Fendrich, and G. W. Crabtree, Phys. Rev. Lett. 84, 5852 (2000) and references therein.
- (8) H. Beidenkopf, N. Avraham, Y. Myasoedov, H. Shtrikman, E. Zeldov, B. Rosenstein, E. H. Brandt, and T. Tamegai, Phys. Rev. Lett. 95, 257004 (2005).
- (9) H. Beidenkopf, T. Verdene, Y. Myasoedov, H. Shtrikman, E. Zeldov, B. Rosenstein, D. Li, and T. Tamegai, Phys. Rev. Lett. 98, 167004 (2007).
- (10) D. R. Strachan, M. C. Sullivan, P. Fournier, S. P. Pai, T. Venkatesan, and C. J. Lobb, Phys. Rev. Lett. 87, 067007 (2001).
- (11) H. S. Bokil and A. P. Young, Phys. Rev. Lett. 74, 3021 (1995); J. Kisker and H. Rieger, Phys. Rev. B 58, R8873 (1998).
- (12) P. Olsson, Phys. Rev. B 72, 144525 (2005)
- (13) J. Lidmar, Phys. Rev. Lett. 91, 097001 (2003); A. Vestergren, J. Lidmar, and M. Wallin, Phys. Rev. Lett. 88, 117004 (2002).
- (14) Y. Nonomura and X. Hu, Phys. Rev. Lett. 86, 5140 (2001).
- (15) R. Ikeda, J. Phys. Soc. Jpn 65, 3998 (1996); ibid 70, 219 (2001).
- (16) R. Ikeda and H. Adachi, J. Phys. Soc. Jpn 69, 2993 (2000).
- (17) T.K. Worthington, M.P.A. Fisher, D.A. Huse, J. Toner, A.D. Marwick, T. Zabel, C.A. Field and F. Holtzberg, Phys. Rev. B. 46, 11854 (1992).
- (18) K. Shibata, T. Nishizaki, T. Sasaki, and N. Kobayashi, Phys. Rev. B 66, 214518 (2002).
- (19) T. Naito, H. Iwasaki, T. Nishizaki, S. Haraguchi, Y. Kawabata and K. Shibata, Phys, Rev. B 68, 224516 (2003).
- (20) P. Olsson and S. Teitel, Phys. Rev. Lett. 94, 219703 (2005). See also Y. Nonomura and X. Hu, Phys. Rev. Lett 94, 219704 (2005).
- (21) S. S. Banerjee, A. K. Grover, M. J. Higgins, G. I. Menon, P. K. Mishra, D. Pal, S. Ramakrishnan, T.V. Chandrasekhar Rao, G. Ravikumar, V. C. Sahni, S. Sarkar, and C. N. Tomy, Physica C 355, 39 (2001), and references therein.
- (22) G. I. Menon, Phys. Rev. B 65, 104527 (2002).
- (23) U. Divakar, A. J. Drew, S. L. Lee, R. Gilardi, J. Mesot, F.Y. Ogrin, D. Charalambous, E.M. Forgan, G. I. Menon, N. Momono, M. Oda, C. D. Dewhurst, and C. Baines, Phys. Rev. Lett. 92, 237004 (2004).
- (24) G. I. Menon, A. Drew, U. K. Divakar, S. L. Lee, R. Gilardi, J. Mesot, F. Y. Ogrin, D. Charalambous, E. M. Forgan, N. Momono, M. Oda, C. Dewhurst, and C. Baines, Phys. Rev. Lett. 97, 177004 (2006).
- (25) D. J. Grier, C. A. Murray, C. A. Bolle, P. L. Gammel, D. J. Bishop, D. B. Mitzi and A. Kapitulnik, Phys. Rev. Lett. 66, 2270 (1991).
- (26) Y. Fasano, M. Menghini, F. de la Cruz, Y. Paltiel, Y. Myasoedov, E. Zeldov, M. J. Higgins, and S. Bhattacharya, Phys. Rev. B 66, 020512(R) (2002).
- (27) M. Chandran, R. T. Scalettar, and G. T. Zimanyi, Phys. Rev. B 69, 024526 (2004).
- (28) J.P. Rodriguez, arXiv:0704.1536v3.
- (29) C. Dasgupta and O.T. Valls, Phys. Rev. B74, 184513 (2006).
- (30) T. V. Ramakrishnan and M. Yussouff, Phys. Rev. B 19 (1979).
- (31) C. Dasgupta and O. T. Valls, Phys. Rev. Lett. 91, 127002 (2003).
- (32) C. Dasgupta and O. T. Valls, Phys. Rev. B 69, 214520 (2004).
- (33) C. Dasgupta and O. T. Valls, Phys. Rev. B72, 094501 (2005).
- (34) B. Dam, J.M. Huijbregtse, F.C. Klaassen, R.C.F. van der Geest, G. Doornbos, J.H. Rector, A.M. Testa, S. Freisem, J.C. Martinez, B. Stauble-Pumpin and R. Griessen, Nature 399, 439 (1999).
- (35) F.C. Klaassen, G. Doornbos, J.M. Huijbregtse, R.C.F. van der Geest, B. Dam and R. Griessen, Phys. Rev. B 64, 184523 (2001).
- (36) J.L. MacManus-Driscoll, S.R. Foltyn, Q.X. Jia, H. Wang, A. Serquis, L. Civale, B. Maiorov, M.E. Hawley, M.P. Maley and D.E. Peterson, Nature Materials 3, 439 (2004).
- (37) G. I. Menon, C. Dasgupta, H. R. Krishnamurthy, T. V. Ramakrishnan and S. Sengupta, Phys. Rev. B 54, 16192 (1996).
- (38) C. Dasgupta and O.T. Valls, Phys. Rev. B66, 064518 (2002).
- (39) C. Dasgupta, Europhysics Lett. 20, 131 (1992).
- (40) A. R. C. Baljon, J. Billen, and R. Khare, Phys. Rev. Lett. 93, 255701 (2004).
- (41) J. C. Conrad, P. P. Dhillon, E. R. Weeks, D. R. Reichman, and D. A. Weitz, Phys. Rev. Lett. 97, 265701 (2006).
- (42) G. I. Menon and C. Dasgupta, Phys. Rev. Lett. 73, 1023 (1994).
- (43) Y. Y. Goldschmidt, Phys. Rev. B 56, 2800 (1997).
- (44) T. Giamarchi and P. Le Doussal, Phys. Rev. B 55, 6577 (1997).
- (45) D. Ertaz and D.R. Nelson, Physica C 272, 79 (1996).
- (46) A.I. Larkin and V.M. Vinokur, Phys. Rev. Lett. 75, 4666 (1995).