11email: tiago@astro.ufsc.br 22institutetext: Soar Telescope, Colina El Pino s/n, Casilla 603, La Serena, Chile 33institutetext: Institute of Space Applications and Remote Sensing, National Observatory of Athens, PO Box 20048, Athens 118 10, Greece 44institutetext: Dept. of Physics and Astronomy, University of Sheffield, Sheffield S3 7RH, UK 55institutetext: Isaac Newton Group of Telescopes, Apartado de Correos 321, E-38700, Santa Cruz de La Palma, Spain
A multicolor near-infrared study of the dwarf nova IP Peg
We report the analysis of light curves of the eclipsing dwarf nova IP Peg in quiescence. The light curves are dominated by the ellipsoidal variation of the mass-donor star, with additional contributions from the accretion disc and anisotropic emission from the bright spot. A secondary eclipse is visible in the and light curves, with and of the flux disappearing at minimum light, respectively. We modeled the observed ellipsoidal variation of the secondary star (including possible illumination effects on its inner face) to find a mass ratio of and an inclination of , consistent in the three bands within the uncertainties. Illumination effects are negligible. The secondary is responsible for , and of the flux in , and , respectively. We fitted a black body spectrum to the fluxes of the secondary star to find a temperature of and a distance of pc to the system. We subtracted the contribution of the secondary star and applied 3-D eclipse mapping techniques to the resulting light curves to map the surface brightness of a disc with half-opening angle and a circular rim at the radius of the bright spot. The eclipse maps show enhanced emission along the stream trajectory ahead of the bright spot position, providing evidence of gas stream overflow. The inferred radial brightness-temperature distribution in the disc is flat for with temperatures and colors consistent with those of cool opaque radiators.
Key Words.:
stars: novae, cataclysmic variables – stars: individual (IP Peg) – stars: eclipsing – infrared: stars1 Introduction
The shape of the secondary star in cataclysmic variables (CVs) and low-mass x-ray binaries (LMXBs) is defined by its Roche equipotential surface. Modeling the ellipsoidal variation produced in the light curves of these binaries by the changing aspect of the distorted secondary star with binary phase provides constraints on the orbital parameters (e.g., Warner 1995) and yields an estimate of the contribution of the secondary star to the total light.
Unlike visible and ultraviolet light curves, which are dominated by emission from the disc and bright spot, the near-infrared (NIR) light curves of CVs and LMXBs have significant contributions from the cool secondary star. The determination of the secondary star flux in a set of wavelengths allows a direct estimate of its spectral type and also opens up the possibility of inferring the distance to the binary by means of photometric parallax. Furthermore, knowing the contribution of the secondary star to the light curve allows one to isolate the light from the accretion disc and to apply eclipse mapping techniques (e.g., Baptista & Steiner 1993) to investigate the disc structure in the infrared.
IP Peg is a relatively bright ( mag), long period ( hr) dwarf nova showing recurrent outbursts every few months in which the system increases its brightness by 2 mag in the visible. The binary is seen almost edge on (inclination ) allowing for eclipses of both the white dwarf/accretion disc and the secondary star, as well as of the bright spot (hereafter BS). Optical and ultraviolet (UV) light curves of IP Peg are dominated by anisotropic emission from the prominent BS, making it hard to constrain the system parameters (e.g., Wood & Crawford 1986) and, therefore, difficult to apply eclipse mapping techniques to investigate its accretion disc structure. Szkody & Mateo (1986) found evidence of ellipsoidal variations in light curves of IP Peg. Froning et al. (1999) [hereafter F99] found a pronounced double-hump modulation after subtracting the ellipsoidal variation of the secondary star from their band light curve. Their eclipse mapping analysis indicates that the accretion disc is cool with a flat radial temperature distribution () in the band.
This paper reports a multicolor study of IP Peg in the bands. Section 2 presents the observations and data reduction. Section 3 describes the procedure used to fit the ellipsoidal variation and the application of 3-D eclipse mapping techniques to the light curves after we subtract the contribution of the secondary star. The results are discussed in Section 4 and summarized in Section 5.
2 Observations and data reduction
IP Peg was observed with WHIRCAM (Hughes et al. 1996) at the m William Herschel Telescope in La Palma on 1996 October 26-29, while the system was in quiescence. The observations comprise 3 orbital cycles in the band, and a bit less than 1 orbital cycle each in the and bands. All runs were performed in good weather with bright moon, but no clouds. The seeing ranged from 1.0” to 1.6”. The exposure times were of 1-3s () and of 3s ( and ). The observations are summarized in Table 1.
We used a dithering procedure to estimate the contribution of the sky background, nodding the telescope in a five-position square pattern (center plus four corners). The sky level was obtained from the median of the five images of each set and was then subtracted from each image of the set. A series of dark images, with the same exposure time as the science frames, were obtained during the run at intervals of hrs. These images were used to remove the dark current of the chip. Correction of flat-field effects was also performed.
Data reduction was performed using APPHOT/IRAF111IRAF is distributed by the National Optical Astronomy Observatories, which are operated by the Association of Universities for Research in Astronomy, Inc., under cooperative agreement with the National Science Foundation. aperture photometry routines. The frames of each dithering sequence were aligned with an interactive procedure based on the IRAF ’register’ task and combined to increase the signal-to-noise ratio (S/N) of the measured stars. The non-linearity of the detector was corrected using the ’irlincor’ routine in the CTIO package. Fluxes were then extracted for the variable and for a comparison star North and East of the variable.
Differential light curves (target star flux divided by comparison star flux) were computed. The light curves were flux calibrated using the 2MASS zero point constants (Skrutskie et al. 2006) and the absolute magnitudes for the comparison star (, and ). No color term corrections were applied. The data were phase-folded according to a modified version of the linear ephemeris of Wolf et al. (1993),
| (1) |
were is the time of inferior conjunction of the secondary star. The resulting light curves can be seen in Fig. 1. The band data were combined to improve the of the light curve. The and band data do not cover the full orbit of the binary.
| Date | band | start | No. of | Eclipse1 | phase |
| 1996 | (UT) | frames | cycle | range | |
| 10/26 | 19:00 | 1362 | 30138 | -0.86,+0.50 | |
| 30139 | -0.50,+0.20 | ||||
| 10/27 | 20:00 | 760 | 30144 | -0.28,+0.56 | |
| 10/27 | 23:16 | 590 | 30145 | -0.42,+0.24 | |
| 10/28 | 19:15 | 1212 | 30150 | -0.15,+0.50 | |
| 30151 | -0.50,+0.34 | ||||
| 1 - with respect to the ephemeris of eq.1 | |||||
3 Data analysis
3.1 The white dwarf eclipse width .
The optical study of Wood & Crawford (1986) leads to a white dwarf eclipse width in the range . The uncertainty in estimating arises from the fact that the white dwarf eclipse ingress in IP Peg is veiled by the much more pronounced ingress of the BS eclipse and by the large amplitude flickering seen in optical light curves prior to BS ingress.
In order to refine the value of , we employed an iterative procedure, assuming binary parameters derived from the fit of the ellipsoidal variation (Sect. 3.2) and applying the corresponding phase offset needed to make the observed white dwarf mid-egress feature coincident with phase . The procedure searches for the pair of (, ) values that yields the best for the model light curve. This iterative process converges to a solution with and , consistent with the upper limit of Wood & Crawford (1986). We use the band light curve in this process because it shows clearly the white dwarf egress, unlike the band light curve. The band light curve was not used for this procedure because of its lower S/N and reduced phase coverage. Because the white dwarf egress feature is present in both J band eclipses, we may safely exclude the possibility that the observed feature is due to a flicker/flare from the disc. The light curves shown in Fig. 1 were corrected by the derived value of in order to make mid-eclipse coincident with phase zero.

3.2 Fitting the ellipsoidal variation.
The ellipsoidal variation is modeled with the aid of a light-curve synthesis program, which computes the flux emitted by a Roche-lobe filling star as its aspect changes with binary phase. The surface of the Roche lobe filling star is divided into a large number of tiles. The flux emitted by each tile is modified to account for gravity- and limb-darkening effects. We used the gravity-darkening coefficient of Sarna (1989), , and adopted the non-linear square-root limb-darkening law of Diaz-Cordov s & Gim nez (1992),
| (2) |
where is the angle between the line of sight and the normal to the surface of the tile, and is the intensity emitted normal to the tile surface. We assumed , , and , , (Claret 1998).
In order to account for both limb and gravity darkening we need to adopt values for the temperature and gravity at the pole of the star. Using a procedure similar to that described by F99, we tested a range of physically plausible values varying from to and log from to . The results were rather insensitive to the choice of parameters, except for the band in which the program only converges for values of and log. We then decided to adopt , log and solar metallicity, since these values are in better agreement with those in the literature (Szkody & Mateo,1986; Leggett, 1992; F99).
The parameters fitted by the ellipsoidal variation code are: mass ratio (), binary inclination (), the peak intensity of a spot at the inner hemisphere of the secondary star relative to the mean intensity at the star’s surface (), the orientation angle of the spot with respect to the line joining both stars (), a phase-independent additive flux level , and the flux of the secondary star at phase zero (). The program minimizes the between the observed light curve and the ellipsoidal variation model for a given set of parameters with an amoeba minimization scheme (Press et al. 1986). Alternatively, it is possible to fit a phase offset that minimizes the of each set of parameters (see Sec. 3.1).
The NIR light curves of IP Peg show contributions from other sources apart from the ellipsoidal variation of the secondary star. As a first step, we removed only the phases covering the primary and secondary eclipses from the light curve before attempting to fit the ellipsoidal variation. This leads to hard-to-converge, unrealistic solutions which underestimate the hump at phase and overestimate the hump at phase in the and bands. The difference in brightness is larger in the band – where the asymmetry in the eclipse shape caused by the BS is larger – and disappears in the band, which shows almost no evidence of the BS in the eclipse shape. This indicates that anisotropic emission from the BS contributes significantly to the hump centered at phase . We therefore decided to omit the phase range , as well as the primary and secondary eclipses, from the fitting procedure. With the new restriction, it was possible to fit a model light curve to the data of all bands.
| (mJy) | |||
| – | |||
| is the flux of the secondary and is the total flux | |||
Table 2 lists the results of the fitting procedure. The model light curves are shown as solid lines in Fig. 1. Our results indicate that the secondary star is responsible for and of the total brightness in the and bands, respectively, in agreement with the results of Szkody & Mateo (1986) and F99. Littlefair et al. (2001) fitted an M4V type star to the band spectrum of IP Peg to find that the secondary star contributes of the total light at that wavelength. However, as pointed out by Harrison et al. (2005a, b), the depth of the absorption lines from the secondary star in CVs are reduced with respect to isolated stars of similar spectral type, perhaps by some atmospheric effect. In this case, attempts to match the depth of the absorption lines will systematically underestimate the contribution of the secondary star to the total light. This effect may account for the lower contribution inferred by Littlefair et al. (2001). Alternatively, the different inferred contributions could be a consequence of changes is disc brightness with time, with a slightly brighter disc leading to a lower secondary star relative contribution at the epoch of the observations of Littlefair et al. (2001). It is hard to test this possibility because IP Peg is at the limit of detection for amateur astronomer while in quiescence, showing a typical scatter of mags in its historical light curve. We analyzed the AAVSO historical light curve of IP Peg and found no discernible (larger than mag) difference in brightness state between the epochs of the observations of F99, Littlefair et al (2001) and this work.
The fitted Gaussian spot on the inner face of the secondary star is roughly centered at the L1 point and gives a negligible contribution to the total flux in all bands within the uncertainties, indicating that irradiation effects are not significant in the IR continuum.
An inclination versus mass ratio diagram for IP Peg is shown in Fig. 2, where the derived range of values of and for the three bands are depicted. There is good agreement between the results from the three bands, with the dispersion of the mass ratio values being much smaller than the formal errors of the determinations in the and bands. The best fit (lower value) is obtained for the H band data. Because this light curve is the average of data from three orbits, it has the most complete phase coverage, higher S/N, and lower influence from flickering. The and light curves include data from only one orbit with incomplete phase coverage, although the lack of phase coverage of the J band data does not affect the fit of its ellipsoidal variation. In spite of their smaller formal error, the results for the band are less reliable since only a small part of the light curve was used for the fit. Taking into account the constraint derived from the inferred width of the white dwarf eclipse (Sect. 3.1), our best solution is and . This set of parameters is indicated by a filled circle in Fig. 2.
Figure 2 also compares our results with those in the literature. The binary parameters derived from the ellipsoidal variations in the and band data are in reasonably good agreement with those of Wood & Crawford (1986), Beekman et al. (2000) and Watson et al. (2003). The solution of Marsh (1988) relies on inferring the white dwarf radial velocity from the wings of the emission lines from the disc. This technique is prone to large uncertainties, particularly when there is significant phase offset between the spectroscopic inferior conjunction of the secondary star and the observed mid-eclipse time - as it is in the case in IP Peg.

Stellar atmosphere models (e.g. Kurucz 1979) and available stellar atlases (e.g. Strecker et al. 1979) are not suitable for fitting IR fluxes of very cool stars, either because of a poor spectral resolution and sampling in the IR or because the range of temperatures of the grid/atlas does not include stars cooler than . Therefore, we fitted black bodies to the extracted fluxes of the secondary star of IP Peg in order to estimate its temperature and distance. The best fit solution yields and a distance of , assuming (Beekman et al. 2000). The results are consistent with those of Szkody & Mateo (1986).
3.3 3-D eclipse mapping
After subtracting the ellipsoidal variation corresponding to the adopted binary parameters from each light curve, eclipse mapping techniques (Baptista & Steiner 1993) were applied to the residual curves to derive maps of the surface brightness distribution of the IP Peg accretion disc in .
Our eclipse map is a 3D surface consisting of a 51 x 51 pixels disc grid with a half-opening angle (the angle between the midplane and the disc surface) covering the primary Roche lobe (up to ) plus a circular rim of pixels at , the inferred radius of the BS. With this geometry there is no need to extract the orbital hump from the light curve (F99), since it can be accounted for by emission from the circular rim. We also note that this geometry allows the disc brightness distribution to extend beyond the radial position of the BS. The radius of the BS was derived as follows. We measured the BS mid- ingress/egress phases () in the band light curve after correcting for (Sect. 3.1). For the adopted binary geometry (i,q), the pair of () values maps into an x-y position in the orbital plane which consistently falls along the ballistic stream trajectory. The BS radius is taken as the radius of the circle that passes through this position, . The adopted binary geometry and the BS radius are depicted in Fig. 4. For the eclipse mapping modeling, only the data in the phase range [-0.15;0.15] was analyzed.
We performed Monte Carlo simulations to estimate the uncertainties of the reconstructions (Rutten et al. 1992). For a given light curve a set of 100 artificial light curves is generated, in which the data points are independently and randomly varied according to a Gaussian distribution with standard deviation equal to the uncertainty at that point. The light curves are fitted with the eclipse mapping code to produce a set of randomized eclipse maps. These are combined to produce an average map and a map of the residuals with respect to the average, which yields the statistical uncertainty at each pixel. The uncertainties obtained with this procedure are used to draw the contour maps of Fig. 3, and to estimate the uncertainties in the derived radial brightness-temperature distributions (Fig. 5) and the flux-ratio diagram (Fig. 6).
The disc half-opening angle is a free parameter in the problem. The entropy of the eclipse map is a useful tool in gauging the correct value of . Overestimating (underestimating) the disc half-opening angle introduces spurious structures in the disc side closest to (farther from) the L1 point. Because the entropy is a measurement of the smoothness of the eclipse map, these structures are flagged with higher entropy. Therefore, one may estimate the value of by performing a set of reconstructions for a plausible range of and selecting the one with lowest entropy. Simulations (Borges, Baptista & Catalan 2007) show that it is indeed possible to use the entropy as a criterion to infer the value of , but that the map of lowest entropy underestimates the correct by , depending on the binary geometry . We confirmed this finding with careful simulations done with the specific geometry of IP Peg, for which we find the offset to be . In order to infer the value of we used the band light curve, which has the most symmetric eclipse shape and the smallest contribution from the orbital hump. We tested a range of values between with increasing steps of . The map of lowest entropy and highest degree of symmetry is obtained for . According to the above simulations, we adopted for the eclipse mapping reconstructions. This is consistent with computations of vertical disc structure by Meyer & Meyer-Hofmeister (1982), Smak (1992) and Hur & Galliano (2000), which predict for mass accretion rates Ṁ .
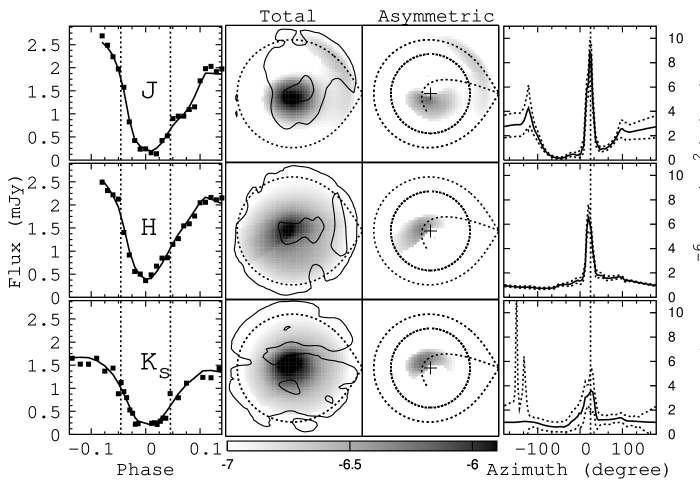
Light curves, corresponding eclipse maps and disc rim brightness distributions are shown in Fig. 3. For a better visualization of structures in the disc brightness distributions the asymmetric disc components are also shown. A symmetric component is obtained by slicing the disc into a set of radial bins and fitting a smooth spline function to the mean of the lower half of the intensities in each bin. The spline-fitted intensity in each annular section is taken as the symmetric disc-emission component. This procedure preserves the baseline of the radial distribution while removing all azimuthal structure. The asymmetric disc component is then obtained by subtracting the symmetric disc from the original eclipse map (Saito & Baptista 2006). The asymmetric disc component accounts for , and of the total flux in , and , respectively.
The maps show enhanced emission along the ballistic stream trajectory close to the white dwarf, providing evidence for gas stream overflow in IP Peg. The maximum of the enhanced emission is wavelength-dependent, occurring farther downstream in than in , possibly because of the progressively larger amount of gravitational energy released in collisions as the stream approaches the white dwarf. This tail of enhanced emission along the ballistic stream ahead of the BS position is reminiscent of that seen in the dwarf nova WZ Sge (Spruit & Rutten 1998; Skidmore et al. 2000). Spruit & Rutten (1998) point out that such a tail is to be expected as a consequence of the post-impact hydrodynamics of the stream.
A BS is expected to form at the intersection of the ballistic stream with the disc outer edge. The ballistic stream hits the disc rim at an azimuth with respect to the line joining both stars 222The difference between the value of for the adopted q=0.42 geometry and for the alternative q=0.5 case (Wood & Crawford 1986) is negligible.. The disc rim distributions (Fig. 3) show a bright spot at an azimuth of with azimuthal extent (full width half maximum) , in reasonable agreement with the predicted position of the BS. The intensity of the spot decreases with increasing wavelength, in accordance with the corresponding reduction in the height of the orbital hump. There is also a tendency for the centroid of the spot to move towards shorter azimuths with increasing wavelengths.
It is interesting to compare the azimuthal position of the BS in the disc rim map with that of the orbital hump maximum. The azimuth of hump maximum is (, Fig. 1), or forward from the azimuth of the BS. Figure 4 shows a schematic diagram of IP Peg, where the offset between the azimuth of the BS and that of the maximum hump emission is clear. A similar effect has been seen in other dwarf novae. If BS emission is produced in a shock between disc and stream gas, the maximum emission will be normal to a direction between the disc and stream flows (Warner 1995, p.81). For example, in OY Car the hump maximum is displaced forward with respect to the azimuth of the BS (Wood et al 1989). The offset in IP Peg is larger. Here, the azimuth of orbital hump maximum coincides with the normal to the gas stream at the BS position, suggesting that the impact shock lays along the stream trajectory with negligible influence from disc material. We note that the phase of maximum of the orbital hump in the NIR-light curves does not coincide with the one in the optical (, see Fig. 1 of Wood & Crawford 1986), as already noticed by F99.

Figure 5 shows the disc radial brightness temperature distributions for an assumed distance of pc. Dotted lines show the law of opaque steady-state discs for mass accretion rates of Ṁ and , assuming (Beekman et al. 2000) and (derived using the white dwarf mass-radius relation of Nauenberg 1972).
The inner disc () shows a flat brightness temperature distribution reminiscent of those seen in quiescent dwarf novae (e.g., Wood et al. 1986, 1989), with inferred temperatures of K at for the bands within the uncertaities. The consistency of the inferred brightness temperatures in the three bands suggests that the inner disc is optically thick with emission close to blackbody. The temperatures decrease in the outer disc regions () in reasonable agreement with the law in the and bands and at a lower shallow gradient in the band. There is marginal evidence333The observed difference in temperature is at the limit. of higher brightness temperatures in the outer disc regions in the band with respect to the and bands. If real, such band excess would indicate that the gas in the outer disc regions is opaque with a vertical temperature gradient (such that the free-free and bound-free opacity minimum at 1.6 microns leads to a relative increase in outcoming flux in the band with respect to the and bands). This is hard to reconcile with the results of Littlefair et al (2001), which suggest that the outer regions of the accretion disc in IP Peg are optically thin, unless the source of the observed mirror eclipses is an optically thin chromosphere above the (optically thick) accretion disc.
A flux-ratio diagram of the accretion disc of IP Peg is shown in Fig. 6. The colors for the symmetric component of the eclipse maps are plotted together with relationships for blackbody (BB), main-sequence stars (MS) and optically thin H I emission (HI). The BB and HI spectra were computed with the synphot/IRAF package. The BB and H I fluxes are extracted by convolving the respective spectrum with the response function of each infrared passband, and the flux ratios are computed. The MS colors were extracted from Bessell & Brett (1988) and transformed to the 2MASS photometric system using the relations of Carpenter (2001). The uncertainties in the disc colors are quite large and increase towards the outer (and fainter) disc regions. The uncertainties in the colors are dominated by the lower S/N of the band light curve and eclipse map. The colors of the symmetric inner disc (R<0.3 ) are consistent with those of cool opaque radiators (with ) at the 1- confidence level. The disc becomes redder (cooler) with increasing radius and starts to deviate from the BB relationship for . The observed trend in outer disc colors is consistent with that inferred from the brightness temperature distributions and again suggests an -band excess flux for the outer disc regions. The disc colors move toward the upper left of the diagram, in the direction opposite to that expected for optically thin gas. While the error bars are large and the diagram should be viewed with caution, the results suggest that the outer disc of IP Peg is opaque with a vertical temperature gradient.

3.4 The secondary eclipse
Figs. 1 and 7 shows the model curve from the ellipsoidal variation together with the data. It is clear from the and -band data that some occulting medium is covering part of the light from the secondary star between phases 0.45 and 0.55. Eclipses of the secondary star by the disc were seen in the -band data of F99 – who pointed out that the shallow depth of the eclipse requires that part of the intervening accretion disc must be optically thin – and also in the spectroscopic data of Beekman et al. (2000) – who deduced that the accretion disc of IP Peg must be opaque to account for the depth of the secondary eclipse. Littlefair et al. (2001) found evidence of an eclipse of the secondary star by optically thin parts of the accretion disc from their -band time-resolved spectroscopy of IP Peg in quiescence. Assuming local thermal equilibrium, they found that the occulting optically thin gas is quite hot (10000 K < T < 20000 K) and accounts for, at least, the outermost 20 per cent of the disc. Here we model the secondary eclipse to infer the colors of the occulted secondary star face and to estimate the radial extent of the opaque occulting disc.
Assuming the binary geometry derived in section 3.2, we simulated the eclipse of the secondary star by an opaque cylinder of radius and half-opening angle and searched for the values of and which minimize the of the fit to the data. In doing this we are making the simplistic assumption that the disc is fully opaque up to a certain radius and becomes fully transparent thereafter. If opacity changes with radius and height above the disc mid-plane one expects that a sizeable fraction of the disc will partially transmit the light from the secondary star and a larger region would be needed to occult the same amount of light. Therefore, our exercise provides a rough lower limit to the size of the opaque occulting disc. Having this in mind, the best-fit solutions are , (corresponding to an occultation of per cent of the secondary star light) and , (occultation of per cent of the secondary star light), respectively, for the and bands. The secondary eclipse and the best-fit model curves are shown in Fig. 7. The model provides a good description of the data for phases but deviates after the eclipse because of the (unaccounted) contribution of the orbital hump to the light curve. Assuming a disc radius of 0.58 , this suggests that at least the inner of the accretion disc is opaque in IP Peg in quiescence.
We fitted a blackbody model to the extracted and band deficit fluxes at mid-secondary eclipse to find a temperature of the occulted, inner hemisphere of the secondary star of . After correcting for the gravity darkening effect, this becomes , consistent at the 1 limit with the blackbody temperature of the (outer hemisphere of the) secondary star derived in section 3.2. The agreement between the inferred temperatures of the inner and outer hemispheres of the secondary star is in line with the conclusion derived from the ellipsoidal variation fit, namely, that illumination effects on the secondary star of IP Peg in quiescence are negligible in the NIR continuum. The occulting area corresponds to per cent of the projected surface of the secondary star at phase 0.5.
4 Discussion
F99 found a double-humped modulation in their -band light curve after subtraction of the ellipsoidal variation from the secondary star (see their Fig.5). There is no evidence of double-humped modulation in our data. Since the phasing of their data was not secured by a clear identification of the white dwarf egress feature, their analysis may be affected by errors in the assumed binary phases. F99 added a phase offset of to their light curves to correct for deviations of the ephemeris. However, precise measurement of white dwarf eclipse egress times from contemporary observations of IP Peg in quiescence indicate a phase offset of for the epoch of the F99 observations (Baptista et al. 2005). Thus, the light curves of F99 are systematically shifted by towards positive phases. Indeed, there is an upward kink in the flux at phase in their data (best seen in their Fig.11) which seemingly corresponds to the white dwarf egress, suggesting a phase offset with respect to the expected white dwarf egress phase. Simulations show that such a small phase offset between the data and the ellipsoidal variation model would be enough to introduce a spurious double-humped modulation in the light curve after removal of the contribution from the secondary star. The phase offset also displaces the whole disc brightness distribution towards the trailing side of the disc (the one containing the gas stream) and would account for much of the offset between the expected position of the BS and the position derived from their eclipse map.

The modeled ellipsoidal variation also indicates that the irradiation of the secondary star surface is negligible in the infrared. This result is in apparent contradiction with those of Davey & Smith (1992) and Watson et al (2003). Despite the differences in the results, both works find a significant decrease in NaI Å line strength over the inner face of the secondary star in IP Peg as a consequence of irradiation effects. We remark that, if the irradiated energy does not penetrate deeply in the atmosphere but mainly heats the upper atmospheric layers, it may reduce the vertical temperature gradient (and, therefore, lead to a decrease in NaI absorption line strength) without affecting the continuum radiation arising from deeper atmospheric layers. This is in line with the investigation of irradiation effects on CV secondaries by Barman, Hauschildt & Allard (2002). Their preliminary study shows that, for a typical CV, irradiation leads to a significant change in the temperature structure of the uppermost atmospheric layers of the secondary star (where the NaI line comes from) leaving the deeper layers (the region where the IR continuum is produced) mostly unaffected.

Our disc temperatures are higher than those inferred by F99. We find temperatures of in all bands while they find temperatures of in . This is in line with the fact that our -band light curve has 2.1 mJy more flux than the 1994 Sep light curve of F99 (at the reference phase , where the contribution of BS anisotropic emission should be minimal). Our data and those of F99 were collected, respectively, 5 and 6 weeks after an outburst. The observed difference in disc temperatures could be explained if the accretion disc of IP Peg slowly cools down during quiescence. Alternatively, the observed difference in light curve flux and disc temperatures could be accounted for by the uncertainty in flux calibration of both works.
5 Summary
We modeled the ellipsoidal variations in light curves of IP Peg to estimate the system parameters and the contribution of the secondary to the total light (Table 2). Using the calibrated fluxes we inferred an equivalent blackbody temperature of , and we derived a distance to the system of pc.
Using 3D eclipse mapping techniques we derived the surface brightness distribution of the IP Peg accretion disc. With the aid of the entropy of the eclipse map, we find a disc half-opening angle of . The disc brightness distribution shows an asymmetric structure along the gas stream trajectory in the inner disc regions close to the white dwarf in all bands (), indicating the existence of gas stream overflow in IP Peg.
The amplitude of the orbital hump decreases with increasing wavelength. The hump is modeled as an extended () bright spot located at the edge of the accretion disc with brightness temperatures of in and and in the band. The phase of maximum of the orbital hump in NIR-light curves, , does not coincide with the one in the optical (, see Fig. 1 of Wood & Crawford 1986) nor does it coincide with the phase of maximum emission of a radially emitting bright spot. The eclipse position of the bright spot differs from its theoretical azimuthal position by and its direction of maximum emission (inferred from the light curve) differs by from the direction of radial emission.
In order to match the depth and width of the secondary eclipse, a sizeable fraction of the accretion disc must be opaque. The inferred temperatures of the inner and outer hemispheres of the secondary star are the same to within the uncertainties, indicating that illumination effects are negligible for the IR continuum.
6 Acknowledgments
We thank Don Hoard for pointing out the reference for the MS IR colors, Frank Gribbin and Chris Benn for useful information about the WHIRCAM, and the anonymous referee for useful comments which helped to improve the presentation of our results. This work was partially supported by CNPq (Brazil) through research grant 62.0053/01-1-PADCT III/Milenio. T.R. acknowledges financial support from CNPq. R.B. acknowledges financial support from CNPq (Brazil) through grants 300.354/96-7 and 200.942/2005-0. This publication makes use of data products from the Two Micron All Sky Survey, which is a joint project of the University of Massachusetts and the Infrared Processing and Analysis Center/California Institute of Technology, funded by the National Aeronautics and Space Administration and the National Science Foundation. In this research we have used, and acknowledge with thanks, data from the AAVSO International Data base, which are based on observations collected by variable star observers worldwide.
References
- (1) Baptista, R. & Steiner, J. E. 1993, A&A, 277, 331.
- (2) Baptista, R., Morales-Rueda L., Harlaftis, E.T., Marsh, T.R., & Steeghs, D. 2005, A&A, 444, 201.
- (3) Barman, T., Hauschildt, P. & Allard, F., 2002, in The Physics of Cataclysmic Variables and Related Objects, ASP Conference Series, Vol. 261, ed. B. T. Gaensicke, K. Beuermann, & K. Reinsch. p. 49.
- (4) Beekman, G., Somers, M., Naylor, T. & Hellier C. 2000, MNRAS, 318, 913.
- (5) Bessell, M. S. & Brett, J. M. 1988, PASP, 100, 1134.
- (6) Borges, B.W., Baptista, R.& Catal n, M.S., 2007, in preparation.
- (7) Carpenter, J. M. 2001, AJ, 121, 2851.
- (8) Claret, A. 1998, A&A, 335, 647.
- (9) Davey, S. & Smith, R.C. 1992, MNRAS, 257, 476
- (10) Diaz-Cordov s, J. & Gim nez, A. 1992, A&A, 259, 227.
- (11) Froning, C.S., Robinson, E.L., Welsh W.F. & Wood, J.H., 1999, AJ, 523, 399 (F99).
- (12) Harrison, T. E.; Osborne, H. L.; Howell, S. B. 2005a, AJ, 129, 2400.
- (13) Harrison, T. E.; Howell, S. B.; Johnson, J. J. 2005b, Bull. Am. Astron. Soc., 207, 7016.
- (14) Hughes, S. M., Roche, P., Dhillon, V. S., 1996, WHIRCAM User’s Guide v1.0, Isaac Newton Group of Telescopes, La Palma
- (15) Hur , J.-M., Galliano F. 2001, A&A, 366, 359.
- (16) Kurucz, R. L. 1979, ApJS, 40, 1.
- (17) Leggett, S.K. 1992, ApJS, 82, 351.
- (18) Littlefair, S.P., Dhillon, V.S., Marsh, T.R. & Harlaftis E. T., 2001, MNRAS, 327, 475.
- (19) Marsh T. R. 1988, MNRAS, 231, 1117.
- (20) Martin, J.S., Jones, D.H.P & Smith, R.C. 1987, MNRAS, 224, 1031.
- (21) Meyer, F. & Meyer-Hofmeister, E. 1982, A&A, 106, 34.
- (22) Nauenberg, M. 1972, ApJ, 175, 417.
- (23) Press, W.H., Flannery, B.P., Teukolsky, S.A., Vetterling, W.T., 1986, Numerical Recipes, Cambridge University Press
- (24) Rutten R.G.M., van Paradijs J. & Tinbergen J., 1992, A&A, 254, 159.
- (25) Saito, R. K. & Baptista, R. 2006, AJ, 131, 2185.
- (26) Sarna, M. J. 1989, A&A, 224, 98.
- (27) Smak, J. I. 1992, IAUS, 151, 83.
- (28) Spruit, H. C. & Rutten R.G.M. 1998, MNRAS, 299, 768.
- (29) Strecker, D.W., Erickson, E.F. & Whitteborn, F.C., 1979, ApJS, 41, 501.
- (30) Skidmore, W., Mason E., Howell, S. B., Ciardi, D. R., Littlefair S. P., Dhillon V. S., 2000, MNRAS, 318, 429.
- (31) Skrutskie M.F. et al. 2006, AJ, 131, 1163.
- (32) Szkody, P. & Mateo M. 1986, AJ, 92, 483.
- (33) Warner, B. 1995, Cataclysmic Variables Stars., Cambridge Univ. Press, Cambridge.
- (34) Watson, C. A., Dhillon, V. S., Rutten, R. G. M., Schwope, A. D., 2003, MNRAS, 341, 129.
- (35) Wolf, S., Mantel, K. H.;Horne, K.; Barwig, H. Shoembs, R.; Baernbantner, O., 1993, A&A, 273, 160.
- (36) Wood, J. H. & Crawford, C. S. 1986, MNRAS, 222, 645.
- (37) Wood, J. H., Horne K., Berriman G., Wade R. A., O’Donoghue D., Warner B., 1986, MNRAS, 219, 629.
- (38) Wood, J. H., Horne K., Berriman G., Wade R. A., 1989, ApJ, 341, 974.