Effect of Disorder and Notches on Crack Roughness
Abstract
We analyze the effect of disorder and notches on crack roughness in two dimensions. Our simulation results based on large system sizes and extensive statistical sampling indicate that the crack surface exhibits a universal local roughness of and is independent of the initial notch size and disorder in breaking thresholds. The global roughness exponent scales as and is also independent of material disorder. Furthermore, we note that the statistical distribution of crack profile height fluctuations is also independent of material disorder and is described by a Gaussian distribution, albeit deviations are observed in the tails.
I Introduction
The statistical properties of fracture in disordered media are interesting for theoretical reasons and practical applications breakdown ; alava06 . An important theoretical issue is represented by the scaling of crack surfaces. Experiments on several materials under different loading conditions have shown that the fracture surface is self-affine man and, in three dimensions, the out of plane roughness exponent displays a universal value of irrespective of the material studied bouch . The scaling regime is sometimes quite impressive, spanning five decades in metallic alloys bouch . In particular, experiments have been done in metals metals , glass glass , rocks rocks and ceramics cera covering both ductile and brittle materials. Later on, a smaller exponent was observed at smaller length scales. It was conjectured that crack roughness displays a universal value of only at larger scales and at higher crack speeds, whereas another roughness exponent in the range of is observed at smaller length scales under quasi-static or slow crack propagation bouch . It was recently shown that the short-scale value is not present in silica glass, even when cracks move at extremely low velocities ponson06 . In addition, in granite and sandstone, one only measures a value of even at high velocities boffa98 ; ponson07 . The current interpretation associates the value with rupture processes occurring inside the fracture process zone (FPZ), where elastic interactions would be screened, and the value with large scale elastic fracture ponson06 ; bonamy06 . In two dimensions, the available experimental results, mainly obtained for paper samples, indicate a roughness exponent in the range kertesz93 ; engoy94 ; salminen03 ; rosti01 .
In this work, we investigate the influence of fracture process zone on crack roughness in two dimensions through two key variables: material disorder, expressed as a distribution in breaking thresholds, and pre-existing notches. Material disorder and the size of pre-existing notches play a significant role in determining the size of the FPZ ahead of the crack tip. When the disorder is weak, the size of the FPZ is small and the material fracture response is dictated by the stress concentrations around the notches. On the other hand, when the disorder is strong, a relatively large fracture process zone is generated ahead of the crack tips. Similarly, the influence of pre-existing notches on FPZ in the presence of disorder is non-trivial. This is especially the case when the initial notch size is small and disorder is sufficiently strong to allow for significant damage accumulation. As the damage starts evolving, multiple cracks develop, which in turn influence the stress concentration around the initial pre-existing notch. Even in the simplest case of non-interacting cracks, the stress fields become additive and hence the proportionality with respect to inverse of square root of the initial notch size is lost. The presence of interacting cracks further complicates this scenario and the stress concentration around notches depends in a non-trivial fashion on the initial notch size. For large notches, the effect of disorder should be weaker since the fracture process is dominated by a single crack.
The question we would like to address is how the roughness of the fracture surfaces depends on the material disorder and the relative sizes of the pre-existing notches, given their influence on fracture process zone. Studies on random fuse model with uniform and power law disorder have indicated that spatial correlations in the damage accumulated prior to the peak load (the maximum load before catastrophic failure) are negligible and that the damage is accumulated more or less uniformly up to the peak load jstat1 . This suggests that the origin of self-affine roughness in the random fuse model should not depend on whether there is strong or weak disorder since the spatial correlations are built in the system only at the final stage of macroscopic failure. Earlier studies that investigated the effect of disorder on crack roughness are controversial: based on two-dimensional disordered beam lattice simulations, Ref. hansenbeam suggested a universal roughness exponent of , whereas using two-dimensional disordered fuse lattice simulations, Ref. zhang argued against the universality of roughness exponent. Clearly, the situation warrants further investigation especially in light of the role played by the FPZ in the current interpretation for different values of the roughness exponents.
II Model
In this paper, we study the effect of disorder and notches on the crack roughness, by numerical simulations of the two-dimensional random fuse model (RFM), where a lattice of fuses with random threshold are subject to an increasing external voltage deArcangelis85 ; hansen001 . The results show that the roughness exponent does not depend on the breaking thresholds disorder strength and on the presence of a notch. We consider a triangular lattice of linear size with a central notch of length . All of the lattice bonds have the same conductance, but the bond breaking thresholds, , are randomly distributed based on a thresholds probability distribution, . The burning of a fuse occurs irreversibly, whenever the electrical current in the fuse exceeds the breaking threshold current value, , of the fuse. Periodic boundary conditions are imposed in the horizontal directions ( direction) to simulate an infinite system and a constant voltage difference, , is applied between the top and the bottom of the lattice system bus bars.
A power-law thresholds distribution is used by assigning , where is a uniform random variable with density and represents a quantitative measure of disorder. The larger is, the stronger the disorder. This results in values between 0 and 1, with a cumulative distribution . The average breaking threshold is , and the probability that a fuse will have breaking threshold less than the average breaking threshold is . That is, the larger the is, the smaller the average breaking threshold and the larger the probability that a randomly chosen bond will have breaking threshold smaller than the average breaking threshold.
Numerically, a unit voltage difference, , is set between the bus bars (in the direction) and the Kirchhoff equations are solved to determine the current flowing in each of the fuses. Subsequently, for each fuse , the ratio between the current and the breaking threshold is evaluated, and the bond having the largest value, , is irreversibly removed (burnt). The current is redistributed instantaneously after a fuse is burnt implying that the current relaxation in the lattice system is much faster than the breaking of a fuse. Each time a fuse is burnt, it is necessary to re-calculate the current redistribution in the lattice to determine the subsequent breaking of a bond. The process of breaking of a bond, one at a time, is repeated until the lattice system falls apart.
Using the algorithm proposed in Ref. nukalajpamg1 , we have performed numerical simulation of fracture up to system sizes . Our simulations cover an extensive parametric space of (, and ) given by: ; ; and . A minimum of 200 realizations have been performed for each case, but for many cases 2000 realizations have been used to reduce the statistical error.
III Crack Roughness
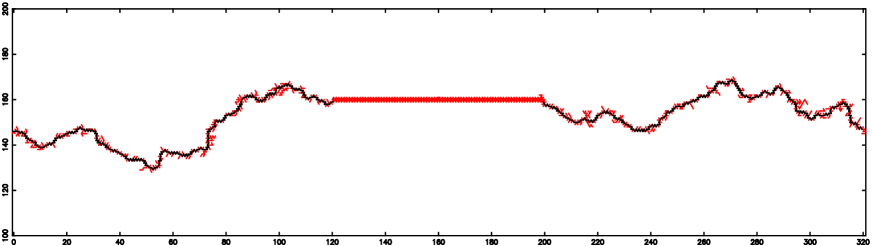
Once the sample has failed, we identify the final crack, which typically displays dangling ends and overhangs (see Fig. 1). We remove them and obtain a single valued crack line , where the values of . For self-affine cracks, the local width, , where the sums are restricted to regions of length and the average is over different realizations, scales as for and saturates to a value corresponding to the global width. The power spectrum , where , decays as . When anomalous scaling is present anomalous ; exp-ano ; exp-ano2 , the exponent describing the system size dependence of the surface differs from the local exponent measured for a fixed system size . In particular, the local width scales as , so that the global roughness scales as with . Consequently, the power spectrum scales as .
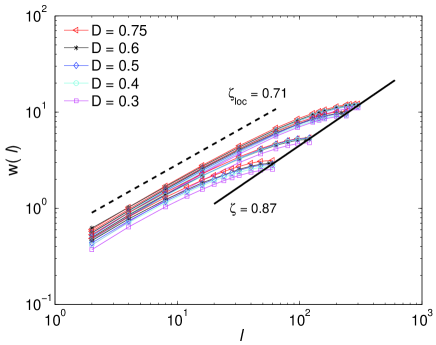
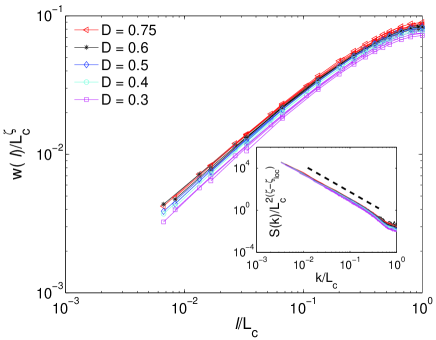
In the following we investigate the influence of disorder and initial notch size on crack roughness. Figure 2a presents the scaling of local and global crack widths in systems with different disorder values and an initial relative notch size of . The slopes of the curves presented in Fig. 2a suggest that the local roughness exponent and is independent of the disorder. The global roughness exponent is estimated to be , and differs considerably from the local roughness exponent . The collapse of the data in Fig. 2b clearly demonstrates that crack widths follow anomalous scaling law. The inset in Fig. 2b reports the data collapse of the power spectra based on anomalous scaling for different disorder values. This collapse of the data once again suggests that local roughness is independent of disorder. A fit of the power law decay of the spectrum yields a local roughness exponent of . This result is in close agreement with the real space estimate and we can attribute the differences to the bias associated to the methods employed sch-95 .
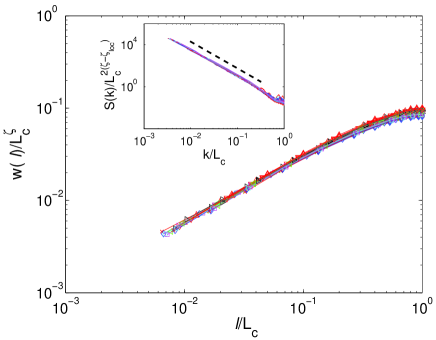
The influence of initial notch size on crack roughness is presented in Fig. 3a. The curves presented in Fig. 3a represent the scaling of local and global widths for various notch sizes . Once again, the local roughness exponent is estimated to be and is independent of the initial notch size, whereas the global roughness exponent . Figure 3b presents the data collapse of crack widths based on anomalous scaling law, which once again confirms that crack roughness follows anomalous scaling. The collapse of the power spectra in the inset of Fig. 3b for different notch sizes confirms that the local roughness is independent of the initial notch size. A fit of the power law decay of the spectrum yields a local roughness exponent value of . The close agreement of these results with the obtained for the unnotched, strong disorder case zapperi05 indicates that the crack roughness is universal and is independent of disorder and initial notch size. The global crack width however scales as with , and is also independent of disorder and crack size.

The scaling properties of the crack profiles can also be studied using the probability density distribution of the height differences of the crack profile between any two points on the reference line (-axis) separated by a distance . Recently, there has been a debate over the scaling of this distribution procaccia ; jstat2 ; santucci , i.e., whether the scaling properties of can be described by a single scaling exponent or multiple scaling exponents are required to describe the scaling of . The self-affine property of the crack profiles implies that the probability density distribution follows the relation
| (1) |
whereas multiscaling of fracture surface implies that Eq. 1 is not valid. Although multiscaling of was argued in Ref. procaccia , it has been shown in references jstat2 ; santucci that follows a self-affine monoscaling relation given by Eq. 1 and that multiscaling is an artefact that results at small scales due to the removal of crack profile overhangs. In the following, we investigate whether disorder has any influence on the scaling of .
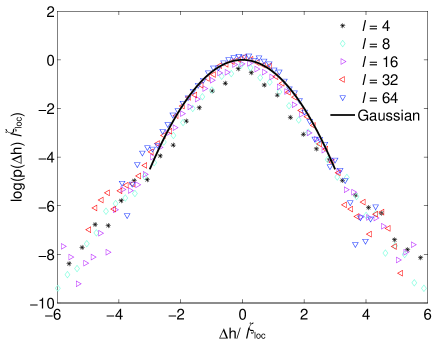
First, we present the probability distributions of the height differences for various bin sizes for a disorder of , a system size of , and a relative crack size of . Figure 4 shows the collapse of the central parts of the probability distributions for larger values, but still within the local width scaling regime. The deviation for smaller values may be attributed to steps in the single-valued crack height profiles, which inevitably arise due to the removal of overhangs on the crack surface. For larger values, the central parts of these distributions approach Gaussian, but clear deviations can be observed in the tails of the distribution from a Gaussian distribution. Similar deviations in the tails were observed for the uniform disorder case as well jstat2 ; santucci .
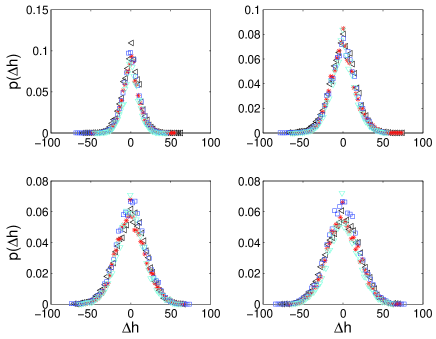
Second, we present the collapse of distributions in Figs. 5(a)-(d) for various bin sizes and disorders. The collapse of these distributions for various disorders at each bin size indicates that distributions and the roughness exponent are unaffected by the material disorder.
IV Discussion
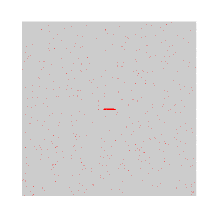
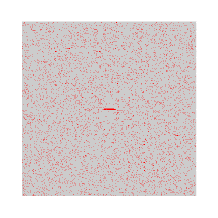
In summary, the evidence presented in this paper indicates that the crack surface roughness is unaffected by the material disorder and the presence of pre-existing notches. This can be inferred from the fact that material disorder, whether strong or weak, has a significant influence on the amount of damage accumulated prior to the peak load; however, the spatial correlations in the damage accumulated prior to the peak load are negligible jstat1 . Indeed, Figs. 6(a)-(d) show the snapshots of damage and crack propagation at peak load in typical fracture simulations of system size having weak to strong disorder and small to large pre-existing notches. By following the damage growth process, one can easily see from these figures that there is very little crack extension at peak load whether the material is strongly disordered or weakly disordered. In addition, Fig. 6 shows that the FPZ can not be defined from a single damage snapshot, but it is necessary to average the damage over many realizations of the disorder. When this is done, we find that depends strongly on disorder (ranging from one to lattice units for the values considered) but only weakly on and alavanew . The independence of the roughness exponent on suggests that self-affinity in the random fuse model is not related to the FPZ.
 |
 |
 |
 |
This is further corroborated by our numerical simulations on a simplified random fuse model in which failure events form a connected crack thereby excluding damage nucleation in the bulk jstat2 . In this model, after breaking the weakest fuse, successive failure events are only allowed on fuses that are connected to the crack. Otherwise, the rules of this simplified model strictly follow those of the usual RFM. Consequently, this model tracks only the connected crack along with its dangling ends in a disordered medium, and hence forms the most simplified model to study the effect of disorder on crack roughness. As was shown in Ref. jstat2 , this simplified model exhibits the same roughness and height-height correlation characteristics as that of conventional RFM. Even for this simplified model, the collapse of the power spectrum and local width of crack profiles for different disorders () results in a roughness exponent value of , which clearly demonstrates once again that disorder is irrelevant for identifying crack roughness exponent.
As also shown in Ref. jstat2 , when the branching of the cracks or damage within the fracture process zone is not allowed thereby limiting the crack extension to only the crack tips, a local roughness exponent of is obtained. But, as soon as branching was present, the value of the roughness exponent was increased from to . This may also explain why there is no transition in the value of the roughness exponent from strong to weak disorder in the presented simulations since damage is always present even for the lowest values of disorders considered. A similar conclusion was reached by Bouchbiner et al. studying a model for crack growth with damage nucleation procaccia2 . According to this work, as soon as a FPZ was introduced in the model the roughness exponent increases from to a higher value. Thus it appears that the roughness exponent in two dimensions does not depend on the size of the FPZ, but only on the fact that a FPZ is present or not. In three dimensions the situation should be different since experiments suggest that the roughness exponent displays a crossover precisely at the FPZ size. It would be interesting to investigate this issue using three dimensional simulations.
Acknowledgment
This research is sponsored by the
Mathematical, Information and Computational Sciences Division, Office
of Advanced Scientific Computing Research, U.S. Department of Energy
under contract number DE-AC05-00OR22725 with UT-Battelle, LLC. MJA and SZ gratefully
thank the financial support of the European Commissions
NEST Pathfinder programme TRIGS under contract NEST-2005-PATH-COM-043386.
MJA also acknowledges the financial support from
The Center of Excellence program of the Academy of Finland.
References
- (1) H. J. Herrmann and S. Roux (eds.), Statistical Models for the Fracture of Disordered Media, (North-Holland, Amsterdam, 1990).
- (2) M. J. Alava, P. K. V. V. Nukala, and S. Zapperi, Advances in Physics 55, 349 (2006).
- (3) B. B. Mandelbrot, D. E. Passoja, and A. J. Paullay, Nature (London) 308, 721 (1984).
- (4) For a review see E. Bouchaud, J Phys. Condens. Matter 9, 4319 (1997). E. Bouchaud, Surf. Rev. Lett. 10, 73 (2003).
- (5) K.J. Maloy, A. Hansen, E.L. Hinrichsen, and S. Roux, Phys. Rev. Lett. 68, 213 (1992); E. Bouchaud, G. Lapasset, J. Planés, and S. Navéos, Phys. Rev. B 48, 2917 (1993).
- (6) P. Daguier, B. Nghiem, E. Bouchaud, and F. Creuzet, Phys. Rev. Lett. 78, 1062 (1997).
- (7) J. Schmittbuhl, S. Roux, and Y. Berthaud, Europhys. Lett. 28, 585 (1994). J. Schmittbuhl, F. Schmitt, and C. Scholz, J. Geophys. Res. 100, 5953 (1995).
- (8) J.J. Mecholsky, D.E. Passoja, and K.S. Feinberg-Ringel, J. Am. Ceram. Soc. 72, 60 (1989).
- (9) L. Ponson, D. Bonamy, and E. Bouchaud, Phys. Rev. Lett. 96, 035506 (2006).
- (10) J. M. Boffa, C. Allain, and J. Hulin, Eur. Phys. J. A 2, 281 (1998).
- (11) L. Ponson, H. Auradou, M. Pessel, V. Lazarus, and J.-P. Hulin, preprint arXiv:0704.2925
- (12) D. Bonamy, L. Ponson, S. Prades, E. Bouchaud, and C. Guillot, Phys. Rev. Lett. 97, 135504 (2006).
- (13) Kertész J, Horvath V K and Weber F 1993 Fractals 1 67
- (14) Engoy T, Maloy K J, Hansen A and Roux S 1994 Physical Review Letters 73 834
- (15) Salminen L I, Alava M J and Niskanen K J 2003 Eur. Phys. J. B 32 369
- (16) Rosti J, Salminen L I, Seppälä E T, Alava M J and Niskanen K J 2001 Eur. Phys. J. B 19 259
- (17) P. K. V. V. Nukala, S. Simunovic, and S. Zapperi, J. Stat. Mech.: Theor. Exp. P08001 (2004).
- (18) B. Skjetne, T. Helle, and A. Hansen, Phys. Rev. Lett. 87, 125503 (2001).
- (19) X. Zhang, M. A. Knackstedt, D. Y. C. Chan, and L. Paterson, Europhys. Lett. 34, 121-126 (1996)
- (20) L. de Arcangelis, S. Redner, and H. J. Herrmann, J. Phys. (Paris) Lett. 46 585 (1985).
- (21) A. Hansen and S. Roux, Statistical toolbox for damage and fracture, 17-101, in book Damage and Fracture of Disordered Materials, eds. D. Krajcinovic and van Mier, Springer Verlag, New York, 2000.
- (22) P. K. V. V. Nukala, and S. Simunovic, J. Phys. A: Math. Gen. 36, 11403 (2003).
- (23) J. M. López, M. A. Rodríguez, and R. Cuerno, Phys. Rev. E 56, 3993 (1997).
- (24) J. M. López and J. Schmittbuhl, Phys. Rev. E 57, 6405 (1998).
- (25) S. Morel, J. Schmittbuhl, J. M. López, and G. Valentin, Phys. Rev. E 58, 6999 (1998).
- (26) J. Schmittbuhl, J. P. Vilotte, and S. Roux, Phys. Rev. E 51, 131-147 (1995).
- (27) S. Zapperi, P. K. V. V. Nukala, and S. Simunovic, Phys. Rev. E 71, 026106 (2005).
- (28) E. Bouchbinder, I. Procaccia, and S. Sela, J. Stat. Phys. 125, 1029 (2006).
- (29) M. J. Alava, P. K. V. V. Nukala, and S. Zapperi, J. Stat. Mech.: Theor. Exp. L10002 (2006).
- (30) S. Santucci, K. J. Maloy, A. Delaplace, J. Mathiesen, A. Hansen, J. O. H. Bakke, J. Schmittbuhl, L. Vanel, and P. Ray, Phys. Rev. E 75, 016104 (2007).
- (31) M. J. Alava, P. K. V. V. Nukala, and S. Zapperi, preprint (2007).
- (32) E. Bouchbinder, J. Mathiesen, and I. Procaccia, Phys. Rev. Lett. 92, 245505 (2004)