The Molonglo Galactic Plane Survey (MGPS-2): Compact Source Catalogue
Abstract
We present the first data release from the second epoch Molonglo Galactic Plane Survey (MGPS-2). MGPS-2 was carried out with the Molonglo Observatory Synthesis Telescope at a frequency of 843 MHz and with a restoring beam of , making it the highest resolution large scale radio survey of the southern Galactic plane. It covers the range and and is the Galactic counterpart to the Sydney University Molonglo Sky Survey (SUMSS) which covers the whole southern sky with ().
In this paper we present the MGPS-2 compact source catalogue. The catalogue has 48 850 sources above a limiting peak brightness of 10 mJy beam-1. Positions in the catalogue are accurate to . A full catalogue including extended sources is in preparation. We have carried out an analysis of the compact source density across the Galactic plane and find that the source density is not statistically higher than the density expected from the extragalactic source density alone.
We also present version 2.0 of the SUMSS image data and catalogue which are now available online. The data consists of 629 mosaic images covering the of sky with and . The catalogue contains 210 412 radio sources to a limiting peak brightness of 6 mJy beam-1 at and 10 mJy beam-1 at . We describe the updates and improvements made to the SUMSS cataloguing process.
keywords:
catalogues – surveys – methods: data analysis – radio continuum: ISM – Galaxy: general1 Introduction
The Galactic plane exhibits radio emission on a wide range of angular scales. To study the range of structures seen, from ultra-compact sources to complex diffuse sources, a survey with both high resolution and good sensitivity to emission on large angular scales is essential. The second epoch Molonglo Galactic Plane Survey (MGPS-2) has better resolution (restoring beam of ) and sensitivity than any previous large scale radio surveys of the southern Galaxy. It is the Galactic counterpart to the Sydney University Molonglo Sky Survey (SUMSS; Bock et al., 1999; Mauch et al., 2003) and between them they cover the whole sky south of at a frequency of 843 MHz. MGPS-2 was carried out over the same period of time as SUMSS, also using the Molonglo Observatory Synthesis Telescope (MOST; Mills, 1981; Robertson, 1991). This paper presents the first data release and compact source catalogue from MGPS-2.
The precursor to MGPS-2 was the original Molonglo Galactic Plane Survey (MGPS; Green et al., 1999) which was carried out at 843 MHz over an eleven year period from 1983 to 1994. This covered the region (, ), at a resolution of . After a major upgrade to extend the diameter of the MOST field of view from to , MGPS-2 was commenced in 1997. It extends the coverage of the MGPS in Galactic latitude to (with , equivalent to ). The boundary between MGPS-2 and SUMSS of was chosen so that the coverage of MGPS-2 is roughly equal to the Zone of Avoidance in which it is difficult to study extragalactic sources due to extinction and confusion from the Galaxy. At the time the survey was designed, this was defined as approximately (see, for example, Lu et al. 1990). Throughout this paper we will refer to the original Molonglo Galactic Plane Survey as MGPS-1, with the new survey being discussed as MGPS-2. An overview of the MGPS-2 survey design is given in Green (1999). Table 1 compares the properties of MGPS-1 and MGPS-2.
Although the extragalactic radio sky is well covered by several surveys at mJy levels — NVSS (Condon et al., 1998), SUMSS (Mauch et al., 2003) and FIRST (Becker et al., 1995) — there have been comparatively few radio surveys of the Galactic plane at equivalent resolution, sensitivity and uv-coverage. The International Galactic Plane Survey has imaged HI and 21 cm continuum emission across the entire Galactic plane. It consists of three individual surveys: the Canadian Galactic Plane Survey (CGPS; Taylor et al., 2003), the VLA Galactic Plane Survey (VGPS; Stil et al., 2006) and the Southern Galactic Plane Survey (SGPS; McClure-Griffiths et al., 2005). These surveys combine single-dish and interferometer data to achieve high (arcminute) resolution while probing a wide range of spatial scales. The Multi-Array Galactic Plane Imaging Survey (MAGPIS; Helfand et al., 2006) is the highest resolution large scale radio survey of the Galactic plane to date. It has an angular resolution of and covers the region (, in the first Galactic quadrant. Table 2 compares MGPS-2 with other radio surveys of the Galactic plane.
| MGPS-1 | MGPS-2 | |
|---|---|---|
| Longitude | ||
| Latitude | ||
| Area surveyed | ||
| Field size | ||
| Number of fields | 455 | 621 |
| Survey | Frequency | Longitude | Latitude | Resolution | Reference |
|---|---|---|---|---|---|
| 7C(G) | 151 MHz | Vessey & Green (1998) | |||
| CGPS | 408 MHz | Taylor et al. (2003) | |||
| MGPS-1 | 843 MHz | Green et al. (1999) | |||
| MGPS-2 | 843 MHz | This paper | |||
| CGPS | 1420 MHz | Taylor et al. (2003) | |||
| SGPS I | 1420 MHz | Haverkorn et al. (2006) | |||
| SGPS II | 1420 MHz | McClure-Griffiths et al. (2005) | |||
| VGPS | 1420 MHz | to | Stil et al. (2006) | ||
| Effelsberg | 2695 MHz | Reich et al. (1990) | |||
| Furst et al. (1990) | |||||
| MAGPIS | 1400 MHz | Helfand et al. (2006) |
Some of the major science goals of MGPS-2 are: to search for young supernova remnants and supernova remnants away from the Galactic plane, to search for pulsar wind nebulae and pulsar counterparts and to use the two-epoch data to study long term variability. Observations of individual MGPS-1 and MGPS-2 fields are separated by 320 years, which gives us a range of variability timescales. In addition we have made repeated observations of several fields on shorter timescales of weeks to months.
One aim of producing a compact source catalogue is to investigate the source density across the plane. Whiteoak (1992) indicated there may be a small excess of non-thermal sources. We investigate this further in Section 7.3. Another aim is that we can detect extragalactic sources in the Zone of Avoidance, that would be undetectable at shorter wavelengths. In addition, the MGPS-2 compact source catalogue complements the SUMSS catalogue released by Mauch et al. (2003).
In Section 2 we give an overview of the survey observations and data reduction. Section 4 describes the algorithms used for source detection, and the construction of the compact source catalogue. We include a description of the SUMSS catalogue as the surveys are closely linked. In Section 5 we present an analysis of the catalogue accuracy and reliability and Section 6 gives the catalogue format. Finally, Section 7 contains our analysis of the data, including the compact source density distribution.
2 Observations
The MOST is an east-west array and so requires 12 hr for a full synthesis. The field of view and synthesised beam are elliptical, being elongated by a factor of in Declination. The detailed technical specifications of the MOST are summarised in Table 3.
| Parameter | Value |
|---|---|
| Centre frequency | 843 MHz |
| Bandwidth | 3 MHz |
| Declination range | to |
| Restoring beam | |
| Field size | |
| Dynamic range (processed data)∗ | 250:1 |
| System noise (after 12 hr) | 12 mJy beam-1 |
| Polarisation | RHC |
∗ The dynamic range in regions away from bright sources.
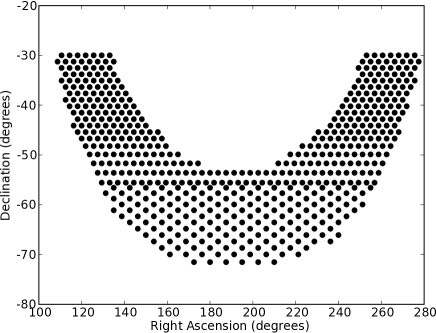
The pointing pattern used for MGPS-2 is shown in Figure 1. The pointing centre grid is different to the SUMSS survey; in SUMSS, the pointing centres were chosen to give uniform signal to noise across all mosaics. However, in the Galactic plane, the limiting factor in the data quality comes from the complexity of Galactic sources, the dynamic range of the telescope, and the limitations in the data reduction for complex sources. Because of this, we make speed of coverage a priority rather than uniform signal to noise and so there is minimal overlap between the fields in the hexagonal pointing grid of MGPS-2. As a result the signal to noise is not as uniform across MGPS-2 as it is for SUMSS.
The rms noise in individual MOST images is a combination of thermal noise and source confusion from both the main beam and sidelobes of the MOST. The noise level varies with Declination, position in the field and operational status of the telescope. The precise operational condition of the telescope electronics and feeds may change during a 12-hour run. Since the telescope is calibrated only at the beginning and end of each run, there may be changes which have a small effect on the sensitivity of any given observation. In the centre of a MOST image the typical rms noise is mJy beam-1 for quiet fields away from bright complex regions. However, in MGPS-2 the sensitivity is dynamic range limited rather than noise limited.
The MOST data are reduced using a custom process described in Bock et al. (1999). The calibration of the images in both position and flux density is based on observations of a sample of strong unresolved sources (taken from Campbell-Wilson & Hunstead (1994)) that are made before and after each 12 hour synthesis observation.
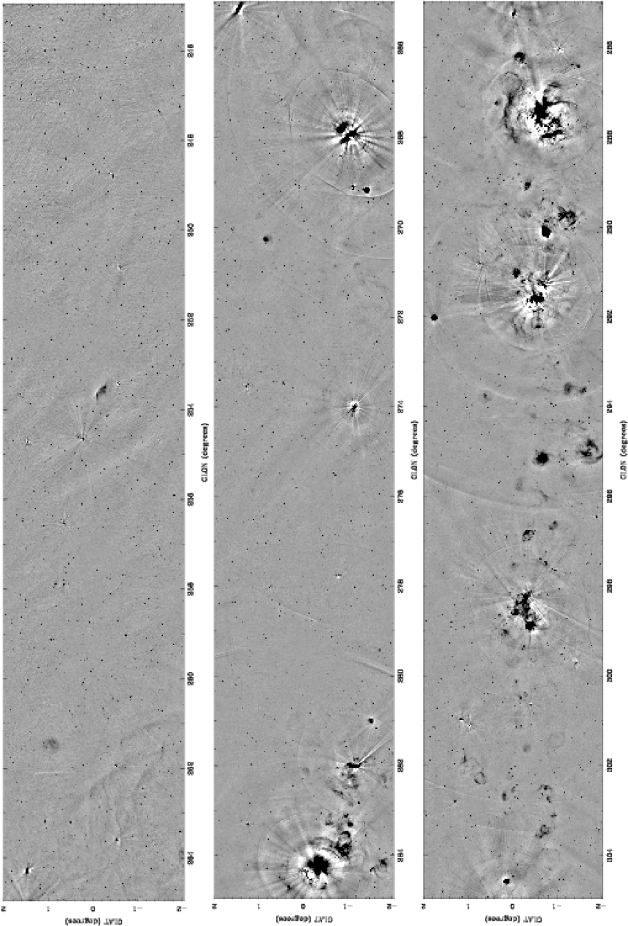
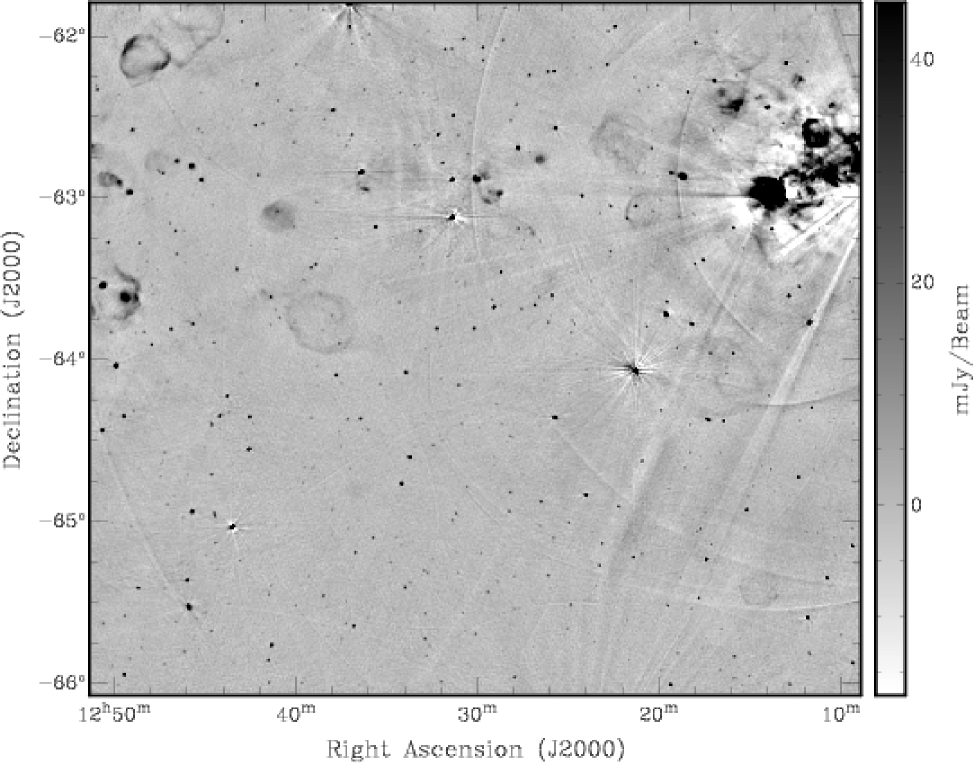
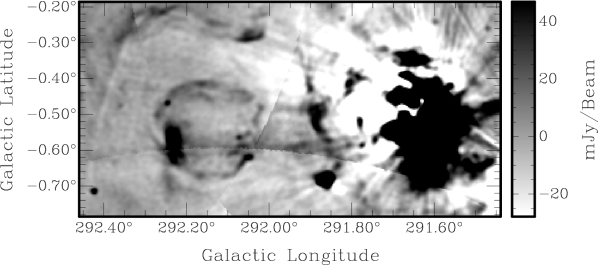
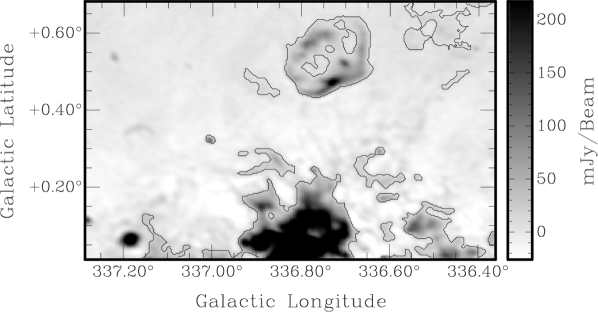
The individual images are combined to make mosaics. This was done to show large scale source distribution and to match with SUMSS. A typical MGPS-2 mosaic J1230M64111The naming scheme for MGPS-2 mosaics is JhhmmMdd where J signifies J2000 coordinates, hhmm is the RA in hours and minutes of the mosaic centre, M signifies southern Declination and dd is the absolute value of the Declination of the mosaic centre in degrees. This has been kept in equatorial coordinates for consistency with SUMSS., is shown in Figure 2.
3 SUMSS
The basic cataloguing method used for MGPS-2 is the same as for the SUMSS catalogue. This was done to ensure as much uniformity between the catalogues as possible. The process is explained fully in Mauch et al. (2003) but we summarise it here. We also give an update on the status of the SUMSS catalogue, which has been updated and improved since Mauch et al. (2003). This is discussed in Section 3.2.
3.1 The SUMSS catalogue
The outputs from the custom MOST data reduction process are mosaics. The SUMSS cataloguing software runs the aips tool vsad (written for the NVSS survey; Condon et al. 1998) over these mosaics to produce a preliminary source list. vsad fits an elliptical Gaussian to all points above a given cutoff. The parameters of each Gaussian returned by vsad are the J2000 right Ascension and Declination (degrees), peak brightness (mJy beam-1), total flux density (mJy), FWHM fitted source major and minor axes (arcseconds) and the fitted position angle of the major axis (degrees east from north).
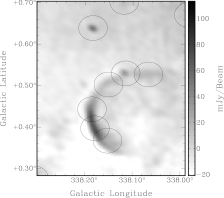
As discussed in Section 3 of Mauch et al. (2003) the SUMSS and MGPS-2 mosaics have various artefacts in them. These are caused by grating rings and radial spokes and are a problem for cataloguing because vsad incorrectly extracts multiple point sources for these artefacts. Examples of these artefacts are shown in Figure 3.
Mauch et al. (2003) presented the solution to this problem, which was to train a decision tree classifier on a set of manually classified sources, and then apply it to the rest of the catalogue. They estimated the classification accuracy of the decision tree at around 96 per cent. More details of the cataloguing process are discussed in Mauch et al. (2003), including the process for removing duplicate sources from the regions in which the mosaics overlap.
3.2 SUMSS status
SUMSS observations were completed in early 2007 and a full complement of 629 mosaic images covering the of sky with and have been made available online. A full release of the SUMSS catalogue was built on 2007 August 8 using all of the released mosaics. It contains 210 412 radio sources to a limiting peak brightness of 6 mJy beam-1 at and 10 mJy beam-1 at . We have made minor improvements and changes to the catalogue pipeline since the previous version described in Mauch et al. (2003). These changes are as follows:
-
1.
As reported by Klamer et al. (2006), around 20 per cent of the flux densities in the region are larger than expected by a few per cent. This problem was related to the ellipticity of the MOST beam at more northern declinations and arises from an assumption in vsad which was optimised for the circular beam of the NVSS survey. We have corrected this problem and revised the flux densities of affected sources in the catalogue.
-
2.
We have revised the decision tree and added a further 1000 sources to the training set. The original decision tree was found to be performing poorly for rare source types with no examples in the training set. We have visually inspected SUMSS images extensively and believe the decision tree now performs well across the entire survey. The results of decision tree classification listed in Table 1 of Mauch et al. (2003) remain the same and we estimate its accuracy to be 96 per cent.
-
3.
We have added one further large diffuse source (IC 4296) which was fitted badly by vsad. As with the sources added by hand in earlier versions of the SUMSS catalogue we have not assigned a peak amplitude or a source size, only a position and total flux density. The flux densities of these sources have been calculated by summing the the pixels inside a manually defined source area.
The present version of the SUMSS catalogue (version 2.0) supersedes all previous versions and should be used whenever possible. Users of prior catalogue releases should note that the described changes to the pipeline may have caused some measured positions or flux densities to change by more than their previously quoted error.
4 Catalogue construction
Extracting sources from astronomical images is a well studied problem. Most of the existing tools (e.g. vsad, imsad, SeXtractor) work well for compact sources, but are not adequate for more diffuse and extended sources. Hence the catalogue creation process is more involved when dealing with images of the Galactic plane, which is dominated by extended, diffuse objects.
In the previous section we described the SUMSS cataloguing process used in Mauch et al. (2003) which is the basis for our MGPS-2 cataloguing process. Here we describe the modifications to the method required for the MGPS.
4.1 The MGPS-2 catalogue
In the SUMSS catalogue about 90 per cent of sources were unresolved point sources. Most of the remaining sources were only slightly extended, with only 1 per cent being resolved along both axes. Hence the cataloguing process described above, based largely on the point source extraction tool vsad, performed well. For the region the MGPS-2 compact source catalogue was produced using the unmodified SUMSS cataloguing software, in which the accuracy of the source classification is estimated to be around 96 per cent (Mauch et al., 2003).
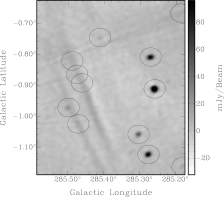
However, within 2 degrees of the Galactic plane there are a large number of extended and diffuse sources which makes the cataloguing for MGPS-2 less straightforward. There are also a large number of negative bowls around bright extended sources, which are an observational artefact. As explained in Green et al. (1999) the MOST does not measure the autocorrelation of its elements, or correlations on baselines shorter than . The effect of this is that structures on angular scales larger than are not detected and all sources are surrounded by a ‘bowl’ of negative flux density. The CLEANing process takes care of this for all but the brightest sources, by interpolating for the unmeasured short spacings. Hence in the final images, the negative bowls remain around sources with an integrated flux density of mJy beam-1. This is illustrated in Figure 4.
Extended sources present additional problems as vsad identifies multiple point sources which are actually part of the same extended source. To solve this we developed new cataloguing software based on the flood fill algorithm, which works as follows:
-
1.
Find each pixel above the peak cutoff level.
-
2.
Explore the region around each peak pixel, ‘filling’ the pixels around the peak in each direction until a minimum cutoff level is reached.
-
3.
Each filled region is then considered a source.
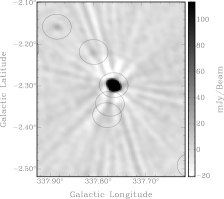
Note that the peak cutoff level used is constant across the survey and is not adjusted for local variations in base level. An example of the results is shown in Figure 5.
This process extracts all the sources independently from vsad and can then be used in combination with the vsad identification. Each source from the preliminary catalogue (produced with the SUMSS cataloguing software) is associated with a filled region. If the size of that region is significantly larger than a beam size, the source is classified as extended. Otherwise it is classified as compact. For the purpose of the present source catalogue, only the latter sources are included. Extended sources will be dealt with in a subsequent publication. In extremely complex regions we will use visual inspection and cross-matching with source catalogues at other frequencies (e.g. mid-infrared) to identify the sources.
For the region the MGPS-2 compact source catalogue was produced using the method outlined above. We checked a randomly selected subset of sources by hand and from that we estimate the accuracy of this method to be about 93 per cent. This is quite variable depending on the proximity of Galactic plane emission. In regions away from the complex sources the accuracy is typically around 96 per cent whereas in complex Galactic plane regions it can be as low as 86 per cent.
In addition, there are three regions of significant diffuse emission that occur outside the region. These are caused by the Puppis-A supernova remnant, the Vela supernova remnant and the radio galaxy PKS 161060. In these regions we manually classified the sources for the compact source catalogue.
4.2 Noise
The rms noise varies throughout the MGPS-2 mosaics. In particular there is higher background noise in regions around bright sources. Away from the plane this is quite localised, but close to the plane () this extends throughout most of the mosaics due to the presence of a large number of bright, extended sources.
To determine a threshold below which sources are discarded from the catalogue, we estimated the median rms noise over the whole survey region. We calculated the rms noise around each source by defining a pixel box centred on the source, and fitting a histogram to the pixels in the residual image. The residual image is produced by vsad during the cataloguing process and consists of the original mosaics with all detected sources subtracted.
The median rms noise in the region is 1.6 mJy beam-1. In the region it is 2.1 mJy beam-1. Using a limit for the catalogue gives us a catalogue flux density threshold of 10 mJy beam-1. We have chosen this relatively conservative limit of at least because the rms noise in the images can increase significantly close to bright extended sources.
A small number of sources have an rms noise significantly higher than the median values quoted about. These are mostly due to a neighbouring bright source with artefacts (as discussed in Section 3.1).
5 Accuracy
The errors given in the catalogue are a combination of fitting uncertainties and calibration uncertainties of the MOST. The fitting uncertainties were determined in the same way as for the SUMSS and NVSS catalogues, using equations derived in Condon (1997). For weaker sources ( mJy) the calibration uncertainties of the MOST are negligible and the fitting uncertainties dominate. For stronger sources ( mJy) the calibration uncertainties dominate. The calculations for MGPS-2 follow those of SUMSS. The process is discussed in detail in Section 4 of Mauch et al. (2003) but it is outlined again here for completeness.
5.1 Positional uncertainties
The fitting variances in the source positions are given by:
| (1) |
| (2) |
where the rms noise-like uncertainties of the fitted major and minor axes ( and , respectively) are derived using equation 25 of Condon (1997). PAF is the fitted position angle of the source in degrees east of north.
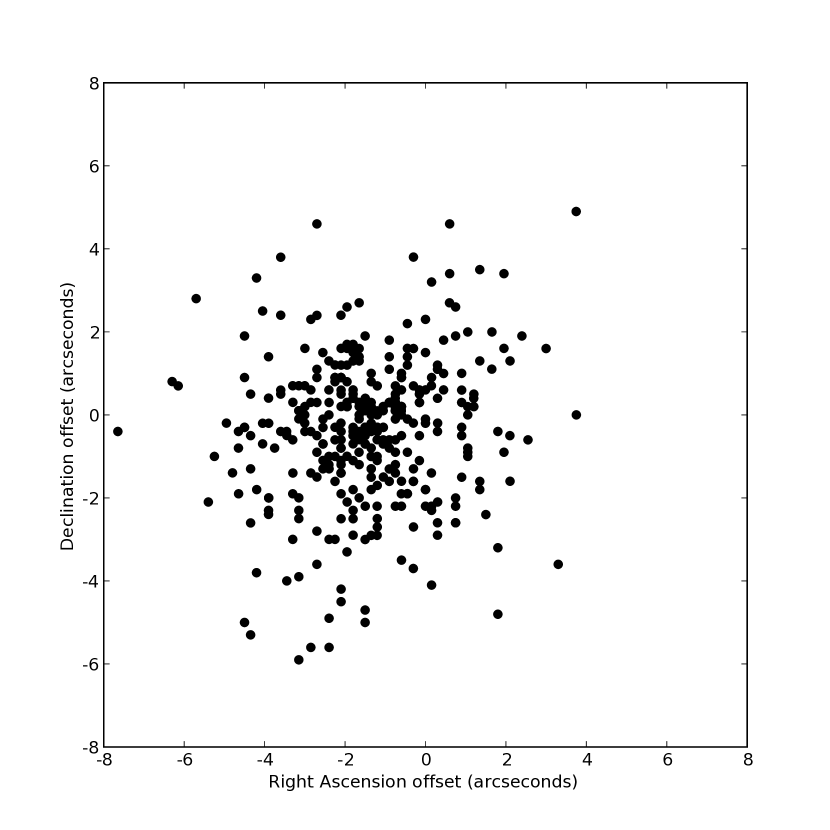
We have determined the calibration uncertainty for strong sources ( mJy) by repeating the analysis of Mauch et al. (2003) for the MGPS-2 region. This was done by comparing the MGPS-2 positions with those from the NVSS catalogue in the overlap region between MGPS-2 and NVSS (). The positions of strong sources in the NVSS catalogue are accurate to within (Condon et al., 1998). For this analysis we used only point sources to avoid the larger positional errors associated with extended sources. We define a point source as one in which the fitted major () and minor () axes of the source do not exceed . This definition is explained in the next section. There are 356 sources that meet these criteria, all of which had an NVSS counterpart. Figure 6 shows the offsets in Right Ascension () and Declination () between NVSS and MGPS-2. The mean offsets are and .
The mean RA offset of is of some concern, and different to the value reported in Mauch et al. (2003). We repeated the analysis with bright SUMSS point sources in the SUMSSNVSS overlap region and found mean offsets of and . As an additional check we compared the positions of the International Celestial Reference Frame (ICRF) defining calibrators (Fey et al., 2004) (of which there are 40 with ) with the corresponding SUMSS and MGPS-2 sources. This gave mean offsets of and . However, the RA offset results showed a trend with Declination, with for and for . This suggests that the underlying problem is Declination dependent, and the positional accuracy is worst in the NVSS overlap region.
The rms of the offsets between the MGPS-2 and ICRF catalogues have been used as a measure of the MGPS-2 positional uncertainties. These are for Right Ascension and for Declination. However, there is also a systematic positional offset which depends on Declination and can be as high as . This problem is likely to be caused by something in the telescope itself or the reduction software and could not be isolated by our initial investigation. The problem is consistent with a small error in the time stamp of each sample, of order 0.1 seconds. As we do not fully understand the cause of this offset, and to remain consistent with the SUMSS catalogue, we have decided to not to remove this offset from the published positions.
5.2 Source sizes
To determine if a source in the catalogue is significantly resolved we compare the errors (, ) of the fitted major and minor axes (, ) for each source with the size of the beam. As discussed in Condon et al. (1998), the probability that the fitted size of a point source would be larger than the beam by more than is less than 2 per cent. Hence we compare the beam plus to determine if a source is resolved along either axis.
Sources for which either axis is believed to be resolved are then deconvolved and values for the deconvolved major axis, minor axis and position angles are given in the catalogue. No source sizes are given for unresolved sources. Users of the catalogue should note that the deconvolved source sizes are only indicative of whether the source is extended or not. Checking the original images is recommended for confirmation of detailed source properties.
5.3 Flux densities
There are two main sources of error in the quoted flux densities: the relative flux density calibration uncertainty of the MOST () and the local noise uncertainty (). The local noise uncertainty is calculated as
| (3) |
where is the effective signal to noise ratio in the presence of correlated Gaussian noise with length scale and is given by
| (4) |
where is the fitted major axis and is the fitted minor axis. is the peak brightness of the fitted Gaussian, and is the local rms noise as defined in Section 4.2.
The relative flux density calibration was calculated by Mauch et al. (2003) using data from an analysis of the Molonglo calibrators by Gaensler & Hunstead (2000). The average scatter in repeated observations of the calibrators over a 12 year period was found to be around 3 per cent. This value was adopted as the relative calibration uncertainty of MOST peak brightness measurements. The peak brightness uncertainties in the MGPS-2 catalogue were obtained by adding and in quadrature.
As an additional check on the likely variability of flux density measurements for non-calibrator sources, we have looked at sources in one field of MGPS-2 that was repeatedly observed over the duration of the survey. This field, centred at was observed 19 times between 2004 and 2007. There were 28 sources with peak flux density mJy beam-1 that appeared in each repeat observation of the field. Using these sources, we found the average rms difference to be around 5 per cent. This is slightly higher than for the Molonglo calibrator sources.
The integrated flux density of the source is calculated from the Gaussian fit performed by vsad. We use the same method for deriving the integrated flux density as used for the NVSS (Condon et al., 1998). It should be noted that the quoted flux density uncertainties do not take into account the errors which arise from fitting extended or complex structures with an elliptical Gaussian model. Although significantly extended sources are not included in the MGPS-2 catalogue, this effect also applies to slightly extended sources, for which the quoted errors may not be reliable.
6 Catalogue Format
Table 4 shows the first page of the MGPS-2 catalogue. The format is similar to the SUMSS catalogue format, with additional columns giving Galactic coordinates. A short description of the columns of the catalogue follows.
Column (1): The MGPS-2 source name.
Columns (2) & (3): The Galactic longitude () and latitude () of the source.
Columns (4) & (5): The Right Ascension () and Declination () of the source in J2000 coordinates.
Column (6): The uncertainty in Right Ascension () in arcseconds, calculated from the quadratic sum of the MOST Right Ascension calibration uncertainty and equation 1.
Column (7): The uncertainty in Declination () in arcseconds, calculated from the quadratic sum of the MOST Declination calibration uncertainty and equation 2.
Column (8) & (9): The peak brightness () in units of mJy beam-1 and its associated uncertainty () calculated as described in Section 5.3.
Column (10) & (11): The total flux density () in units of mJy and its associated uncertainty () calculated from the equations described in Condon (1997).
Columns (12) & (13): The fitted major & minor axes (, ) of the source in arcseconds.
Column (14): The fitted major axis position angle (PAF) of the source in degrees east of north. Most unresolved sources would have PAF values close to 0∘ or 180∘ since the MOST elliptical beam has PA.
Column (15): The major axis size () in arcseconds, after deconvolution from the MOST beam — given if the fitted major axis size exceeds the beam size by more than .
Column (16): The deconvolved minor axis size () in arcseconds. If the major axis is resolved the minor axis is subsequently checked using the same criterion, and the deconvolved size given.
Column (17): Deconvolved position angle (PAS) in degrees east from north — given if the major axis is resolved.
Column (18): The name of the mosaic in which the source appears. The original mosaics are available online. In the case where a source appears in two mosaics (due to overlap), the mosaic name quoted is the one for which the fitted parameters are listed in the catalogue.
Column (19): The number of mosaics in which the source appears. Sometimes a source can appear in multiple mosaics because of a small overlap region used to ensure all sources are properly imaged and not truncated. The source parameters which appear in the catalogue are those for the most reliable fit.
Columns (20) & (21): The x & y pixel positions of the source on the quoted mosaic.
MGPS-2 catalogue sources should be referred to by their full IAU designation (Lortet et al., 1994). These are of the form MGPS JHHMMSSDDMMSS where MGPS is the survey acronym, J specifies J2000.0 coordinate equinox, HHMMSS are the hours, minutes and truncated seconds of Right Ascension, is the sign of Declination and DDMMSS are the degrees, minutes and truncated seconds of Declination. These are given in column 1 of Table 4.
7 Analysis
7.1 Completeness
The completeness of the survey in the region should be the same as for SUMSS, as identical techniques were used to produce both catalogues, and that region is largely unaffected by Galactic plane emission. Mauch et al. (2003) found SUMSS to be better than 99 per cent complete above 8 mJy beam-1 in southern mosaics () and above 18 mJy beam-1 for more northern mosaics ().
In the region completeness is difficult to calculate because of the presence of extended diffuse sources and the negative bowls around large bright sources. In regions of both high positive and substantial negative flux density it would be impossible to detect point sources at the level of our cutoff (10 mJy beam-1).
As a result we have taken a dual approach. We have first created a mask for all regions in which it would be impossible to detect sources down to our flux density limit. Inside the masked areas it is not possible to measure completeness. Compact sources detected in these regions may still be included in the catalogue, but users should note that the catalogue is incomplete in these regions.
Outside the masked areas we calculated completeness using a simulation. We injected 1000 artificial sources into a selection of residual mosaics (mosaics after all sources fitted by vsad had been removed). The flux distribution of the sources followed that given in Large et al. (1991). We then calculated the fraction of these artificial sources that were found by our cataloguing process. At the flux density cutoff (10 mJy beam-1) the completeness is approximately 80 per cent, rising to greater than 99 per cent at 20 mJy beam-1.
7.2 MGPS-MRC cross-match
As an additional check of catalogue completeness for brighter sources, we have crossmatched the MGPS-2 catalogue with the Molonglo Reference Catalogue (MRC) (Large et al., 1981; Large et al., 1991). The MRC covers the southern sky, excluding the Galactic plane (). The MRC was made from resolution observations at 408 MHz using the Molonglo Cross radio telescope, the previous incarnation of the MOST. It is complete to Jy at 408 MHz and has a limiting flux of Jy. Assuming a typical spectral index of we expect the faintest MRC sources to appear in the MGPS-2 catalogue at around mJy, which implies that all MRC sources within the MGPS-2 survey region should appear in our catalogue.
There are a total of 456 MRC source that fall in the region of the MGPS-2. Of these, 453 sources had a MGPS-2 match within . Of the 3 sources with no match, two were excluded from our catalogue as they were extended sources:
-
•
MRC B1610605, a head-tail radio galaxy (Jones & McAdam, 1994)
-
•
MRC B0821428, the Puppis-A supernova remnant (Green, 1971)
The other object (MRC B0819300B) was resolved as a double source by the MOST beam and so has two counterparts in MGPS-2. Hence the MGPS-2 catalogue is complete for bright sources.
7.3 Compact source density
Analysis from earlier radio surveys of the Galactic plane suggested the presence of a small overdensity of compact sources along the Galactic plane (e.g. Whiteoak, 1992). In this section we investigate the variation in density of the the MGPS-2 compact sources with Galactic latitude.
Calculating the source density in the Galactic plane region is non-trivial because of the large number of diffuse extended objects, and the regions of negative emission around strong sources. We started with the assumption that for all regions covered with emission mJy beam-1 and all negative bowls mJy beam-1 it would be impossible to detect sources at our 10 mJy beam-1 cutoff level. Using the flood fill method described in Section 4.1 we were able to identify all extended regions of positive or negative emission, which were then excluded when calculating the sky area.
In regions away from the plane (i.e. ) we would expect the compact source density to agree with the predicted extragalactic source density. Mauch et al. (2003) found a source density of over a area of sky which the SUMSS survey had completed at the time of publication. An updated value that we have calculated using the entire area of the SUMSS survey, is .
The error quoted for the SUMSS source densities is based on Poisson statistics alone. A more accurate estimate of the error (which includes systematic errors, effects due to clustering and random fluctuations in the source density) is given by the variance between measurements of the source density in different regions of the sky. Figure 7 shows the source density for point-like sources (i.e. those included in this catalogue) as a function of Galactic latitude. The scatter in the data points clearly exceeds that predicted by Poisson statistics — where is the number of sources in the latitude bin. The standard deviation of the data points is , which gives a more suitable estimate of the variance than the Poisson error alone. For the region we calculate a source density of . Considering this scatter, our estimate of the extragalactic source density is in agreement with that from Mauch et al. (2003) and our latest calculations using the full SUMSS catalogue.
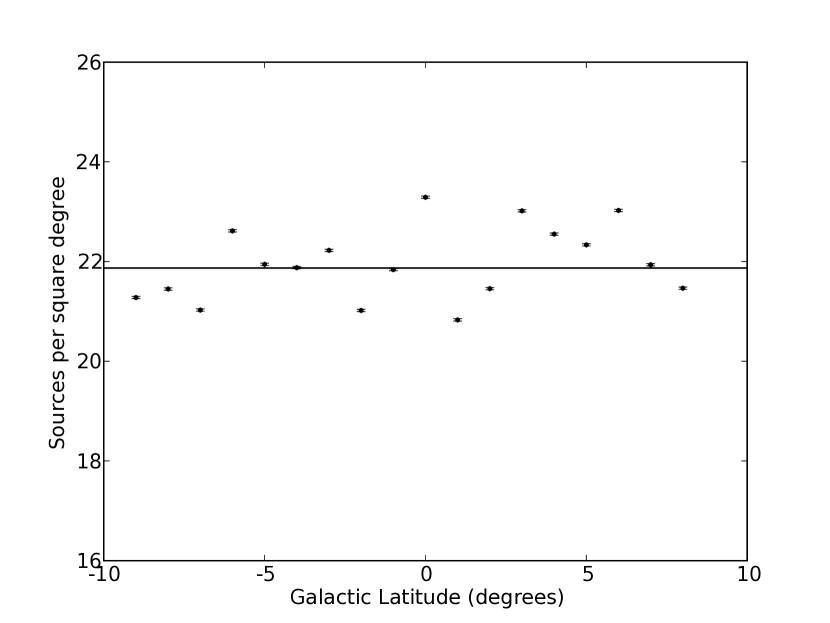
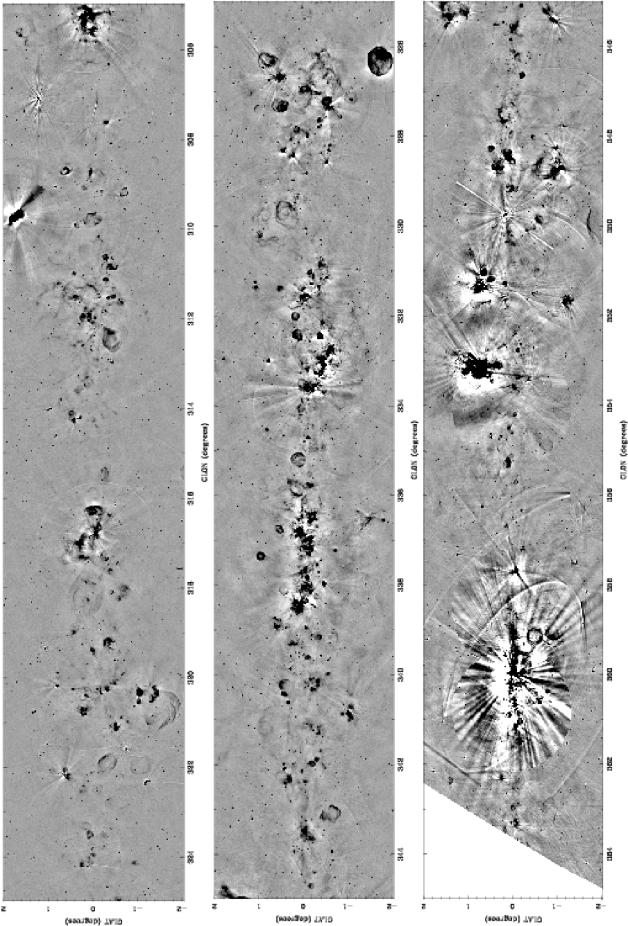
As shown in Figure 7, we find no significant overdensity of compact sources in the Galactic plane. This is in agreement with Helfand et al. (2006) who find no significant dependence on Galactic latitude for their compact source counts. Inspection of Galactic plane observations (such as in Figures 8 and 9) clearly reveal an overdensity of sources close to the Galactic equator. In light of this, our results are not intuitive, but they can be explained. Firstly, small diameter Galactic sources (e.g. young supernova remnants and ultra-compact HII regions) are not distributed evenly throughout the Galaxy. They tend to occur in and around large complexes of star formation (Weiler & Sramek, 1988). Many of these regions of extended diffuse emission are masked out and excluded from our analysis, as described above. Secondly, the expected number density of most small diameter Galactic sources is less than the systematic errors in our source density values. For example, in the ATNF Pulsar Catalogue222http://www.atnf.csiro.au/research/pulsar/psrcat/ of Manchester et al. (2005) there are 635 pulsars that fall within the bounds of MGPS-2. Of these, we have detected 93 that have mJy beam-1 and that fall in a non-masked region. This is a number density of , which is well below the systematic error levels in our results above. Likewise for supernova remnants, Helfand et al. (1989) predict (as a rough estimate) that there are around 200 missing supernovae in the Galactic plane. This is an upper limit for our purposes, since many of these are likely to be too extended to include in our compact source catalogue. So, again, this number of additional Galactic sources would fit well below the systematic error levels of our source density calculation.
8 Summary and Future Work
The main data product of MGPS-2 are 130 mosaics which we have released online. Note that some of the mosaics fall across the survey boundary and have been released as part of the SUMSS survey.
We have created a catalogue of compact sources covering the 2400 deg2 of the MGPS-2 survey. A future release will include diffuse and extended sources. The limiting peak brightness of the catalogue is 10 mJy beam-1. We have calculated the compact source density in bins of Galactic latitude and found it agrees within the errors with the expected source density for extragalactic sources. This implies that even close to the Galactic plane the majority of compact sources in the radio sky are extragalactic. The reason we see no overdensity is that highly complex regions of emission were masked out and excluded from the analysis, and this is where compact HII regions and young supernova remnants are likely to occur.
Users of the catalogue should note that for some sources (especially those which are slightly resolved) the quoted uncertainties may be underestimates of the true uncertainties. Users are encouraged to check the mosaics directly if in doubt.
Following on from this compact source catalogue there will be a catalogue and census of extended sources in the Galactic plane, particularly young supernova remnants and pulsar wind nebulae. Future work with MGPS-2 will look at the physical processes producing the observed large scale structures, and look at structures in which the radio–FIR correlation breaks down. We will use the current catalogue to search for ultra-compact HII regions, believed to be signposts of the early stages of massive star formation.
The MOST itself is undergoing redevelopment to produce a new low frequency spectral line capability with dual polarisation feeds. As the Square Kilometre Array Molonglo Prototype (SKAMP; Adams et al., 2004), it will be used to map out magnetic field structures and test theories of mass assembly of galaxies at when the Universe was roughly half its current age.
Acknowledgments
The Molonglo Observatory site manager, Duncan Campbell-Wilson, and the staff Rodger Ashwell, Adrian Blake and Tim Hubbard, and former staff Jeff Webb, Michael White and John Barry, are responsible for the smooth operation of the MOST telescope and the day to day observing program of the SUMSS and MGPS-2 surveys. We would also like to thank Tony Turtle for his work on the scheduling of the surveys. The MOST is operated with the support of the Australian Research Council and the School of Physics within the University of Sydney. Tara Murphy acknowledges the support of an ARC Australian Postdoctoral Fellowship.
References
- Adams et al. (2004) Adams T. J., Bunton J. D., Kesteven M. J., 2004, Experimental Astronomy, 17, 279
- Becker et al. (1995) Becker R. H., White R. L., Helfand D. J., 1995, ApJ, 450, 559
- Bock et al. (1999) Bock D. C.-J., Large M. I., Sadler E. M., 1999, AJ, 117, 1578
- Campbell-Wilson & Hunstead (1994) Campbell-Wilson D., Hunstead R. W., 1994, Proceedings of the Astronomical Society of Australia, 11, 33
- Condon (1997) Condon J. J., 1997, PASP, 109, 166
- Condon et al. (1998) Condon J. J., Cotton W. D., Greisen E. W., Yin Q. F., Perley R. A., Taylor G. B., Broderick J. J., 1998, AJ, 115, 1693
- Fey et al. (2004) Fey A. L., Ma C., Arias E. F., Charlot P., Feissel-Vernier M., Gontier A.-M., Jacobs C. S., Li J., MacMillan D. S., 2004, AJ, 127, 3587
- Furst et al. (1990) Furst E., Reich W., Reich P., Reif K., 1990, A&AS, 85, 691
- Gaensler & Hunstead (2000) Gaensler B. M., Hunstead R. W., 2000, Publications of the Astronomical Society of Australia, 17, 72
- Green (1971) Green A. J., 1971, Australian Journal of Physics, 24, 773
- Green (1999) Green A. J., 1999, in Taylor A. R., Landecker T. L., Joncas G., eds, ASP Conf. Ser. 168: New Perspectives on the Interstellar Medium The Molonglo Galactic Plane Surveys. p. 43
- Green et al. (1999) Green A. J., Cram L. E., Large M. I., Ye T., 1999, ApJS, 122, 207
- Haverkorn et al. (2006) Haverkorn M., Gaensler B. M., McClure-Griffiths N. M., Dickey J. M., Green A. J., 2006, ApJS, 167, 230
- Helfand et al. (2006) Helfand D. J., Becker R. H., White R. L., Fallon A., Tuttle S., 2006, AJ, 131, 2525
- Helfand et al. (1989) Helfand D. J., Velusamy T., Becker R. H., Lockman F. J., 1989, ApJ, 341, 151
- Jones & McAdam (1994) Jones P. A., McAdam W. B., 1994, Proceedings of the Astronomical Society of Australia, 11, 74
- Klamer et al. (2006) Klamer I. J., Ekers R. D., Bryant J. J., Hunstead R. W., Sadler E. M., De Breuck C., 2006, MNRAS, 371, 852
- Large et al. (1991) Large M. I., Cram L. E., Burgess A. M., 1991, The Observatory, 111, 72
- Large et al. (1981) Large M. I., Mills B. Y., Little A. G., Crawford D. F., Sutton J. M., 1981, MNRAS, 194, 693
- Lortet et al. (1994) Lortet M.-C., Borde S., Ochsenbein F., 1994, A&AS, 107, 193
- Lu et al. (1990) Lu N. Y., Dow M. W., Houck J. R., Salpeter E. E., Lewis B. M., 1990, ApJ, 357, 388
- Manchester et al. (2005) Manchester R. N., Hobbs G. B., Teoh A., Hobbs M., 2005, AJ, 129, 1993
- Mauch et al. (2003) Mauch T., Murphy T., Buttery H. J., Curran J., Hunstead R. W., Piestrzynski B., Robertson J. G., Sadler E. M., 2003, MNRAS, 342, 1117
- McClure-Griffiths et al. (2005) McClure-Griffiths N. M., Dickey J. M., Gaensler B. M., Green A. J., Haverkorn M., Strasser S., 2005, ApJS, 158, 178
- Mills (1981) Mills B. Y., 1981, Proceedings of the Astronomical Society of Australia, 4, 156
- Reich et al. (1990) Reich W., Fuerst E., Reich P., Reif K., 1990, A&AS, 85, 633
- Robertson (1991) Robertson J. G., 1991, Australian Journal of Physics, 44, 729
- Stil et al. (2006) Stil J. M., Taylor A. R., Dickey J. M., Kavars D. W., Martin P. G., Rothwell T. A., Boothroyd A. I., Lockman F. J., McClure-Griffiths N. M., 2006, AJ, 132, 1158
- Taylor et al. (2003) Taylor A. R., Gibson S. J., Peracaula M., Martin P. G., Landecker T. L., Brunt C. M., Dewdney P. E., Dougherty S. M., Gray A. D., Higgs L. A., Kerton C. R., Knee L. B. G., Kothes R., Purton C. R., Uyaniker B., Wallace B. J., Willis A. G., Durand D., 2003, AJ, 125, 3145
- Vessey & Green (1998) Vessey S. J., Green D. A., 1998, MNRAS, 294, 607
- Weiler & Sramek (1988) Weiler K. W., Sramek R. A., 1988, ARA&A, 26, 295
- Whiteoak (1992) Whiteoak J. B. Z., 1992, A&A, 262, 251
Table 4. The first page of the MGPS-2 compact source catalogue.
| (1) | (2) | (3) | (4) | (5) | (6) | (7) | (8) | (9) | (10) | (11) | (12) | (13) | (14) | (15) | (16) | (17) | (18) | (19) | (20) | (21) |
| IAU designation | (J2000) | (J2000) | Mosaicf | #f | x-pix | y-pix | ||||||||||||||
| ″ | ″ | mJy beam-1 | mJy | ″ | ″ | ∘ | ″ | ″ | ∘ | |||||||||||
| MGPS J071450330700 | 245.155 | 9.972 | 07 14 50.01 | 33 07 00.6 | 2.2 | 2.4 | 24.6 | 1.3 | 24.6 | 1.3 | 84.9 | 58.5 | 138.5 | 0.0 | 0.0 | — | J0712M32 | 1 | 510.8 | 180.0 |
| MGPS J071512331111 | 245.254 | 9.932 | 07 15 12.51 | 33 11 11.4 | 2.3 | 2.1 | 22.7 | 1.3 | 22.7 | 1.3 | 84.9 | 49.2 | 118.1 | 0.0 | 0.0 | — | J0712M32 | 1 | 485.3 | 167.8 |
| MGPS J071525330343 | 245.161 | 9.836 | 07 15 25.71 | 33 03 43.3 | 2.3 | 2.7 | 22.5 | 1.3 | 22.5 | 1.3 | 84.9 | 63.4 | 156.9 | 0.0 | 0.0 | — | J0712M32 | 1 | 469.9 | 189.3 |
| MGPS J071536332226 | 245.461 | 9.940 | 07 15 36.16 | 33 22 26.5 | 2.1 | 2.3 | 28.0 | 1.3 | 31.4 | 1.5 | 84.9 | 66.1 | 139.3 | 0.0 | 0.0 | — | J0712M32 | 1 | 458.9 | 135.2 |
| MGPS J071600325703 | 245.113 | 9.679 | 07 16 00.00 | 32 57 03.5 | 2.3 | 2.5 | 28.3 | 1.4 | 31.4 | 1.6 | 84.9 | 68.7 | 143.8 | 0.0 | 0.0 | — | J0712M32 | 1 | 430.5 | 208.4 |
| MGPS J071601325124 | 245.029 | 9.633 | 07 16 01.48 | 32 51 24.5 | 1.5 | 1.8 | 102.1 | 3.3 | 120.9 | 3.9 | 90.6 | 55.0 | 167.7 | 0.0 | 0.0 | — | J0712M32 | 1 | 428.4 | 224.7 |
| MGPS J071650340139 | 246.172 | 9.997 | 07 16 50.22 | 34 01 39.0 | 3.5 | 2.5 | 10.5 | 1.0 | 10.5 | 1.0 | 84.9 | 46.0 | 75.2 | 0.0 | 0.0 | — | J0712M32 | 2 | 377.0 | 21.5 |
| MGPS J071657330639 | 245.348 | 9.571 | 07 16 57.16 | 33 06 39.3 | 1.5 | 1.8 | 67.0 | 2.2 | 67.0 | 2.2 | 84.9 | 47.5 | 5.8 | 0.0 | 0.0 | — | J0712M32 | 1 | 365.6 | 180.3 |
| MGPS J071705335242 | 246.059 | 9.885 | 07 17 05.01 | 33 52 42.0 | 2.2 | 2.6 | 23.1 | 1.2 | 23.1 | 1.2 | 84.9 | 62.2 | 20.7 | 0.0 | 0.0 | — | J0712M32 | 1 | 359.7 | 47.2 |
| MGPS J071707325429 | 245.179 | 9.450 | 07 17 07.05 | 32 54 29.2 | 3.9 | 3.0 | 11.2 | 1.1 | 11.8 | 1.2 | 84.9 | 49.8 | 69.7 | 0.0 | 0.0 | — | J0712M32 | 1 | 353.5 | 215.4 |
| MGPS J071730334543 | 245.992 | 9.755 | 07 17 30.22 | 33 45 43.3 | 3.5 | 3.6 | 16.6 | 1.2 | 24.0 | 1.8 | 84.9 | 76.2 | 127.3 | 0.0 | 0.0 | — | J0712M32 | 1 | 330.7 | 67.2 |
| MGPS J071731324109 | 245.015 | 9.275 | 07 17 31.47 | 32 41 09.1 | 4.1 | 4.1 | 17.6 | 1.7 | 21.4 | 2.1 | 84.9 | 65.8 | 130.1 | 0.0 | 0.0 | — | J0712M32 | 1 | 324.6 | 253.8 |
| MGPS J071755331653 | 245.595 | 9.463 | 07 17 55.82 | 33 16 53.1 | 2.1 | 3.2 | 13.3 | 1.0 | 13.3 | 1.0 | 84.9 | 46.5 | 174.2 | 0.0 | 0.0 | — | J0712M32 | 1 | 299.4 | 150.3 |
| MGPS J071811334824 | 246.096 | 9.648 | 07 18 11.14 | 33 48 24.9 | 2.8 | 3.2 | 21.9 | 1.5 | 21.9 | 1.5 | 84.9 | 67.2 | 152.2 | 0.0 | 0.0 | — | J0712M32 | 1 | 284.5 | 59.1 |
| MGPS J071819334633 | 246.081 | 9.609 | 07 18 19.33 | 33 46 33.4 | 1.5 | 1.7 | 367.5 | 11.1 | 384.2 | 11.6 | 84.9 | 59.0 | 134.5 | 0.0 | 0.0 | — | J0712M32 | 1 | 275.1 | 64.4 |
| MGPS J071903332957 | 245.899 | 9.349 | 07 19 03.47 | 33 29 57.7 | 4.8 | 4.5 | 10.7 | 1.3 | 11.3 | 1.4 | 84.9 | 55.5 | 51.2 | 0.0 | 0.0 | — | J0712M32 | 1 | 223.5 | 111.9 |
| MGPS J071904345732 | 247.227 | 9.994 | 07 19 04.18 | 34 57 32.2 | 3.4 | 4.2 | 13.9 | 1.4 | 13.9 | 1.4 | 76.6 | 56.6 | 20.3 | 0.0 | 0.0 | — | J0712M36 | 1 | 231.0 | 612.7 |
| MGPS J071906342641 | 246.762 | 9.759 | 07 19 06.50 | 34 26 41.4 | 2.6 | 4.0 | 14.5 | 1.4 | 17.2 | 1.7 | 88.8 | 48.1 | 169.6 | 0.0 | 0.0 | — | J0712M36 | 1 | 225.5 | 711.6 |
| MGPS J071912334933 | 246.209 | 9.466 | 07 19 12.43 | 33 49 33.6 | 4.9 | 4.3 | 10.5 | 1.4 | 10.5 | 1.4 | 84.9 | 51.5 | 124.0 | 0.0 | 0.0 | — | J0712M32 | 1 | 215.2 | 55.2 |
| MGPS J071918340657 | 246.481 | 9.577 | 07 19 18.23 | 34 06 57.4 | 1.7 | 1.8 | 71.3 | 2.7 | 77.8 | 2.9 | 76.6 | 50.5 | 105.8 | 0.0 | 0.0 | — | J0712M36 | 1 | 210.3 | 774.6 |
| MGPS J071922341214 | 246.568 | 9.603 | 07 19 22.74 | 34 12 14.2 | 1.5 | 1.7 | 172.7 | 5.5 | 186.8 | 5.9 | 76.6 | 58.2 | 131.6 | 0.0 | 0.0 | — | J0712M36 | 1 | 205.8 | 757.7 |
| MGPS J071925340056 | 246.402 | 9.509 | 07 19 25.81 | 34 00 56.2 | 1.5 | 1.7 | 186.0 | 5.8 | 199.1 | 6.2 | 84.9 | 50.3 | 108.6 | 0.0 | 0.0 | — | J0712M32 | 2 | 201.2 | 22.2 |
| MGPS J071944322754 | 245.027 | 8.758 | 07 19 44.61 | 32 27 54.2 | 7.5 | 5.9 | 15.0 | 2.7 | 18.2 | 3.3 | 84.9 | 58.1 | 112.7 | 0.0 | 0.0 | — | J0712M32 | 1 | 170.6 | 290.8 |
| MGPS J071954341207 | 246.616 | 9.504 | 07 19 54.29 | 34 12 07.2 | 1.5 | 1.7 | 302.3 | 9.3 | 331.6 | 10.2 | 76.6 | 57.5 | 128.1 | 0.0 | 0.0 | — | J0712M36 | 2 | 170.2 | 757.6 |
| MGPS J071959350449 | 247.422 | 9.878 | 07 19 59.57 | 35 04 49.3 | 2.2 | 1.9 | 37.7 | 2.0 | 37.7 | 2.0 | 76.6 | 45.0 | 87.1 | 0.0 | 0.0 | — | J0712M36 | 2 | 169.9 | 588.7 |
| MGPS J072002342120 | 246.768 | 9.548 | 07 20 02.29 | 34 21 20.6 | 5.3 | 4.3 | 12.3 | 1.8 | 13.0 | 1.9 | 76.6 | 50.5 | 64.4 | 0.0 | 0.0 | — | J0712M36 | 2 | 162.2 | 728.0 |
| MGPS J072004343735 | 247.018 | 9.660 | 07 20 04.90 | 34 37 35.5 | 4.4 | 3.0 | 11.1 | 1.4 | 11.1 | 1.4 | 76.6 | 45.1 | 92.4 | 0.0 | 0.0 | — | J0712M36 | 2 | 161.0 | 675.9 |
| MGPS J072005351416 | 247.574 | 9.930 | 07 20 05.36 | 35 14 16.0 | 6.5 | 5.8 | 10.1 | 1.9 | 10.1 | 1.9 | 76.6 | 51.1 | 124.8 | 0.0 | 0.0 | — | J0712M36 | 1 | 164.5 | 558.3 |
| MGPS J072006343027 | 246.912 | 9.602 | 07 20 06.75 | 34 30 27.0 | 3.1 | 3.1 | 19.9 | 1.6 | 20.9 | 1.7 | 76.6 | 55.7 | 129.5 | 0.0 | 0.0 | — | J0712M36 | 2 | 158.2 | 698.7 |
| MGPS J072009335332 | 246.358 | 9.320 | 07 20 09.20 | 33 53 32.3 | 2.2 | 2.2 | 46.7 | 2.4 | 51.4 | 2.7 | 84.9 | 57.1 | 124.4 | 0.0 | 0.0 | — | J0712M32 | 4 | 151.4 | 43.1 |