The Coolest Stars in the Clouds: Unusual Red Supergiants in the Magellanic Clouds
Abstract
Red supergiants (RSGs) are a He-burning phase in the evolution of moderately high mass stars (10-25 solar masses). The evolution of these stars, particularly at low metallicities, is still poorly understood. The latest-type RSGs in the Magellanic Clouds are cooler than the current evolutionary tracks allow, occupying the region to the right of the Hayashi limit where stars are no longer in hydrostatic equilibrium. We have discovered four Magellanic Cloud RSGs in this region that display remarkably similar unusual behavior. All of the, show considerable variations in their magnitudes and effective temperatures (and spectral types). Two of these stars, HV 11423 and [M2002] SMC 055188, have been observed in an M4.5 I state, considerably later and cooler than any other supergiant in the SMC. These stars suffer dramatic physical changes on timescales of months - when they are at their warmest they are also brighter, more luminous, and show an increased amount of extinction. This variable extinction is characteristic of the effects of circumstellar dust, and can be connected with sporadic dust production from these stars in their coolest states. We suggest that these unusual properties are indicative of an unstable (and short-lived) evolutionary phase not previously associated with RSGs, and consider the implications such behavior could have for our understanding of the latest stages of massive star evolution in low-metallicity environments.
Institute for Astronomy, University of Hawaii
Lowell Observatory
National Optical Astronomy Observatories
GRAAL, Université de Montpellier II, CNRS
1. Introduction
Red supergiants (RSGs) are a He-burning phase in the evolution of moderately high mass stars (10-25). Until recently, the location of RSGs on the H-R diagram was not accurately reproduced by stellar evolutionary theory, with the stars characterized as too cool and too luminous to agree with the predictions of the evolutionary tracks. This places them at odds with the restrictions imposed by the Hayashi limit, which denotes the largest radius a star of a given mass can have while still remaining in hydrostatic equilibrium (Hayashi & Hoshi 1961). Stars which are cooler than the tracks allow inhabit the region to the right of this limit on the H-R diagram, suggesting that they are not in hydrostatic equilibrium.
There are many explanations as to why RSGs might occupy this “forbidden” region of the H-R diagram. RSGs present significant challenges to evolutionary theory. The velocities of the convective layers are nearly sonic and even supersonic in the atmospheric layers, giving rise to shocks (Freytag, Steffen, & Dorch 2002) and invalidating mixing-length assumptions. There is poor knowledge of RSG molecular opacities. Finally, the highly-extended atmospheres of these stars differ from the plane-parallel geometry assumption of the evolutionary models. As a result of these uncertainties, the error could lie in the position of the evolutionary tracks on the H-R diagram. Another possibility is that the “observed” location of RSGs in the H-R diagram is incorrect as a result of inaccurate effective temperatures - past effective temperature scales for red supergiants have been based on temperatures from broadband colors, which are highly sensitive to surface gravity and the adopted reddening for the sample (Massey 1998; Levesque et al. 2005). Finally, it is possible that some stars might truly occupy this region, suggesting that they are unusual stars in a unique and unstable evolutionary state.
2. Milky Way Red Supergiants
To shed some light on this debate, Levesque et al. (2005) redetermined the effective temperature scale for RSGs in the Milky Way. We fit moderate-resolution optical spectrophotometry of 74 Galactic RSGs with the new generation of MARCS stellar atmosphere models (Gustafsson et al. 2003; Plez et al. 1992), which include a much improved treatment of molecular opacities (Plez 2003; Gustafsson et al. 2003). With these models we were able to use the rich and temperature-sensitive TiO molecular bands to measure their effective temperatures. The newly derived physical parameters brought the location of the RSGs into much better agreement with the predictions of stellar evolutionary theory - there is now excellent agreement between Milky Way supergiants and the evolutionary tracks. This suggests that, on the whole, the theoretical models do a good job of accurately reproducing this stage of massive star evolution in the Milky Way. However, there are occasional exception to this that must be considered.
2.1. VY Canis Majoris
VY Canis Majoris is a peculiar late-type M supergiant in the Milky Way. It has several physical characteristics unique among its counterparts, mostly related to its unusual circumstellar environment. It has a large IR excess, making it one of the brightest 5-20 m objects in the sky, indicative of a dust shell or disk being heated by the star (Herbig 1970). Such a dust shell is overwhelmingly present - the RSG is surrounded by an asymmetric dust-reflection nebula that extends 8”-10” from the star (Monnier et al. 1999; Smith et al. 2001; Smith 2004; Humphreys et al. 2005). Its mass-loss rate is quite high for a RSG, about 2 10 yr-1 (Danchi et al. 1994). The photometric history of this star dates back to 1801; the star has faded by about 2 mag during that time but has showed little change in its color (Robinson 1970, 1971; Massey et al. 2006).
This star is often assumed to have extraordinary physical properties (Le Sidaner & Le Bertre 1996; Smith et al. 2001; Monnier et al. 2004; Humphreys et al. 2005). Its assumed effective temperature for many years was a remarkably cold 2800 K, a value adopted by Le Sidaner & Le Bertre (1996) said to be based on the star’s assigned M4 I spectral type (the effective temperature scale of Dyck et al. (1974) is cited, but the 2800 K effective tempearature they report is much cooler than the 3400 K that the Dyck scale associates with M4 supergiants). VY CMa’s luminosity is often cited as approximately = -8.5 to -9.5. With such a high luminosity and cold temperature, this places VY CMa in a considerably cooler and more luminous position that current evolutionary tracks allow, inhabiting the previously mentioned Hayashi forbidden region (Figure 2).. Such a star would have a radius of 1800 to 3000 , making it far bigger than the largest RSGs described in Levesque et al. (2005) and far outside the limitations of evolutionary theory.
A proper understanding of this star’s physical properties hinges on an accurate determination of its effective temperature. In Massey et al. (2006) we used the same method of model fitting to redetermine VY CMa’s temperature spectroscopically. A satisfactory fit of = 3650 K was quickly obtained. We reclassified the star’s spectral type as an M2.5 I based on the strength of the TiO bands typically used for such a classification ( 6158, 6658, 7054; see Jaschek & Jaschek 1990) - this spectral type and effective temperature agree excellently with the effective temperature scale for Milky Way RSGs. Since many earlier studies describe VY CMa as an M3 I to M5 I supergiant (Joy 1942; Wallerstein 1958; Humphreys 1974) based on blue (photographic) spectrograms, we also used the TiO bands further to the blue ( 4761, 4954, 5167) to assign a spectral type and temperature, and arrived at a spectral type of M4 I (in good agreement with earlier studies) and a = 3450 K, a cooler (and poorer overall) temperature that is still much higher than the commonly-adopted 2800 K temperature of Le Sidaner & Le Bertre (1996). From these temperatures we calculated a = -7.2 for the red TiO bands, and = -6.9 for the blue TiO bands, as described in Massey et al. (2006).
With these new physical parameters, we found that VY CMa now occupied a much less surprising region of the H-R diagram (see Figure 1). The new and derived from spectral fitting place the star comfortably in agreement with the rightmost reaches of the 15 M⊙ evolutionary tracks.

However, our method seems to have underestimated the luminosity of the star, and Roberta Humphreys (private communication) was kind enough to call this to our attention. We can demonstrate the problem like so:
From JHK, Massey et al. (2005) were able to determine the properties of the dust shell, and found an effective temperature of 760 K and an area that is 2155 times that of the star’s area. This leads to an interesting contradiction: the luminosity of the dust shell must be 4x that of the star, or about . If the star’s luminosity is the only source of the heating of the dust, and the dust is in thermal/radiative equilibrium with its surrounds, then this is very hard to understand.
It is clear that something has caused us to underestimate the luminosity of the star. One explanation would be if the star’s dust had a larger grain size distribution than normal, and that its extinction was much “greyer” than normal as a result. This would require a lot of extra extinction - about 1.5-2.0 mag - but would present one way out of this conundrum.
Despite our error in determining the luminosity of the central star in this unusual object, it should be pointed out that a change in bolometric luminosity on the H-R digram shifts the location of VY CMa upward on the H-R diagram but does not disrupt its position with respect to the Hayashi limit, as its temperature still places it solidly at the edge of higher-mass evolutionary tracks, where it remains in hydrostatic equilibrium. Even if the proposed upper limit on the bolometric luminosity of = -9.5 is considered, we can still see that the star would simply move from being a stable highly-evolved 15 M⊙ RSG to being a stable highly-evolved 25 M⊙ RSG - its maximum radius would still only about about 1200 R⊙ and it would still remain comfortably in hydrostatic equilibrium at the limits of the Hayashi track.
3. Magellanic Cloud Red Supergiants
With this newfound agreement between the Milky Way RSGs and their evolutionary tracks, we turned out attention to a similar problem for RSGs in the Magellanic Clouds (Levesque et al. 2006). From Massey & Olsen (2003) we find that again the evolutionary tracks for the Large and Small Magellanic Clouds (LMC and SMC, respectively) do not extend to cool enough temperatures to accomodate the “observed” locations of RSGs in the H-R diagram. We applied the same fitting method described above and in Levesque et al. (2005), obtaining moderate-resolution spectrophotometry of 36 LMC RSGs and 37 SMC RSGs using the R-C spectrograph on the CTIO Blanco 4 m telescope in November and December of 2004. We fit these data with the MARCS models to redetermine the effective temperature scales for RSGs in the Clouds. The new effective temperature scales (see Figure 2) brought the MC RSGs into much better agreement with stellar evolutionary theory. The current agreement in the LMC is good, while the agreement in the SMC is improved but still not satisfactory, with SMC RSGs showing a considerably larger spread in effective temperatures across a given luminosity than their LMC counterparts. Such a spread is expected, however, due to the larger effects of rotational mixing in lower metallicity stars - for more discussion see Levesque et al. (2006).

4. Late-Type Red Supergiants in the Clouds
When comparing RSGs in the Milky Way and the Clouds, Elias et al. (1985) note an interesting shift in the spectral types of these stars, with the average RSG spectral subtype shifting towards earlier types at lower metallicities. More precisely, the average RSG subtype is found to be K5-K7 I in the SMC, M1 I in the LMC, and M2 I in the Milky Way (Massey & Olsen 2003). Levesque et al. (2006) find two distinct explanations for this shift. The spectral subtype of late K- and M-type stars is primarily based on the strengths of the TiO bands, which are sensitive to both effective temperature chemical abundances. We see that the average spectral subtype shifts to earlier types (and weaker TiO) bands in the lower-metallicity environments ( = 0.2 for the SMC and = 0.5; Westerlund 1997), suggesting that this shift in type is symptomatic of lower chemical abundances and weaker TiO lines at a given effective temperature. This is well-illustrated in Figure 2, where we can see that a RSG with an effective temperature of 3650 K would be assigned a spectral type of M2 I in the Milky Way, M1.5 I in the LMC, and K5-M0 I in the SMC. It is important, however, to note that this explanation does not accomodate the full range of effects that metallicity imposes on massive stellar evolution.
Figure 10 of Levesque et al. (2006) compares the evolutionary tracks for the Milky Way, the = 0.5 LMC, and the 0.2 SMC. There is a clear shift of the Hayashi limit - the coolest tip of the tracks - to warmer temperatures at lower metallicity. For a 15-25 M⊙ star we see a shift in the coolest effective temperatures for RSGs of about 100-150 K from the Milky Way to the LMC, and about 500 K from the Milky Way to the SMC. In agreement with the speculation offered by Elias et al. (1985), this does an excellent job of explaining the observed shift in spectral subtypes. Following this explanation, one would expect that the shifting of the Hayashi limit to warmer tempeartures at lower metallicity would therefore impose a hard limit on how cold, and hence how late-type, RSGs can be in a particular environment.
Despite this expected restriction imposed by the Hayashi limit, there are several late-type RSGs in the Clouds that are considerably later than the average spectral subtype, cooler than the current evolutionary tracks allow and occupying the “forbidden” region to the right of the Hayashi track. We speculated that these might not all be true members of the Clouds - instead, they could be foreground halo giants. Alternatively, they could present a challenge to our understanding of evolutionary theory. We decided to investigate these most unusual Cloud RSGs in more detail (Levesque et al. 2007). We obtained moderate-resolution spectrophotometry of seven late-type RSGs in the LMC and five late-type RSGs in the SMC in December of 2005, using the RC spectrograph on the 4-m Blanco telescope. We fit the spectra using the MARCS stellar atmosphere models described above and probed their physical properties to better understand the nature of these unusually cool stars. The stars selected in our sample, and the physical properties derived from the spectral fitting, are given in Table 1 - several stars in the sample had been previously observed in the Levesque et al. (2006) November/December 2004 run but had not been published.
4.1. Membership in the Magellanic Clouds
One would expect that a magnitude- and color-selected sample of RSG candidates could potentially be contaminated by foreground dwarfs or halo dwarfs and giants. Of these three, foreground dwarfs are by far the major contaminant in studying RSGs in Local Group galaxies (Massey 1998), and can fortunately be easily recognized on the basis of radial velocities. Massey & Olsen (2003) obtained precision radial velocities for a sample of red stars seen towards the Clouds using the CTIO 4-m telescope, and found that most of these stars had radial velocities consistent with those of the Magellanic Clouds, excluding a small fraction (11% for the SMC and 5.3% for the LMC) which had much smaller radial velocities and could be readily identified as foreground dwarfs. The remaining stars could be tentatively identified as true RSG members of the Clouds - however, most of the apparent radial velocity of the Clouds is simply a reflection of the sun’s motion, so this RSG sample could be contaminated by red stars in the Milky Way’s halo. Levesque et al. (2006) estimate that this would be a few percent or less, but we reconsidered the issue when examining these late-type Cloud RSGs.
The sample of stars in Levesque et al. (2006) and Levesque et al. (2007) mostly have 12 14, with a few fainter stars. Their colors are greater than 1.6 (see table 2). According to an updated version of the Bahcall & Soneira (1980) model provided by Heather Morrison, we expect a surface density of halo giants of about 0.2 0.15 deg-2 in this magnitude/color range towards either the LMC or the SMC. The area of the Massey (2002) survey was 14.2 deg2 towards the LMC, and 7.2 deg2 towards the SMC, so we might expect a 0.6% contamination by halo towards the LMC, and a 0.9% contamination towards the SMC. We therefore expect only a fraction of a star in our entire Cloud RSG cample of 85 stars - 73 stars from Levesque et al. (2006) and 12 stars in Levesque et al. (2007). For the sample of 12 late-type RSGs, a 1% contamination (a tenth of a star) is likely a large overestimate, given that the vast majority of halo contaminants have 1.8 while all but two of our late-type stars have 1.8.
Finally, a more precise kinematic test can be applied to determine if the LMC stars discussed here follow the radial velocities of other RSGs as a function of spatial position in the LMC. The kinematics of the SMC are quite complex, and so we restrict this argument to the LMC, where the kinematics are relatively well understood (Olsen & Massey 2007). A histogram of RSG velocities derived by Olsen & Massey (2007) for the LMC (see Figure 1 of Levesque et al. 2007) demonstrates that the late-type LMC RSGs in our sample follow the kinematics of the galaxy, behavior that we would not expect in the case of halo giant contaminants - for a more detailed discussion see Levesque et al. (2007). We therefore conclude that our sample of late-type stars examined here is unlikely to contain foreground objects, and are in fact true Cloud RSGs.
4.2. Photometric Variability
We found that all 12 of the objects in our late-typesample demonstrated large variability in their magnitudes. Using photometry from the All Sky Automated Survey (ASAS) project (Pojmanski 2002) along with the CCD photometry of Massey (2002) and values derived from our own spectrophotometry using the band curve of Bessell (1990) and the zero-points given by Bessell et al. (1998),, we calculated a for each of our stars in both the 2004 and 2005 samples. Normal RSGs are known to be variable in (Josselin et al. 2000), and a sample of seventy RSGs from Levesque et al. (2006) show an average of 0.9 mag. Each of the late-type stars described here show larger variations, averaging a of 1.3 for the SMC sample and 1.6 for the LMC sample. The most extreme case of variability is found in the case of SMC 050028, more commonly known as HV 11423, which varies by nearly 2 mag. Many of the late-type RSG lightcurves also seem to suggest some level of quasi-periodicity.
In contrast, we find much lower variability at , which is also typical of other RSGs (Josselin et al. 2000); comparing the values from 2MASS and DENIS (Kimeswenger et al. 2004), we find an average difference in between the two surveys of about 0.08 mag.
Finally, we find that five of our stars are unusually variable in , with the 2005 spectrophotometry differing by several tenths of a magnitude from the 1999/2000 values of Massey (2002). is not very sensitive to effective temperature in RSGs (see Massey et al. 2007), and we suggest that the variations we see here are instead indicative of changes in the amount of circumstellar dust, causing differences in the reddening. As described by Massey et al. (2007), dust around RSGs results in a significant amount of circumstellar extinction, amounting to several magnitudes in extreme cases. These variations suggest episodic dust ejection on the timescale of a few years, consistent with the study of Danchi et al. (1994).
It is important to note that these dust-related changes in do not correlate simply with changes in the magnitudes. This shows that the -band variability is not merely symptomatic of episodic dust ejection, but is in fact a result of true physical changes in the star. The time-resolved observations of these stars, including their magnitudes, are given in Table 2.
4.3. Spectral Variability
We were intrigued by the large discrepancies in spectral subtypes assigned to some of our stars by previous studies and our own past work. While determining spectral types involves a small degree of subjectivity, there was no similar disagreement between the Massey & Olsen (2003) spectral types and the ones we determined for the 2004 observations from Levesque et al. (2006). Indeed, spectral variability of a type or more is unheard of in RSGs.
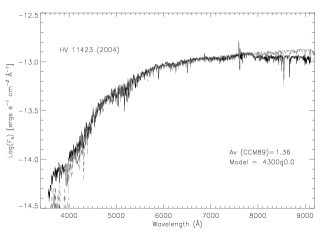
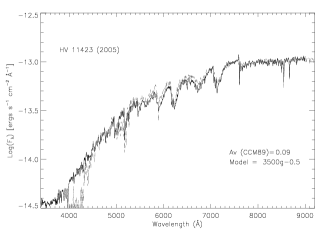
This disparity in spectral types is most profoundly illustrated in the case of HV 11423, which also stands out as the RSG that is the most highly variable in . When we observed the star in 2004 we assigned it an unusually early spectral type of K0-1 I, corresponding to a temperature of 4300 K. When it was reobserved in 2005 its spectrum had changed dramatically, yielding a spectral type of M4 I and a temperature of 3500 K. An additional spectrum of HV 11423 was obtained in September of 2006 with the CTIO 1.5-m telescope, thanks to the courtesy of F. Walters and the SMARTS observing queue. While this spectrum did not have sufficient wavelength coverage to determine a spectral type or effective temperature, it agreed excellently with the K0-1 I spectrum from 2004. Furthermore, a December 2001 archival spectrum of HV 11423 from the Very Large Telescope corresponds to an even later (and hence, cooler) spectral type of M4.5-5 I, and HV 11423 was assigned a spectral type in M0 I in both October 1978 and October 1979. The M4-5 I spectral types are by far the latest type seen for an SMC supergiant, and the corresponding temperatures in these late-type states place HV 11423 well outside the limits of hydrostatic equilibrium.
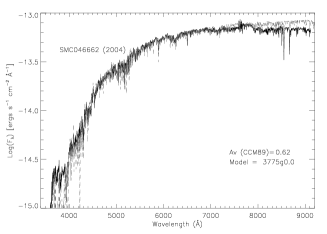
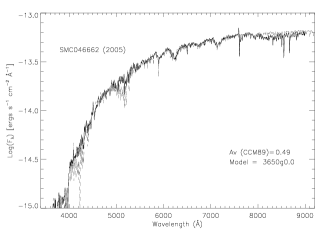
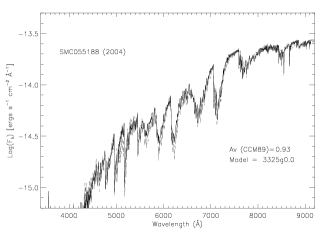
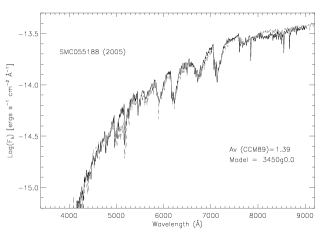
We also find three other stars in our sample that exhibit evidence of spectral variability between 2004 and 2005: SMC 046662 (M2 I to K2-3 I), SMC 055188 (M2 I to M4.5 I), LMC 170452 (M4.5-5 I to M1.5 I) - from comparing the Massey & Olsen (2003) spectra observed in 2001 to our 2004 and 2005 observations, we can confirm that these changes are truly symptomatic of differences in line strength, and therefore changes in the stars’ physical properties (for comparison, LMC 148035 was found to vary between M4 I and M2.5 I between 2001 and 2005, but in this case there was no compelling difference in the spectra and we concluded that the disagreement was a result of Massey & Olsen (2003) assigning too late a spectral type). All four of these stars - HV 11423, SMC 046662, SMC 055188, and LMC 170452 - undergo substantial changes in their effective temperature over the course of a single year, a phenomenon that has not previously been observed in RSGs. For the three SMC stars, we can also conclude that when the stars are at their hottest they are also more luminous (the 2004 spectrum of LMC 170452 has incomplete spectral coverage, ranging from 4000Å to 6500Å as compared to the 4000Å - 9000Å coverage of the rest of our stars; the data in this case is sufficient for assigning a spectral type but insufficient for calculating physical properties such as and ). Finally, we are able to estimate the amount of extinction for the three SMC stars, and find the is larger when the stars are hotter. This reddening is higher than what is typically seen for OB stars in the Clouds, further supporting the argument that these effects are symptomatic of sporadic circumstellar dust production. Both HV 11423 and SMC 055188 are among the only four known SMC RSGs that are IRAS sources (Massey et al. 2007), suggesting that we are in fact seeing thermal emission from these stars’ circumstellar dust. These variations in the stars’ physical properties are given in Table 2. Changes in the spectra of the unusually variable SMC stars between 2004 and 2005 are illustrated in Figure 3.
4.4. Placement on the H-R Diagram
In Figure 4 we place our full sample of LMC and SMC late-type RSGs on the H-R diagram, accompanied by stellar evolutionary tracks of appropriate metallicity. It is clear that stellar evolutionary theory is not in agreement with the observed parameters of these late-type stars, with all of the stars lying on or to the right of the Hayashi limit. The location of the RSGs as derived from spectral fitting is, on average, 275 K coller than the tracks allow for the LMC and 541 K cooler for the SMC. When Milky Way RSGs such as VY CMa occupied this forbidden region of the H-R diagram, the disagreement was rectified by a more accurate determination of the stars’ effective temperature or by a reevaluation of other physical properties. By contrast, it is evident in this case that the location of these evolutionary tracks does not accommodate the full range of RSG properties and behaviors in these lower-metallicity environments. This is further highlighted by the fact that the discrepancy is worse in the case of the SMC, where the lower metallicity will enhance the effects of rotation on the luminosity of the evolutionary tracks (Maeder & Meynet 2001) due to the effects of mixing. Even the high-rotation (300 km s-1) tracks are not sufficient to reproduce the location of these stars, showing that this increased discrepancy in the SMC remains unexplained.


We also compare H-R diagrams of the late-type RSGs in the SMC in 2004 and 2005, illustrating the change in position of HV 11423, SMC 046662, and SMC 055188. Surprisingly, we see that HV 11423 actually moves of hydrostatic equilibrium between 2004, when it is positioned at the rightmost reaches of the evolutionary tracks, and 2005, when it has moved well into the forbidden region to the right of the Hayashi track. All three of the stars undergo these unusual physical variations while in the Hayashi forbidden region.
5. What’s Going On?
HV 11423, SMC 046662, SMC 055188, and LMC 170452 all exhibit remarkably similar behavior: cool stars, inhabiting the forbidden region to the right of the Hayashi track, that show large variability in spectral type, magnitudes, and extinction, presumed to be from episodic production of circumstellar dust. These stars suffer changes in effective temperature and bolometric luminosity on the timescales of months; in every case, when they are at their hottest they are also brighter, dustier, and more luminous. These stars all occupy the Hayashi forbidden region of the H-R diagram, where we would not expect stars to be in hydrostatic equilibrium. One would expect hydrostatic instability to lead to this sort of variability and behavior, but the precise physical explanation for these phenomena and the mechanisms which may lead to such an instability remains a mystery.
It is possible that such behavior is simply a case of extremes, with the coldest stars in any environment moving to the right of the Hayashi track and undergoing these unique physical variations. Conversely, it could be possible that such extremes are only attainable in low-metallicity environments where the Hayashi track moves to warmer temperatures. Similarly, such behavior could simply “ignite” only in low-metallicity environments, a function of the complex interrelation between massive stellar evolution and the interstellar medium environment. The question of how such environmental factors might correlate with this behavior can be solved by observations of the latest-type Milky Way red supergiants, as well as observations of RSGs in other low-metallicity environments and continued monitoring of these unusual stars as a means of obtaining a more complete understanding of the physical phenomena being observed. Better knowledge of this unusual behavior could shed new light on the nature of late-type massive star evolution, particularly at low metallicities, and highlight properties and environmental effects that the next generation of evolutionary tracks should strive to accomodate.
Acknowledgments.
We are very grateful to the staff at KPNO and CTIO for the excellent hospitality and support provided during our observations. We acknowledge valuable assistance, correspondence and conversation about the extreme case of HV 11423 from Drs. Brian Skiff, Beverly Smith, Geoff Clayton, and Roberto Mendez, as well as Dr. David Silva for his help in obtaining follow-up observations on the SMARTS 1.5-m telescope. This work made use of data from the Two Micron All Sky Survey, which is a joint project of the University of Massachusetts and the Infrared Processes and Analysis center/California Institute of Technology, funded by the National Aeronautics and Space Administration and the National Science Foundation. This work also benefitted greatly from the valuable resources of the All Sky Automated Survey of Pojmanski (2002). This work was supported by AST-0604569. Finally, we wish to acknowledge Drs. Don Luttermoser, Bev Smith, Rico Ignace, Gary Henson, and Mark Giroux, the organizing committee who helped make “The Biggest, Baddest, Coolest Stars Conference” possible.
References
- Bahcall & Soneira (1980) Bahcall, J. N., & Soneira, R. M. 1980, ApJS, 44, 73
- Bessell (1990) Bessell, M. S. 1990, PASP, 102, 1181
- Bessell et al. (1998) Bessell, M. S. , Castelli, F., & Plez, B. 1998, A&A, 333, 231
- Danchi et al. (1994) Danchi, W. C., Bester, M., Degiacomi, C. G., Greenhill, L. J., & Townes, C. H. 1994, AJ, 107, 1469
- Dyck et al. (1974) Dych, H. M., Lockwood, G. W., & Capps, R. W. 1974, ApJ, 189, 89
- Elias et al. (1985) Elias, J. H., Frogel, J. A., & Humphreys, R. M. 1985, ApJS, 57, 91
- Freytag et al. (2002) Freytag, B., Steffen, M., & Dorch, B. 2002, Astron. Nach., 323, 213
- Gustafsson et al. (2003) Gustafsson, B., Edvardsson, B., Eriksson, K., Mizuno-Wiedner, M., Jorgensen, U. G., & Plez, B. 2003, in ASP Conf. Ser. 288, Stellar Atmosphere Modeling, ed. I. Hubeny, D. Mihalas, & K. Werner (San Francisco: ASP), 331
- Hayashi & Hoshi (1961) Hayashi, C., & Hoshi, R. 1961, PASJ, 13, 552
- Herbig (1970) Herbig, G. H. 1970, ApJ, 162, 557
- Humphreys (1974) Humphreys, R. M. 1974, ApJ, 188, 75
- Humphreys et al. (2005) Humphreys, R. M., Davison, K., Ruch, G., & Wallerstein, G. 2005, AJ, 129, 492
- Jaschek & Jaschek (1990) Jaschek, C., & Jaschek, M. 1990, The Classification of Stars (Cambridge: Cambridge Univ. Press)
- Josselin et al. (2000) Josselin, E., Blommaert, J. A. D. L., Groenewegen, M. A. T., Omont, A., & Li, F. L. 2000, A&A, 357, 225
- Joy (1942) Joy, A. H. 1942, ApJ, 96, 344
- Kimeswenger et al. (2004) Kimeswenger, S. et al. 2004, A&A, 413, 1037
- Le Sidaner & Le Bertre (1996) Le Sidaner, P., & Le Bertre, T. 1996, A&A, 314, 896
- Levesque et al. (2005) Levesque, E. M., Massey, P., Olsen, K. A. G., Plez, B., Josselin, E., Maeder, A., & Meynet, G. 2005, ApJ, 628, 973
- Levesque et al. (2006) Levesque, E. M., Massey, P., Olsen, K. A. G., Plez, B. Meynet, G., & Maeder, A. 2006, ApJ, 645, 1102
- Levesque et al. (2007) Levesque, E. M., Massey, P., Olsen, K. A. G., & Plez, B. 2007, ApJ, 667, in press
- Maeder & Meynet (2001) Maeder, A., & Meynet, G. 2001, A&A, 373, 555
- Massey (1998) Massey, P. 1998, ApJ, 501, 153
- Massey (2002) Massey, P. 2002, ApJS, 141, 81
- Massey et al. (2006) Massey, P., Levesque, E. M., & Plez, B. 2006, ApJ, 646, 1203
- Massey et al. (2007) Massey, P., Levesque, E. M., Olsen, K. A. G., Plez, B., & Skiff, B. A. 2007, ApJ, 660 301
- Massey & Olsen (2003) Massey, P., & Olsen, K. A. G. 2003, AJ, 126, 2867
- Massey et al. (2005) Massey, P., Plez, B., Levesque, E. M., Olsen, K. A. G., Clayton, G. C., & Josselin, E. 2005, ApJ, 634, 1286
- Meynet & Maeder (2003) Meynet, G., & Maeder, A. 2003, A&A, 404, 975
- Meynet & Maeder (2005) Meynet, G., & Maeder, A. 2005, A&A, 429, 581
- Monnier et al. (1999) Monnier, J. D., Tuthill, P. G., Lopez, B., Cruzalebes, P., Danchi, W. C., & Haniff, C. A. 1999, ApJ, 512, 351
- Monnier et al. (2004) Monnier, J. D. et al. 2004, ApJ, 605, 436
- Olsen & Massey (2007) Olsen, K. A. G., & Massey, P. 2007, ApJ, 656, L61
- Plez et al. (1992) Plez, B., Brett, J. M., & Nordlund, Å1992, A&A, 256, 551
- Plez (2003) Plez, B. 2003, in ASP Conf. Ser. 298, Spectroscopy: Science and Technology, ed. U. Munari (San Francisco: ASP), 189
- Pojmanski (2002) Pojmanski, G. 2002, Acta Astronomica, 52, 397
- Robinson (1970) Robinson, L. J. 1970, Inf. Bull. Variable Stars, 465, 1
- Robinson (1971) Robinson, L. J. 1971, Inf. Bull. Variable Stars, 599, 1
- Schaerer et al. (1993) Schaerer, D., Meynet, G., Maeder, A., & Schaller, G. 1993, A&AS, 98, 523
- Smith (2004) Smith, N. 2004, MNRAS, 349, L31
- Smith et al. (2001) Smith, N., Humphreys, R. M., Davidison, K., Gehrz, R. D., Schuster, M. T., & Krautter, J. 2001, AJ, 121, 1111
- Wallerstein (1958) Wallerstein, G. 1958, PASP, 70, 479
- Westerlund (1997) Westerlund, B. E. 1997, The Magellanic Clouds (Cambridge: Cambridge Univ. Press)
| Star | HJD - 2,450,000 | Type | log (Model) | ||||||||
|---|---|---|---|---|---|---|---|---|---|---|---|
| SMC 046662 | 00 59 35.04 | -72 04 06.2 | 3340.58 | K2-3 I | 12.38 | -7.14 | 0.62 | 3775 | 0.0 | 1000 | -8.41 |
| 3725.63 | M0 I | 12.75 | -6.65 | 0.50 | 3650 | 0.0 | 960 | -8.19 | |||
| SMC 050028 | 01 00 55.17 | -71 37 52.7 | 3341.50 | K0 I | 11.84 | -8.40 | 1.35 | 4300 | 0.0 | 1060 | -9.10 |
| 3724.75 | M4 I | 12.46 | -6.50 | 0.10 | 3500 | -0.5 | 1220 | -8.5 | |||
| SMC 052334 | 01 01 54.16 | -71 52 18.8 | 3725.67 | K5-M0 I | 12.87 | -6.34 | 0.31 | 3675 | 0.0 | 800 | -7.82 |
| SMC 055188 | 01 03 02.38 | -72 01 52.9 | 3341.59 | M4.5 I | 14.99 | -4.87 | 0.96 | 3325 | 0.0 | 870 | -7.57 |
| 3725.68 | M3-4 I | 14.23 | -6.07 | 1.40 | 3450 | 0.0 | 1100 | -8.23 | |||
| SMC 083593 | 01 30 33.92 | -73 18 41.9 | …a | M2 I | 12.83 | -6.16 | 0.09 | 3525 | 0.0 | 970 | -8.06 |
| LMC 143035 | 05 29 03.58 | -69 06 46.3 | 3725.81 | M4 I | 14.10 | -5.64 | 1.24 | 3450 | -0.5 | 1020 | -8.06 |
| LMC 148035 | 05 30 35.61 | -68 59 23.6 | 3725.81 | M2.5 I | 13.42 | -6.57 | 1.49 | 3575 | 0.0 | 1130 | -8.44 |
| LMC 150040 | 05 31 09.35 | -67 25 55.1 | 3725.82 | M3-4 I | 13.09 | -6.03 | 0.62 | 3525 | -0.5 | 990 | -8.11 |
| LMC 158646 | 05 33 52.26 | -69 11 13.2 | 3725.82 | M2 I | 13.80 | -6.25 | 1.55 | 3625 | -0.5 | 870 | -7.94 |
| LMC 162635 | 05 35 24.61 | -69 04 03.2 | 3725.83 | M2 I | 14.58 | -5.78 | 1.86 | 3600 | 0.0 | 740 | -7.56 |
| LMC 168757 | 05 37 36.96 | -69 29 23.5 | 3727.84 | M3-4 I | 14.62 | -4.90 | 1.02 | 3425 | 0.0 | 780 | -7.45 |
| LMC 170452 | 05 38 16.10 | -69 10 10.9 | 3727.83 | M1.5 I | 13.99 | -6.68 | 2.17 | 3625 | 0.0 | 1060 | -8.37 |
| Star | HJD - 2,450,000 | b | Spectral Type | |||
| SMC 046662 | 1186.58 | 12.90 | … | 1.88 | … | .̇. |
| 2188.56 | 13.32 | … | … | … | M2 I | |
| 3340.58 | 12.38 | 0.62 | … | 3775 | K2-3 I | |
| 3725.63 | 12.75 | 0.50 | 1.95 | 3650 | M0 I | |
| SMC 050028 | 3341.50 | 11.84 | 1.35 | 1.85 | 4300 | K0 I |
| 3724.75 | 12.46 | 0.10 | 1.93 | 3500 | M4 I | |
| 4003.62 | … | … | … | … | K0 I | |
| SMC 052334 | 1186.58 | 12.89 | … | 1.94 | … | … |
| 2187.56 | 12.72 | … | … | … | K7 I | |
| 3725.67 | 12.87 | 0.31 | 1.91 | 3675 | K5-M0 I | |
| SMC 055188 | 1186.58 | 14.96 | … | 2.25 | … | … |
| 2188.56 | … | … | … | … | M2 I | |
| 3341.59 | 14.99 | 0.96 | … | 3325 | M4.5 I | |
| 3725.68 | 14.23 | 1.40 | 2.22 | 3450 | M3-4 I | |
| SMC 083593 | 1186.59 | 12.64 | … | 1.87 | … | … |
| 3334.60 | 12.81 | … | … | … | … | |
| 3724.60c | 12.83 | 0.09 | 1.60 | 3525 | M2 I | |
| LMC 143035 | 1186.67 | 13.53 | … | 1.93 | … | … |
| 1998.51 | 13.51 | … | 1.93 | … | … | |
| 2188.72 | 14.24 | … | … | … | M3-4.5 I | |
| 3334.60 | 13.99 | … | … | … | M4.5-5 I | |
| 3725.81 | 14.10 | 1.24 | 1.93 | 3450 | M4 I | |
| LMC 148035 | 1186.67 | 12.94 | … | 1.82 | … | … |
| 1996.53 | 13.89 | … | 1.71 | … | … | |
| 1998.51 | 13.87 | … | 1.62 | … | … | |
| 2188.72 | 12.94 | … | … | … | M4 I | |
| 3725.81 | 13.42 | 1.49 | 1.98 | 3575 | M2.5 I | |
| LMC 150040 | 1186.71 | 12.86 | … | 1.97 | … | … |
| 1997.54 | 12.81 | … | 1.96 | … | … | |
| 2188.82 | 12.93 | … | … | … | M4 I | |
| 3334.60 | 12.60 | … | … | … | M3-4 I | |
| 3725.82 | 13.09 | 0.62 | 1.90 | 3525 | M3-4 I | |
| LMC 158646 | 1186.71 | 12.66 | … | 2.19 | … | … |
| 1996.53 | 13.10 | … | 2.23 | … | … | |
| 2188.79 | 13.54 | … | … | … | M3-4 I | |
| 3725.82 | 13.80 | 1.55 | 2.18 | 3625 | M2 I | |
| LMC 162635 | 1996.53 | 14.23 | … | 2.33 | … | … |
| 2188.79 | 13.52 | … | … | … | M1 I | |
| 3725.83 | 14.58 | 1.86 | 2.20 | 3600 | M2 I | |
| LMC 168757 | 1996.53 | 14.08 | … | 1.77 | … | … |
| 2188.76 | 13.23 | … | … | … | M3 I | |
| 3727.84 | 14.62 | 1.02 | 1.80 | 3425 | M3-4 I | |
| LMC 170452 | 1996.53 | 13.99 | … | 2.39 | … | … |
| 2188.76 | … | … | … | … | M4.5-5 I | |
| 3341.70 | 15.31 | … | … | … | M4.5-5 I | |
| 3727.83 | 13.99 | 2.17 | 2.24 | 3625 | M1.5 I |