CO-activator model for reconstructing Pt(100) surfaces: local microstructures and chemical turbulence
Abstract
We present the results of the modelling of CO adsorption and catalytic CO oxidation on inhomogeneous Pt(100) surfaces which contain structurally different areas. These areas are formed during the CO-induced transition from a reconstructed phase with hexagonal geometry of the overlayer to a bulk-like () phase with square atomic arrangement. In the present approach, the surface transition is explained in terms of nonequilibrium bistable behavior. The bistable region is characterized by a coexistence of the hexagonal and () phases and is terminated in a critical bifurcation point which is located at ( K, Torr). Due to increasing fluctuations, the behavior at high temperatures and pressures in the vicinity of this cusp point should be qualitatively different from the hysteresis-type behavior which is typically observed in the experiments under ultrahigh vacuum conditions. On the inhomogeneous surface, we find a regime of nonuniform oscillations characterized by random standing waves of adsorbate concentrations. The resulting spatial deformations of wave fronts allow to gain deeper insight into the nature of irregular oscillations on Pt(100) surface.
pacs:
82.40.Bj,82.45.Jn,05.45.-a,82.20.WtI INTRODUCTION
The processes of surface reconstruction play a central role in heterogeneous catalysis white . A prominent example of a catalyst with the reactivity strongly affected by the rearrangement of the substrate atoms is the Pt(100) surface. The mechanism of such rearrangements is the tensile excess stress due to charge depletion of 5d orbitals of surface Pt atoms fiorentini . As a result, the bulk-like () termination of clean Pt(100) corresponding to the square configuration of Pt atoms becomes metastable which causes a transformation to the hexagonal (hex) surface atomic arrangement. From the point of view of the catalytic properties, the crucial importance has the fact that such surface reconstructions are strongly affected by the adsorbates. The CO-induced lifting of the hex surface reconstruction and the stabilization of the phase is forced by a gain in the CO adsorption energy and proceeds through the nucleation of ()-islands with high CO coverage behm ; thiel ; hopkinson .
The reconstruction of Pt surfaces is a key factor responsible for their complex oscillating behavior and pattern formation imbihl . This is also supported by the fact that the stable Pt(111) surface where the reconstruction is not observed, does not exhibit oscillation properties. During the reconstruction, the surface of Pt(100) becomes inhomogeneous and contains coexisting micrometer-size regions of different (hex and square) atomic configurations. As demonstrated in low energy electron diffraction (LEED) studies cox ; eiswirth ; imbihl2 , the propagating waves of surface modification can result in highly irregular spatio-temporal character of the oscillations.
Even with a constant oscillation period, the time variation of the local LEED intensity of small surface spots differs from the temporal behavior of the intensities integrated over the whole surface area eiswirth . Such a behavior is in contrast to the uniform oscillations on Pt(110) surfaces originating from the global coupling of various surface patches through the gas phase imbihl ; eiswirth . It should be noted that the mechanism of the global coupling has been extensively studied in a series of experimental works and by the theoretical modelling falcke ; bar2 ; mertens ; veser ; khrustova ; thostrup ; monine . In distinction to Pt(110), the irregular oscillations during CO oxidation on Pt(100) possibly originate from the propagating chemical reaction fronts which can be triggered by defects and other surface imperfections cox ; imbihl4 . The kinetic Monte Carlo simulations performed for the heterogeneous Pt(100) surfaces containing mesoscopic hex regions in macroscopic () surrounding, have essentially shown local unsynchronized oscillationskortluke . These local oscillations disappear on the m–scale, whereas the experiment demonstrates well developed irregular oscillations even on the macroscopic mm-scale eiswirth . Another aspect which can lead to the irregular temporal character of oscillations is the stong fluctuations on nm-size catalyst particles with (100)-facets zhdanov . As the fluctuations in surface coverages are increasing with the decrease of the system size pavlenko ; zhdanov2 , they cannot satisfactorily explain the irregularities observed on single crystal surfaces of Pt(100).
To gain deeper insight into the nature of the irregular behavior, in the present work we consider a modelling of spatially inhomogeneous Pt(100) surfaces. In our approach, we account for the fact that the hex-square transformation occurs through a hysteresis and has a character of a first-order phase transition. Under the non-equilibrium conditions, the hysteresis features are described in terms of a bistable behavior which is characterized by a coexistence of the hex and square phases in a wide range of temperatures and partial pressures. Such a mechanism allows to obtain in a natural way the inhomogeneous surface state, without introducing additional separate variables for the description of the adsorbate coverage in different phases. Upon the increase of temperature and CO pressure, the bistable region narrows and terminates at a bifurcation cusp point ( K, Torr). Due to strong fluctuations near this critical point, the behavior at high temperatures and pressures should be qualitatively different from the hysteresis-type behavior observed on Pt(100) under ultahigh vacuum conditionsthiel .
Furthermore, we address two main questions related to the surface inhomogeneities. First, we analyze the role of the inhomogeneities in the nucleation and growth of adsorbate islands. We find that the difference between the CO desorption rates for the hex and square substrate geometries is responsible for the trapping of the adsorbed CO behm , a property responsible for the growth of CO islands during the hex-square transformation. Second, we study the oscillation behavior on inhomogeneous surface during the reaction of CO oxidation. We show that the surface inhomogeneities lead to the Benjamin-Feir instability and to a new inhomogeneous oscillating regime. This new regime is characterized by the random standing waves in spatially separated surface regions. We investigate the driving mechanisms of irregular oscillations and provide the analysis of the stability of the system with respect to nonuniform perturbations. The obtained deformations of the chemical wave fronts appear to be a direct consequence of structural inhomogeneities typical for Pt(100), and can be a possible clue for the explanation of the irregular oscillating behavior on this type of surfaces.
II CO-ACTIVATOR MODEL AND ITS ANALYSIS
A fundamental property related to the adsorption of CO on low-index Pt(100) surfaces is a transformation of the initially stable reconstructed hex Pt surface into the bulk-like () structure. The lifting of the surface reconstruction is activated in the case when the concentration (coverage) of adsorbed CO exceeds a critical value ML. In a wide range of the CO surface coverages ( ML), the surface contains the coexisting areas of the ()- and hex-geometry hopkinson . In the LEED experiments, the range of temperatures and CO partial pressures determining the phase coexistence is identified by a hysteresis behavior of LEED intensities thiel .
It is noteworthy that in the nonequilibrium conditions, the hex-() coexistence should be described in terms of a bistable behavior. To provide a consistent analysis of the CO controlled bistability, we introduce a variable for the description of the CO surface coverage and a parameter which measures a degree of the surface reconstruction. The value corresponds to a fully reconstructed hex surface whereas the maximal value describes the recovered homogeneous () state.
Within the two-variables approach, the process of the CO-induced surface transformation contains two main stages. The first stage includes the change of the local mesoscopically averaged CO surface coverage during the steps of CO adsorption, desorption and CO diffusion on Pt surface:
| (1) |
Here and denote the partial pressure and the impingement rate of CO, respectively, and refers to the maximal (corresponding to a saturation) CO coverage; is the CO diffusion coefficient. The factor models the precursor-type kinetics of the CO adsorption krischer ; gasser . In our analysis, a typical value for the precursor factor is chosen.
For the kinetic processes on the inhomogeneous surface containing a mixture of hex- and ()-islands, we need to consider two different contributions to the adsorption/desorption steps in (1). These two different types originate from the processes COCOhex and COCO1×1 which contribute with the weights and to the total rates of surface adsorption and desorption. As a consequence, the final expression for the CO sticking and CO desorption coefficients and contain both contributions
| (2) | |||
where and . In the expressions for and , the parameters , and , are the CO sticking and desorption coefficients in the hex and () phases, respectively. As is shown in hopkinson , the low desorption rate is a prime factor responsible for high CO coverages of the () surface. In contrast, due to higher desorption rate on the hex surface, significant part of adsorbed CO molecules desorps which leads to substantially lower CO coverages in the hex state.
For the sticking coefficients, we use the values (, hex geometry) and (, geometry) reported in Ref. thiel, . In the Arrhenius-type form of the desorption coefficients and we choose the following values for the rate parameters: s-1 and s-1; kcal/mol and kcal/mol thiel .
Furthermore, in our approach we consider the transformation of the substrate state activated by the adsorbed CO. In the two-variable model, the time evolution of the local mesoscopically averaged surface state parameter is described by the following phenomenological equation:
| (3) |
Here the first term refers to the lifting of the hex reconstruction. The rate of the lifting is proportional to the CO coverage and to the factor which is a mean-field form of the effective flux between the hex and ()- regions. By introducing the step function ( for and 0 otherwise), we account for the experimental observation that the transition to the () phase does not occur below a critical coverage . In our calculations, we describe the transition rate by an Arrhenius-type expression where the activation energy kcal/mol corresponds to a small activation barrier for the transformation from the hex- to the ()-state thiel , and the prefactor s-1 gives correct time scales for the transformation in the considered temperature interval krischer ; bar .
The second term in (II) refers to the reverse ()hex reconstruction with a rate coefficient . Here the factor accounts for the property that the reconstruction can occur locally if a small cluster of neighbouring surface positions (a pair in the simplest case) is not occupied by adsorbed CO which is in analogy with the assumption considered in kortluke ; kuzovkov .
For an inhomogeneous surface, the laplacian term in (II) originates from the contribution of the interfaces between different surface geometries to the total system energy bray ; hildebrand . Consequently, the coefficient describes the energy costs of such interfaces and is related to the characteristic interface width which is typically of the order of few nanometers. We note that the characteristic diffusion length of the adsorbed CO is given by and is of the order of several micrometers. The fast CO diffusion between the hex- and ()-areas described by the diffusion term in (1), controls the m size of CO islands which is discussed in details in section III.
The equations (1) and (II) can be transformed by the substitution:
| (4) |
into the following dimensionless form
| (5) | |||
where
| (6) | |||
For a given , the second equation (5) leads to the two stable steady states: and . In the limit , the second solution approaches the value which implies the full lifting of the hex geometry by the CO adsorption. In the following discussion, we will omit for convenience the tilde signs in the notations of dimensionless time and coordinate.
A remarkable property of the system (2), (5), (6) is a strong dependence of the CO adsorption and desorption rates on the local configurational state of the surface determined by the parameter . In analogy to hopkinson , this dependence can can be conveniently analyzed in terms of a net sticking probability of CO molecules defined as
| (7) |
Specifically, despite a large initial sticking coefficient in the hex regions, the significant contribution of the second desorption term in (7) results in a suppression of which reflects the fact of low CO coverages ML observed on the reconstructed surfaces. In contrast, due to the low desorption rates on the () substrate, the adsorption of CO will result in large values of and consequently in high CO coverages in the regions with the lifted reconstruction. In the following analysis, we will use the net sticking probability as a relevant quantity for the interpretation of the growth kinetics of CO islands on inhomogeneous substrates.
II.1 The surface transition hex-() on Pt(100): bistable behavior
A central feature of the model (5), (6) is the occurrence of a bistable region characterized by the coexistence of the states and with low and high CO coverage. In the analysis of (5) and (6), we choose s-1Torr-1ML and perform the calculations of the steady states using the rate parameter with kcal/mol and s-1. The large value of is consistent with the high activation barrier for the hex reconstruction of the clean Pt(100) surface reported in thiel . In the Arrhenius form of the desorption rate parameter of the () substrate, we choose the values s-1 and kcal/mol. These values have been deduced in thiel from the temperature dependences of the corresponding LEED intensities which exhibit a hysteresis-type behavior.

Fig. 1 shows the stationary solutions calculated for different CO pressures. Here the bistable region where the stable hex and () phases coexist is located in the range of pressures between Torr and Torr.

The regions of the stability of different phases together with the bistable region are indicated on the phase diagram (, ) shown in Fig. 2. We note that the topology of the diagram and the location of the bistable region agree well with a LEED diagram obtained by the estimation of isosteric heats of CO adsorption thiel . A remarbable feature of our diagram is that the bistable region narrows with the increasing and terminates at a critical bifurcation point at Torr and K. The existence of such a cusp point on the diagram is a clear manifestation of the critical behavior which is associated with a strong increase of near-critical fluctuations in the system. We should emphasize that in this high pressure range, the direct comparison with the experimental data obtained at low CO pressures up to Torr cannot be provided. In view of this, additional experimental studies conducted at high pressures and temperatures are required in order to verify the existence of the obtained critical bifurcation point. For Pt(100), such experiments would be of a central importance in bridging a ”pressure gap” between the hysteresis-type behavior at low and possible critical fluctuations which should exist at high CO pressures.
III ISLANDS NUCLEATION ON INHOMOGENEOUS Pt SURFACE
In the bistable region, the problem of prime interest is the behavior of adsorbate molecules on a surface which contains micrometer-size areas of different geometry. To study the nucleation and growth of adsorbate islands on such an inhomogeneous substrate, we have to consider the full set of the reaction-diffusion equations (5) and (6). It should be noted that the strong difference between the characteristic nanoscale width of the hex/() interfaces and the micrometer scale of the CO diffusion length results in small values of the ratio in (II) which is of the order –. Furthermore, in our analysis we choose a typical value . The equations (5) and (6) have been solved numerically using an implicit two-level finite-difference scheme on a discrete finite grid with the Neumann boundary conditions , . In this absolutely stable scheme, the standard finite difference approximations of the second-order accuracy for coordinate derivatives and the first order accuracy approximation for time derivatives are applied.
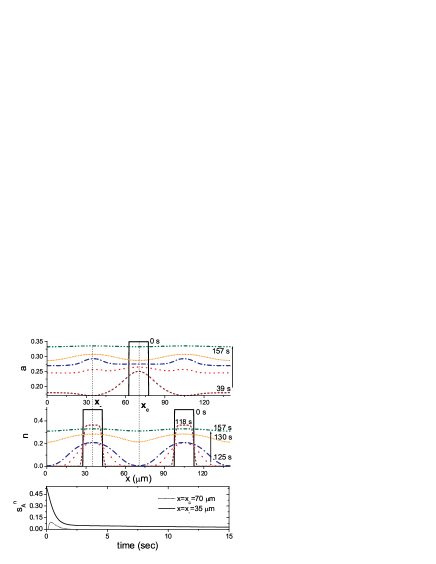
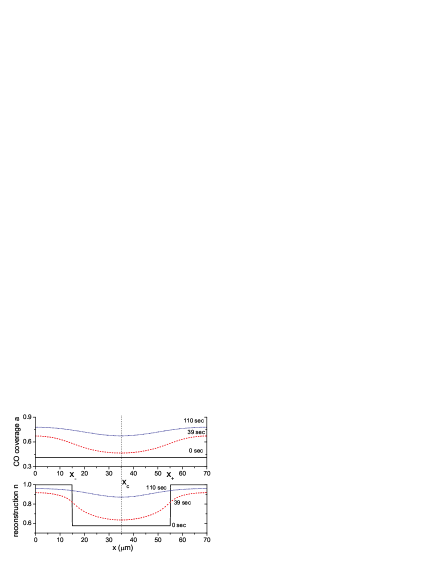
To demonstrate the influence of the surface geometry on the growth of adsorbate islands, in Fig. 3 we present the spatio-temporal evolution of islands with high CO coverage on inhomogeneous surface. For simplicity, we consider a quasi-one-dimensional case described by the spatial coordinate which corresponds to a stripe-like surface patterning. The initial geometry of the substrate is characterized by two symmetric regions exhibiting a high degree of transformation into the () phase with . These regions of the length 15 m are located at a distance about 35 m from the center and surrounded by the reconstructed (hex)-areas with . In the cental region, we initially have a preformed CO island which is centered at and located in the hex-area beyond the ()-patches. Furthermore, in the process of the temporal evolution shown in Fig. 3, the CO coverage of the central hex-area decreases. This decrease is driven by the CO desorption which is dominant due to the high desorption coefficient . It is remarkable that the disappearance of the central CO island is accompanied by the simultaneous development of two new symmetric islands with high CO coverage. These two islands nucleate in the ()-parts of the substrate where the desorption is suppressed and CO molecules become trapped due to the high CO binding energy on the surface.
The corresponding difference between the kinetic properties of different regions of inhomogeneous substrate can be interpreted in terms of the time evolution of the net sticking probabilities shown in the bottom panel of Fig. 3. The predominant desorption of CO from the central hex area is reflected in the initial zero net sticking probability which slightly increases with the expansion of the ()-areas on the surface. In contrast to this, in the symmetric regions with partially lifted surface reconstruction, the net sticking probability is high due to low desorption rates on these parts of the surface ( in Fig. 3).
In fact, the obtained simultaneous disappearance and nucleation of CO islands in the areas of different geometry can be characterized as an effective island propagation. The basic mechanism responsible for this propagation, is the difference between the CO desorption rates in the () and hex surface parts. Consequently, in the () regions where the desorption rate is lower, the rapid CO diffusion between the hex and () areas results in the trapping of CO molecules and in the growth of the micrometer-size islands.
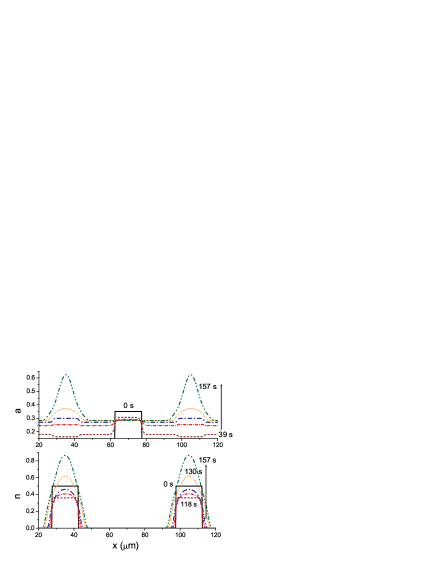
The effect of the CO diffusion on the island growth becomes more clear when we perform calculations with a small CO diffusion coefficient which corresponds to the case shown in Fig. 4. In Fig. 4, the decrease of by the two orders of magnitude corresponds to the additional prefactor near the diffusion term in (5). The comparison with Fig. 3 clearly shows that such a slow diffusion leads to a strong localization of the new symmetric CO islands in the ()-areas and to a significant slowing down of the hex-lifting process.
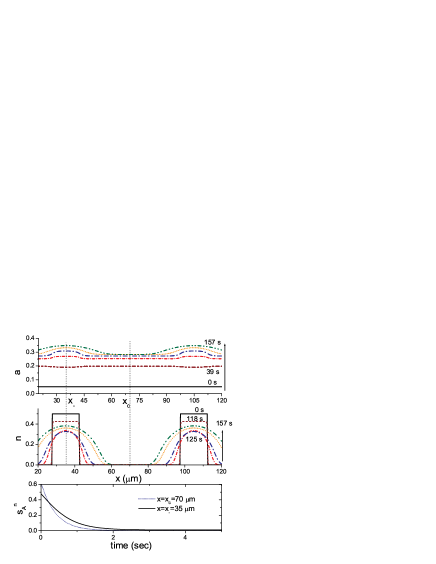
To analyze the role of the CO desorption in the island nucleation, we consider an inhomogeneous surface where the initial CO coverage is uniformly distributed with (Fig. 5). This is lower then the critical coverage necessary for the hex() transition. In the course of temporal evolution, the CO coverage begins to increase predominantly in the ()-regions of substrate which leads to the development of two symmetric CO islands. Although the absolute sticking coefficient in the ()-areas is smaller that the hex sticking coefficient , the low CO desorption rates lead to substantially higher net CO sticking probability in the ()-regions, which is illustrated by the time evolution of in the hex () and () () regions in Fig. 5 (bottom panel). It should be noted that the obtained strong dependence of the net sticking probabilities on the geometry of the substrate is in agreement with the scenario of CO island growth dynamics discussed in hopkinson . In view of this, the difference in the CO desorption rates appears to be a central mechanism responsible for the CO island nucleation and CO trapping on inhomogeneous surfaces.
IV MODELLING CATALYTIC CO OXIDATION
The equations (1) and (II) represent in fact a CO-activator model where the surface transition hex() is activated by the CO adsorption. On the Pt(100) surfaces, this structural surface transformation is a key source for complex spatial self-organization and temporal oscillations observed in surface reactions like catalytic CO oxidation cox ; eiswirth . This is in distinction to the oscillating behavior on Pt(110) surfaces where the oscillations occur via a coupling through the gas phase. For Pt(100), the basic oscillation mechanism consists in a periodic switch between the phases with low- and high reactivity. This switch is related to the periodic surface transformation between the hex and () surface structures. We note that in contrast to the adsorbed CO which activates the hex() transformation in the considered temperature interval 400-500 K, the coadsorbed oxygen plays a role of inhibitor for such a transformation. The inhibiting function in this case is based on the fact that the oxygen predominantly adsorbs in the unreconstructed () phase and reacts with the adsorbed CO. The consequent decrease of the CO coverage during the reaction drives the reverse ()hex surface reconstruction. In this context, the inhibiting character of the oxygen is a basis for the oscillatory behavior in the modelling of the surface CO oxidation.
IV.1 Oscillating behavior
To study the role of the adsorbed oxygen, we introduce the additional equation for the description of the oxygen coverage on the Pt surface:
| (8) |
where and refer to the O2 partial pressure and impingement rate, respectively. As the O2 sticking coefficient in the hex phase is negligibly small, the surface state parameter in the first term restricts the oxygen adsorption to the unreconstructed () parts of substrate, which occurs with the sticking coefficient . The mean-field factor accounts for the condition that two neighbouring surface positions not occupied by COads and Oads are required for the dissociative adsorption of O2. The second term in (8) describes the decrease of B due to the reaction with COads, with the reaction rate . The similar reaction term is also included into the kinetic equation (1) for the CO coverage. In our analysis of CO oxidation, we choose the values s-1ML-1 and kcal/mol for the reaction parameters. As the diffusion coefficient of adsorbed oxygen is about three-four orders of magnitude lower than the CO diffusion parameter , the adsorbed oxygen is considered as immobile imbihl3 .
After introducing the dimensionless forms for the oxygen coverage , oxygen partial pressure and for the reaction rate , the equation (8) can be rewritten in the form
| (9) |
In the equation (5), the modified function now includes the reaction term: .
To analyze the stability of the macroscopically homogeneous solutions of (5) and (9), we performed a linearization of the system in the vicinity of the stationary states . In this approach, the small deviations from can be determined from the system of equations
| (10) |
were is the matrix of the derivatives .
Furthermore, the stability analysis can be reduced to the calculation of the Lyapunov exponents (eigenvalues of ) with the corresponding deviation vectors (eigenvectors) , so that (). From the equations (10), we can easily obtain the expressions for the time evolution of the eigenvectors : where the constants should be found from the initial conditions. As a consequence, each arbitrary deviation can be represented as and in this way is fully determined by .
In the analysis of the monostable, bistable and oscillation states, the Lyapunov exponents have been calculated numerically. Fig. 6 shows an example of the oscillating behavior in the vicinity of a subcritical Hopf bifurcation point. Here, for larger , the real part of two complex conjugated Lyapunov exponents corresponds to an unstable limit cycle in the phase space determined by the vectors . Such a cycle involves several kinetical stages which are based on a complex interplay between the CO activator-induced hex() transformation, and the inhibitor-caused reverse decrease of the adsorbate coverages resulting in the hex surface reconstruction.

Fig. 6 demonstrates how the periodic oscillations of the coverages and are related to the surface transformation described by the parameter . The increase of the oxygen coverage up to a saturation value results in a suppression of the oxygen adsorption (stage (i) in the top panel in Fig. 6). Consequently, the reaction step becomes dominating and leads to a decrease of the oxygen coverage . During the CO oxidation, the decreasing CO coverage results in the reverse hex reconstruction of surface, a process reflected by a slight decrease of the state parameter (stage (ii) in Fig. 6). The reconstruction continues until the CO adsorption begins to prevail and the CO-activated hex()-transformation starts again (stage (iii) in Fig. 6). At this stage, the increase of the oxygen adsorption in the () phase results in a repeat of the oscillation cycle.
As is demonstrated in the bottom panel of Fig. 6, the decrease of the CO pressure leads to the disappearance of the oscillations and to a further convergence of the system state to a monostable hex phase.

Fig. 7 presents a bifurcation phase diagram (, ) calculated at K with the indicated areas of monostable, bistable and oscillating behavior. One can see that the oscillating region extends with the increasing which supports a key role of the oxygen in the development of the oscillations. Another remarkable feature is that the region where the oscillations occur coincides with the region of the structural surface transformation which is in full agreement with the experimental observations by LEED eiswirth .
On the diagram shown in Fig. 7, the oscillating regime disappears in the limit which corresponds to the absence of the adsorbed oxygen on the surface. It should be noted that even at extremely low oxygen partial pressures Torr, the calculations still give a region with low oscillation amplitudes induced by small nonzero . This is in contradiction to the experimental indications of the disappearance of oscillations for , a property explained in terms of a blocking of the adsorption sites by CO eiswirth . Due to a mean-field form of the equations used in our modelling, even at low pressures Torr we find a small nonzero which leads to the existence of the oscillations. To improve the results in this range of pressures, more precise methods have to be applied. A possible way to account for the blocking of the adsorption sites by CO would be to perform Monte Carlo simulations which will require further numerical investigations.
The crucial difference between the oscillations on Pt(100) and Pt(110) is related to their spatio-temporal behavior. While Pt(110) oscillations arise due to the coupling through the gas phase and have a well developed regular character, the oscillations on Pt(100) are in general irregular. This irregularity is usually explained by the inhomogeneous nature of Pt(100) surfaces, where the waves of structural transformation develop on structurally different surface patches at different time intervals eiswirth . Due to a weak spatial coupling via the surface diffusion, the resulting integrated oscillation profiles are nonuniform and highly irregularimbihl2 .
To gain more insight into the nature of irregularities on Pt(100), one needs to study comprehensively the oscillations on surfaces which contain patches of different geometries and characterized by different levels of adsorbate coverages. In fact, such studies can be considered in a more wide context, since the modern lithographic techniques give a possibility to prepare prepatterned surfacesimbihl . Moreover, the control of adsorbate coverages can be achieved by the methods of scanning tunneling microscopy and laser induced thermal desorption which allow to create artificial micrometer-size microstructures on the surfaces barth . In this way, the character of the oscillating behavior can be probed and externally tuned.
V CONSEQUENCE OF SURFACE INHOMOGENEITIES: CHEMICAL TURBULENCE
To study the effect of inhomogeneities, we consider a one-dimensional substrate of a size . The substrate contains a partially reconstructed central surface region surrounded by the ()-surface parts where the hex phase is fully lifted. For , the initial surface state is described as . On the substrate, the region has the length and is defined as where is the center of the substrate. In our analysis, we choose the following initial conditions for the surface coverages:
| (13) |
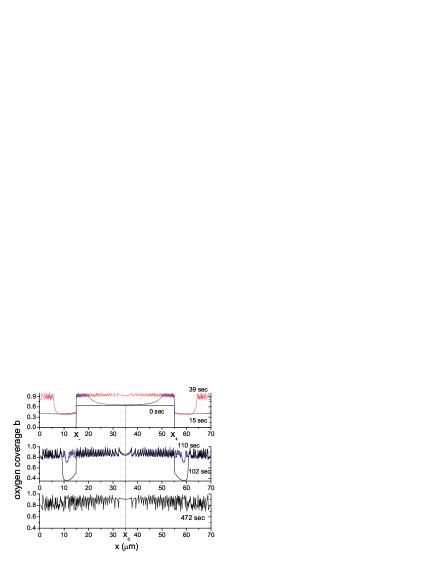
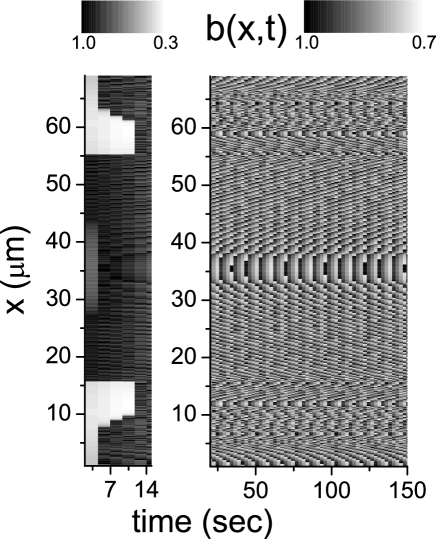
Inside , the temperature, reaction/diffusion parameters and the initial conditions correspond to the homogeneous oscillating state close to the subcritical Hopf bifurcation point. This implies that in the case when will cover the entire substrate (), the time behavior is characterized by the homogeneous periodic oscillations of the state parameter and of the surface coverages and already considered in previous section. In contrast, in the case when the oscillating surface region is located inside the unreconstructed surface area, the gradients of the adsorbate coverages and of the state parameter near the hex/()-interfaces at lead to the transition to a highly nonuniform state. To see this, in Fig. 8 and Fig. 9 we present the evolution of the substrate geometry and adsorbate coverages for a case when mm. One can clearly observe the development of completely new inhomogeneous surface state. In this state, the initial spatial plateau-like distribution of is broken. Moreover, the profiles of the oxygen coverage can be identified as inhomogeneous oscillating standing waves. At the first stages of the time evolution ( sec in Fig. 8), these standing patterns are localized predominantly within . Furthermore, the additional irregular patterns develop near the substrate boundaries due to strongly increased , which leads to a final extension of the inhomogeneous oscillations well beyond on the entire substrate (cases and sec in Fig. 8). The breaking of the homogeneous oscillating regime corresponds to the Benjamin-Feir instability of homogeneous () oscillating waves. The appearing irregular spatial patterns are characterized by a deformation of the wave fronts observed in the amplitude maps of in Fig. 10. These deformations are related to a transition to the regime of phase turbulence kuramoto .
To deeper understand the origin of the standing waves, let us consider the equations (5), (9) governing the spatio-temporal evolution of the system. In the development of the wave instability, the property of the CO coverage to adjust the surface state plays a key role. This is demonstrated by the temporal evolution of and presented in Fig. 9. One can clearly see the development of inhomogeneous spatial profiles from the initial uniformly distributed . The decrease of inside is produced by the initial plateau-like distribution of in this region. As a consequence, the parabolic concave shape of leads to a negative second derivative close to . To see the effect of on the wave properties, we consider a modified equation for which can be derived in the vicinity of on the basis of (5) and (9):
| (14) |
Here . In the region , the expression for can be approximated by a parabola:
| (15) |
with the curvature determined by the parameter .
Furthermore, close to the hex/-interfaces, we have . As a result, in the interface region the time-dependent part of the solution of (14) has the form of a standing wave
| (16) | |||
The parameters and can be found from the boundary conditions . Here is the oxygen coverage in the () areas beyond which is assumed to be homogeneous for simplicity. The frequency is the oscillation frequency of the system. With these boundary conditions, close to the interface () we have
| (17) |
where the function describes the deformation of the homogeneous wave profile due to a nonzero curvature from (15). As the phase deformation is controlled by , the oscillations of during the periodic cycles result in the inhomogeneous wave front oscillating with the constant frequency which is shown in the right panel of Fig. 10.
In order to test the Benjamin-Fair instability characterized by unstable oscillating state with respect to inhomogeneous perturbations, we have calculated the Floquet exponents for different wave numbers . For the analysis of the spatially inhomogeneous states, we introduce the Fourier transforms and
| (18) |
where the range of the wave numbers () is determined by the periodic boundary conditions .
For a state represented by the vector oscillating with a period and described by (5) and (9), the analysis of the Floquet exponents can be reduced to the solution of the eigenvalue problem with the Jacobian where . The condition implies the stability of with respect to small inhomogeneous perturbations . In contrast to this, the opposite condition corresponds to the instability of the homogeneous oscillating state and to the appearance of modulation in the system.

Fig. 11 presents the behavior of the maximal real part of the Floquet exponent which occurs under a variation of the length . One can clearly see that the decrease of leads to a strong increase of for all values of (Fig. 11(a)). The positive for nonzero indicates the formation of the inhomogeneous state presented in Fig. 8 and Fig. 10. Moreover, Fig. 11(b) shows that the bulk-like oscillation state which develops in an initially homogeneous region of a maximal length m, is unstable with respect to inhomogeneous perturbations. On such a substrate, the uniform oscillations cannot be destroyed by homogeneous perturbations which is reflected in in Fig. 11(b). In contrast, due to the positive , the inhomogeneous perturbations diverge and lead to spatially modulated oscillatins.
The principal feature of is its almost dispersionless (flat) character which can be clearly seen in Fig. 11(a). Specifically, for all values of we obtain an initial increase of at small , with a further saturation to the maximal constant value which occurs for larger (Fig. 11(a)). This ”flat-band”-character is in strong contrast to the dispersion usually obtained in the modelling of the global coupling for Pt(110) falcke ; bar2 . In the latter case, has a distinct well-defined maximum at a certain which corresponds to the appearance of spatial clusters with -modulation. In our case, due to the flatness of at larger , no distinctly leading mode can be formed. Instead, all possible -modulations can exist in such an instable system. This is the key reason for a highly irregular form of the standing waves in Fig. 8. Although keeping the basic features related to the central symmetry, the irregular wave profiles are strongly sensitive to the initial state of substrate and to the initial spatial distributions of adsorbate coverages, and in this sence they are random. In the real systems, the type of irregular profile can be pinned by surface defects like steps and surface imperfections, with possible further random changes caused by the noise in the system.
In fact, the obtained spatio-temporal evolution of the irregular oscillations on the substrate is consistent with the the development of irregular patterns on spatially separated patches typically observed on Pt(100). It should be noted that the inhomogeneous oscillating states and standing waves have been previously discussed for CO oxidation on Pt(110) where the main mechanism responsible for these phenomena is the coupling through the gas phase falcke ; bar2 ; mertens . In contrast to Pt(110), on Pt(100) the inhomogeneities in the surface geometry play a central role. Such inhomogeneities lead to the nucleation of adsorbate islands and to a decisive role of the boundaries between geometrically different surface areas in the formation of standing waves and irregular oscillations.
VI CONCLUSIONS
We have studied the CO adsorption and catalytic CO oxidation on inhomogeneous Pt(100) surfaces which contain structurally different hex and ()-domains. In our model, the structural surface transformation is described in terms of a bistability characterized by a coexistence of the reconstructed and surface areas. The bistable region terminates in the critical cusp point which can be approached at higher temperatures and pressures. Due to significant increase of the fluctuations, the behavior in the vicinity of the cusp point should be qualitatively different from the hysteresis-type behavior typically observed in the experiments under ultrahigh vacuum conditions. We have also studied the nucleation and growth of CO islands on inhomogeneous substrate, a process driven by the difference in the desorption properties of CO in the hex and phases. We have also performed the analysis of the oscillation behavior on the surface during the CO oxidation. The surface inhomogeneities lead to the Benjamin-Feir instability and to the irregular standing waves of adsorbate coverages. The obtained deformations of the wave fronts is a direct consequence of structural inhomogeneities typical for Pt(100) which allows to gain deeper insight into the nature of irregular oscillations on this type of surfaces.
References
- (1) J.M. White, Science 218, 429 (1982).
- (2) V. Fiorentini, M. Methfessel, and M. Scheffler, Phys. Rev. Lett. 71, 1051 (1993).
- (3) R.J. Behm, P.A. Thiel, P.R. Norton, and G. Ertl, J. Chem. Phys. 78, 7437 (1983).
- (4) P.A. Thiel, R.J. Behm, P.R. Norton, and G. Ertl, J. Chem. Phys. 78, 7448 (1983).
- (5) A. Hopkinson, J.M. Bradley, X.-C. Guo, and D.A. King, Phys. Rev. Lett. 71, 1597 (1993).
- (6) R. Imbihl and G. Ertl, Chem. Rev. 95, 697 (1995).
- (7) M.P. Cox, G. Ertl, and R. Imbihl, Phys. Rev. Lett. 54, 1725 (1985).
- (8) M. Eiswirth, P. Möller, K. Wetzl, R. Imbihl, and G. Ertl, J. Chem. Phys. 90, 510 (1989).
- (9) R. Imbihl, M.P. Cox, and G. Ertl, J. Chem. Phys. 84, 3519 (1986).
- (10) M. Falcke, H. Engel, and M. Neufeld, Phys. Rev. E 52, 763 (1995).
- (11) M. Bär, M. Hildebrand, M. Eiswirth, M. Falke, H. Engel, and M. Neufeld, Chaos 4, 499 (1994).
- (12) F. Mertens, R. Imbihl, and A. Mikhailov, J. Chem. Phys. 101, 9903 (1994).
- (13) G. Veser, F. Mertens, A. Mikhailov, and R. Imbihl, Phys. Rev. Lett. 71, 935 (1993).
- (14) N. Khrustova, G. Veser, A. Mikhailov, and R. Imbihl, Phys. Rev. Lett. 75, 3564 (1995).
- (15) O. Thostrup, E. Christoffersen, H.T. Lorensen, K.W. Jakobsen, F. Besenbacher, and J.K. Norskov, Phys. Rev. Lett. 87, 126102 (2001).
- (16) M.I. Monine, L.M. Pismen, and R. Imbihl, J. Chem. Phys. 121, 11332 (2004).
- (17) R. Imbihl, M.P. Cox, G. Ertl, H. Müller, W. Brenig, J. Chem. Phys. 83, 1578 (1985).
- (18) V.N. Kuzovkov, O. Kortlüke, and W. von Niessen, J. Chem. Phys. 108, 5571 (1998); O. Kortlüke, V.N. Kuzovkov, and W. von Niessen, J. Chem. Phys. 110, 11523 (1999).
- (19) V.P. Zhdanov and B. Kasemo, Surf. Sci. Lett. 513, L385 (2002).
- (20) N. Pavlenko, R. Imbihl, J.W. Evans, and Da-Jiang Liu, Phys. Rev. E 68, 016212 (2003); N. Pavlenko, J.W. Evans, Da-Jiang Liu, and R. Imbihl, Phys. Rev. E 65, 016121 (2002).
- (21) V.P. Zhdanov and B. Kasemo, Surf. Sci. Rep. 39, 25 (2000).
- (22) K. Krischer, M. Eiswirth, and G. Ertl, J. Chem. Phys. 96, 12 (1992).
- (23) R.P.H. Gasser and E.B. Smith, Chem. Phys. Lett. 1, 457 (1967).
- (24) M. Bär, Ch. Zülicke, M. Eiswirth, and G. Ertl, J. Chem. Phys. 96, 8595 (1992).
- (25) V.N. Kuzovkov, O. Kortlüke, and W. von Niessen, Phys. Rev. E 66, 011603 (2002).
- (26) A.J. Bray, Adv. Phys. 43, 357 (1994).
- (27) M. Hildebrand, M. Ipsen, A.S. Mikhailov, and G. Ertl, New J. Phys. 5, 61.1 (2003).
- (28) R. Imbihl, Prog. Surf. Sci. 44, 185 (1993).
- (29) J.V. Barth, G. Constantini, and K. Kern, Nature 437, 671 (2005).
- (30) Y. Kuramoto, Prog. Theor. Phys. 63, 1885 (1980).