Study of nuclear correlation effects via at 296 MeV
Abstract
We report measurements of the cross section and a complete set of polarization observables for the Gamow–Teller reaction at a bombarding energy of 296 MeV. The data are compared with distorted wave impulse approximation calculations employing transition form factors normalized to reproduce the observed beta-decay value. The cross section is significantly under-predicted by the calculations at momentum transfers 0.5 . The discrepancy is partly resolved by considering the non-locality of the nuclear mean field. However, the calculations still under-predict the cross section at large momentum transfers of 1.6 . We also performed calculations employing random phase approximation response functions and found that the observed enhancement can be attributed in part to pionic correlations in nuclei.
keywords:
Nuclear correlation , Gamow–Teller state , Polarization transfer measurementPACS:
24.70.+s , 25.40.Kv , 27.20.+nThe prediction of pion condensation [1] has prompted extensive experimental and theoretical studies of nuclear spin–isospin correlations. Pion condensation is expected to occur in cool neutron stars (NS) such as 3C58 [2] because pion condensation can accelerate the cooling of NS [3]. It is believed that pion condensation does not occur in normal nuclei; however, precursor phenomena may be observed even in normal nuclei if they are in the proximity of the critical point of the phase transition. The first proposal for possible evidence of a precursor was enhancement of the M1 cross section in proton inelastic scattering [4, 5]. However, this prediction was not supported by measurements of [6, 7]. A possible reason for the absence of the precursor may be that the M1 cross section involves both pionic (spin-longitudinal) and rho-mesonic (spin-transverse) transitions and that the contribution from the rho-mesonic transition might mask the pionic effect.
A further possible source of evidence of a precursor was proposed by Alberico et al. [8]. They calculated the pionic and rho-mesonic response functions, and , in the quasielastic scattering (QES) region. Their results showed significant enhancement in due to nuclear spin–isospin correlations. Great effort has been made to extract the spin response functions and experimentally in scatterings and reactions at intermediate energies [9]. None of the observed ratios show evidence of the theoretically expected enhancement. The fact that the rho-mesonic response is equally important in determining the ratio means that the pionic enhancement may be masked by the contribution from the rho-mesonic component. Recent analysis of QES data shows pionic enhancement in the spin-longitudinal cross section that well represents , suggesting that the lack of enhancement in is due to the rho-mesonic component [10]. It should be noted that pionic enhancement has been also observed in the pure pionic excitation of scattering at = 295 MeV [11].
Recent progress in the development of high intensity polarized ion sources and high efficiency neutron polarimeters has enabled the measurement of a complete set of polarization observables for the reaction at large momentum transfers covering the critical momentum 1.7 of pion condensation. This Gamow–Teller (GT) transition is the isobaric analog to the M1 excitation of scattering. In addition, the reaction is free from isospin mixing effects. Thus, it is very interesting to study nuclear correlation effects in this reaction by separating the cross section into pionic and rho-mesonic components with polarization observables. Furthermore, distorted wave impulse approximation (DWIA) calculations for finite nuclei employing nuclear correlations with continuum random phase approximation (RPA) are available.
In this Letter, we present the measurement of the cross section and a complete set of polarization observables for the reaction. An incident beam energy of 296 MeV is used. This is one of the best energies to study GT transitions since the spin excitations including GT transitions are dominant in the reaction near 300 MeV [12]. Furthermore, distortion effects become minimum around this incident energy. This allows us to extract nuclear structure information reliably by the reaction, such as the nuclear correlation effects. We compare our results with DWIA calculations. Possible evidence of nuclear correlations is observed in the comparison between the experimental and theoretical results. We also compare our data with DWIA calculations employing RPA response functions including the isobar in order to assess the nuclear correlation effects quantitatively.
The data were obtained with a neutron time-of-flight (NTOF) system [13] with a neutron detector and polarimeter NPOL3 system [14] at the Research Center for Nuclear Physics, Osaka University. The NTOF system consists of a beam-swinger dipole magnet, a neutron spin-rotation (NSR) magnet, and a 100-m tunnel. The beam polarization was continuously monitored using two scattering polarimeters; its typical magnitude was about 0.70. The beam energy was determined to be MeV from the kinematic energy shift between two peaks from and . In the beam-swinger system, a beam with a typical current of 500 nA was incident on a self-supporting (98.9% ) target with a thickness of 89 . Neutrons from the target passed through the NSR magnet and were measured by the NPOL3 system in the 100-m TOF tunnel with a resolution of about 500 keV FWHM. The neutron detection efficiency of NPOL3 was determined to be using at , whose cross section is known for = 80–795 MeV [15]. The neutron polarimetry of NPOL3 was calibrated using at [14]. The effective analyzing power of NPOL3 was determined to be , where the first and second uncertainties are statistical and systematic uncertainties, respectively.
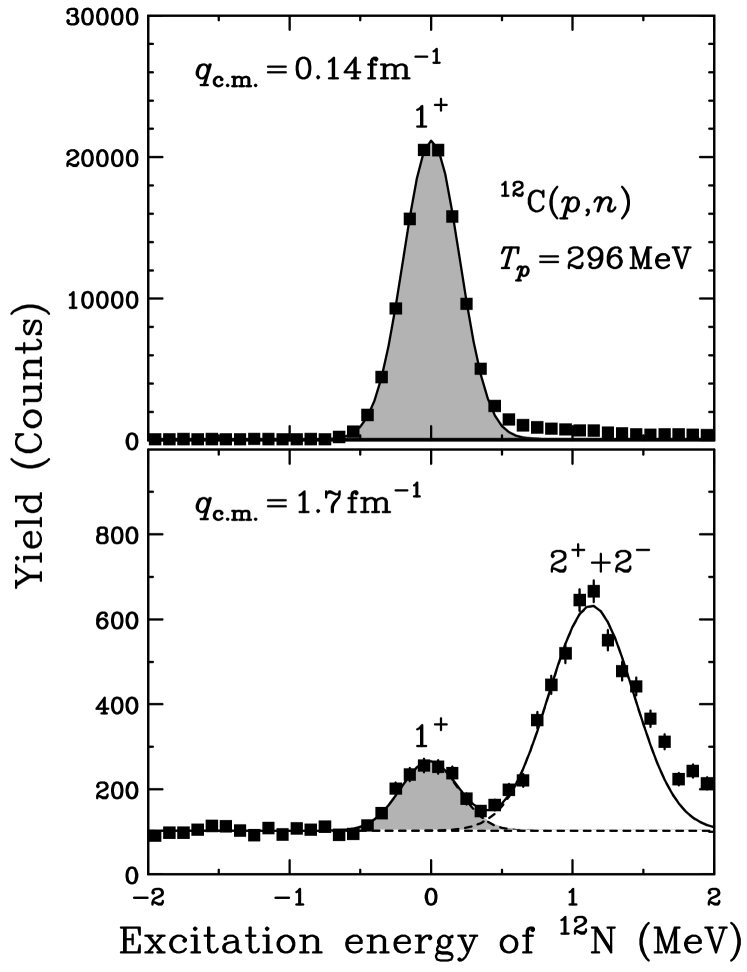
Figure 1 shows the excitation energy spectra of for momentum transfers = and . The GT state at = 0 MeV (ground state) forms a pronounced peak for = , though it is not fully resolved from the neighboring states for = . Therefore, we performed peak fitting for 1.5 MeV to extract the yield of the state. The first and second excited states with = and at = 0.96 and 1.19 MeV [16] were considered in the peak fitting and were assumed to form a single peak because the present energy resolution could not resolve these two peaks. The continuum background from wrap-around and events is also considered in the peak fitting. The dashed curves in Fig. 1 represent the fits to the individual peaks, while the straight dashed line and solid curve represent the background and the sum of the peak fitting, respectively. The peak fittings at all momentum transfers were satisfactory for extracting the yield.
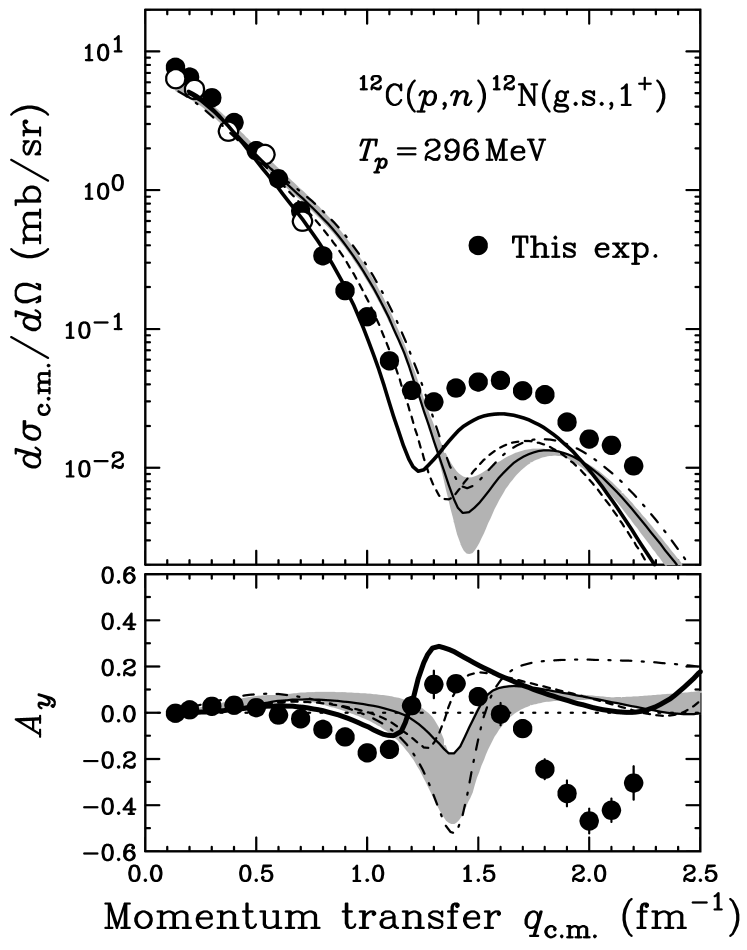
The differential cross section for at = 296 MeV is shown in the upper panel of Fig. 2. The data for the analyzing power were also measured and the results are displayed in the lower panel. The momentum-transfer dependence was measured in the range = 0.1–2.2 , covering the maximum at . The data at = 295 MeV [17] are also displayed as open circles. Both data sets are consistent with each other taking into account the statistical and systematic uncertainties.
We performed DWIA calculations using the computer code crdw [18]. The optical model potential (OMP) was deduced from the global OMPs optimized for in the proton energy range = 29–1040 MeV [19, 20]. The free nucleon–nucleon (NN ) t-matrix parameters were taken from Bugg and Wilkin [21]. The single particle wave functions were generated by a Woods–Saxon (WS) potential with = 1.27 , = 0.67 [22], and = 6.5 MeV [23]. The depth of the WS potential was adjusted to reproduce the separation energies of the orbits. The transition form factor was normalized to reproduce the beta-decay value of 13178 s [24], whose corresponding beta-decay strength was deduced to be = 0.873 [25]. The thin solid curves in Fig. 2 show the DWIA results. The normalization factor for the transition form factor is = 0.17. These calculations reproduce the experimental data reasonably well for small momentum transfers of . However, the angular distributions of both the cross section and the analyzing power shift to higher momentum transfer. Furthermore, the calculations significantly underestimate the cross section at large momentum transfers of .
We also investigated the OMP dependence of DWIA calculations by using other OMPs [26, 27]. The results are shown by the bands in Fig. 2. The OMP dependence is clearly seen around the cross section minimum at 1.4 . However, neither the discrepancy of the angular distributions nor the underestimation of the cross section at large momentum transfer can be resolved.
We also evaluated the proton–particle and neutron–hole configuration dependence on the transition form factor. In the above calculations, the Hartree–Fock (HF) state of was described as the state fully occupying the and orbits. Thus, the GT transition is described as a combination of a proton–particle and a neutron–hole (). However, the Cohen and Kurath wave functions (CKWFs) [28] show that the , , and configurations also play important roles in the GT transition. Therefore we performed DWIA calculations with CKWFs using the computer code dw81 [29]. We used the same OMPs and single particle wave functions as in the previous calculations. The NN t-matrix parametrized by Franey and Love [12] at 325 MeV was used. The dotdash curves in Fig. 2 denote the DWIA results using the CKWSs with = 0.89. The cross section is slightly enhanced at all momentum transfers. However, the oscillatory structures, especially the momentum transfers where the cross section takes a minimum or maximum value, were not improved by using the realistic CKWFs.
Therefore, we investigated the non-locality of the nuclear mean field by using a local effective mass approximation [30] in the form of
| (1) |
where is the nucleon mass and is a WS radial form. The dashed curves in Fig. 2 show the DWIA results with = [31, 32] and = 0.17. The angular distributions of both the cross section and the analyzing power shift to lower momentum transfer for smaller , and a standard value of improves the agreement with the data. This is because the transition form factor effectively moves outwards due to the Perey factor effect [33]. However, there is still a discrepancy between the experimental and theoretical results around .
Next, we consider the nuclear correlation effects. We performed DWIA calculations with the RPA response functions employing the model interaction . In the spin–isospin channel, can be expressed as [9]
| (2) |
with spin-longitudinal and spin-transverse parts
| (3) |
where and are the spin-longitudinal and spin-transverse strengths, respectively, and are the nucleon Pauli spin and isospin matrixes, and and are the spin and isospin transition operators that excite N to . The strengths and are determined by the pion and rho-meson exchange interactions and the Landau–Migdal (LM) interaction specified by the LM parameters , , and [9]. For the pion and rho-meson exchange interactions, we have used the coupling constants and meson parameters from a Bonn potential which treats explicitly [34]. The LM parameters were estimated to be = and = [35] by using the peak position of the GT giant resonance and the GT quenching factor at = 0 [36, 37] as well as the isovector spin-longitudinal polarized cross section in the QES process at 1.7 [10]. The thick solid curves in Fig. 2 show the DWIA result using = 0.65, = 0.35, and = with = 0.28. Here, we fixed = 0.5 [38] since the dependence of the results is very weak. In the continuum RPA, the GT state couples to particle-unbound states, which shifts the response function in the coordinate space (-space) to large values. Thus the angular distributions further shift to lower momentum transfer. The RPA correlation also enhances the cross section at large momentum transfers of 1.6 . Consequently, the discrepancy between the experimental and theoretical results could be resolved in part by considering the nuclear correlation effects in the RPA together with the non-locality effects of the nuclear mean field. Nuclear correlation effects are expected to be more clearly seen in the oscillatory structures of polarized cross sections. Therefore, we have separated the cross section into polarized cross sections by using the measured polarization observables.
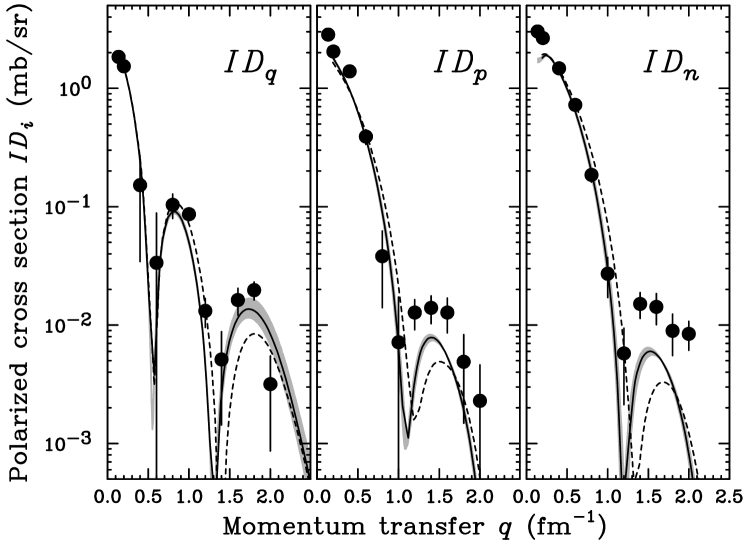
Figure 3 shows three polarized cross sections, , , and , as a function of momentum transfer. The spin-scalar polarized cross section is not shown because it is very small in the present spin-flip GT case. The error bars represent the statistical uncertainties of the data. The systematic uncertainties are about 30% for all at 1.6 . The solid curves in Fig. 3 denote the DWIA calculations with the RPA response function, and the bands represent the and dependences within = and = . The dashed curves are the DWIA calculations with the free response function. The momentum transfer dependence of all the three spin-dependent shift to lower momentum transfer and are enhanced around = 1.6 due to the nuclear correlation effects, which improves the agreement with the data. Figure 4 shows the DWIA calculations without the normalization. The dashed and dotted curves are the DWIA results with the free response function and with the RPA response function employing only the LM interaction, respectively. The figure shows quenching of all over the whole momentum transfer region due to the repulsive LM interaction, as well as forward shifts in the angular distributions due to outward shifts of the response functions in -space by the continuum coupling in the RPA. The solid curves are the DWIA results with the RPA response function employing the model interaction . The pion exchange effects in are clearly seen as an enhancement at large momentum transfers. In contrast, the rho-meson exchange effects in and are expected to be small, mainly due to the weak momentum transfer dependence of in the present momentum transfer region [9]. It should be noted that in the analysis shown in Fig. 3, the transition form factors are normalized to reproduce , and thus the calculated are normalized at small momentum transfers. Therefore, the quenching due to the LM interaction is effectively included through the normalization factor at small momentum transfers. However, the modification of the angular distributions due to the shape change of the response functions in -space could not be included through this normalization, and thus this effect is observed as an enhancement in and in Fig. 3 at large momentum transfers of 1.5 . We also note that the momentum transfer dependence of the NN t-matrix is important for the momentum transfer dependence of . For example, the first minimum of is due to the first minimum of the relevant NN t-matrix component [12].
The DWIA calculations employing nuclear correlation effects give better descriptions of all three spin-dependent . However, there are still significant discrepancies at large momentum transfers around 1.6 . The under-estimation of the theoretical calculations might be resolved using a realistic HF state of because the DWIA calculation with CKWFs is enhanced around 1.6 compared with that for the pure configuration, as shown in Fig. 2. Thus, we deduced from the DWIA results with CKWFs; the results are shown by the solid curves in Fig. 5. The dashed curves correspond to the DWIA results for the pure configuration. The use of realistic CKWFs enhances and at large momentum transfers, and thus the discrepancies between the experimental and theoretical results seen in Fig. 3 would be due to the simplification of the HF state of in the RPA calculations. However, the calculations with CKWFs give smaller values. Thus, the reason for the difference in seems to be different to that for and . This is possibly due to medium modifications of the effective NN interaction. It should be noted that the enhancement of at large momentum transfers is commonly seen in QES and in stretched state excitations [39] and that this enhancement indicates the enhancement of of the NN scattering amplitude in a Kerman–MacManus–Thaler (KMT) representation [40]. Thus, the enhancement of might be responsible for the enhancement of the corresponding rho-mesonic . We note that in both QES and stretched state excitations, no modification of the spin-transverse amplitude has been observed for , whereas a small reduction of the spin-longitudinal amplitude has been indicated for [39]. If we take into account the reduction of , the enhancement of due to the nuclear correlations should be larger than the current prediction using = 0.65 and = 0.35, which can be achieved by using smaller, reasonable LM parameters, and [9].
In conclusion, our measurement of the cross section and a complete set of polarization observables of the reaction enables us to study nuclear correlation effects at an intermediate energy of = 296 MeV where the theoretical DWIA calculations should be reliable due to the simple reaction mechanism. A significant difference in the momentum-transfer dependence and an enhancement around 1.6 were observed in the cross section compared to the DWIA calculations with Cohen–Kurath wave functions. A DWIA calculation employing the RPA response function with = 0.65 and = 0.35 and a local effective mass with = reproduces the momentum-transfer dependence and gives an enhancement of the cross section at 1.6 . All three spin-dependent polarized cross sections also support the existence of nuclear correlation effects. In theoretical calculations, the use of a realistic shell-model wave function seems to be important to reproduce the experimental data at large momentum transfers. However, this effect could not be included in the present RPA calculations. Therefore, a more comprehensive and detailed theoretical analysis is needed to explain quantitatively the nuclear correlations inside nuclei.


References
- [1] A. B. Migdal, Zh. Eksp. Teor. Fiz. 61, (1971) 2210; Sov. Phys. JETP 34, (1972) 1184.
- [2] P. O. Slane, D. J. Helfand, S. S. Murray, Astrophys. J. 571 (2002) L45.
- [3] S. Tsuruta, et al., Astrophys. J. 571 (2002) L143.
- [4] H. Toki, W. Weise, Phys. Rev. Lett. 42 (1979) 1034.
- [5] J. Delorme, et al., Phys. Lett. B 89 (1980) 327.
- [6] J. R. Comfort, W. G. Love, Phys. Rev. Lett. 44 (1980) 1656.
- [7] J. R. Comfort, et al., Phys. Rev. C 21 (1980) 2147.
- [8] W. M. Alberico, M. Ericson, A. Molinari, Phys. Lett. B 92 (1980) 153.
- [9] M. Ichimura, H. Sakai, T. Wakasa, Prog. Part. Nucl. Phys. 56 (2006) 446.
- [10] T. Wakasa, et al., Phys. Rev. C 69 (2004) 054609.
- [11] T. Wakasa, et al., Phys. Lett. B 632 (2006) 485.
- [12] M. A. Franey, W. G. Love, Phys. Rev. C 31 (1985) 488.
- [13] H. Sakai, et al., Nucl. Instrum. Methods Phys. Res. A 369 (1996) 120.
- [14] T. Wakasa, et al., Nucl. Instrum. Methods Phys. Res. A 547 (2005) 569.
- [15] T. N. Taddeucci, et al., Phys. Rev. C 41 (1990) 2548.
- [16] F. Ajzenberg-Selove, et al., Nucl. Phys. A 433 (1985) 100.
- [17] T. Wakasa, et al., Phys. Rev. C 51 (1995) R2871.
- [18] K. Kawahigashi, et al., Phys. Rev. C 63 (2001) 044609.
- [19] S. Hama, et al., Phys. Rev. C 41 (1990) 2737.
- [20] E. D. Cooper, et al., Phys. Rev. C 47 (1993) 297.
- [21] D. V. Bugg, C. Wilkin, Phys. Lett. B 152 (1985) 37.
- [22] A. Bohr, B. R. Mottelson, Nuclear structure Volume I: Single-Particle Motion, Benjamin, New York, 1969.
- [23] K. Nishida, M. Ichimura, Phys. Rev. C 51 (1995) 269.
- [24] D. E. Alburger, A. M. Nathan, Phys. Rev. C 17 (1978) 280.
- [25] K. Schreckenbach, et al., Phys. Lett. B 349 (1995) 427.
- [26] S. Qing-biao, F. Da-chun, Z. Yi-zhong, Phys. Rev. C 43 (1991) 2773.
- [27] F. T. Baker, et al., Phys. Rev. C 48 (1993) 1106.
- [28] S. Cohen, D. Kurath, Nucl. Phys. 73 (1965) 1.
- [29] R. Schaeffer and J. Raynal, Program dw70 (unpublished); J. Raynal, Nucl. Phys. A 97, 572 (1967); J. R. Comfort, Extended version dw81 (unpublished).
- [30] T. Wakasa, et al., Phys. Rev. C 59 (1999) 3177.
- [31] N. V. Giai, P. V. Thieu, Phys. Lett. B 126 (1983) 421.
- [32] C. Mahaux, R. Sartor, Nucl. Phys. A 481 (1988) 381.
- [33] F. G. Perey, B. Buck, Nucl. Phys. A 32 (1962) 353.
- [34] R. Machleidt, K. Holinde, C. Elster, Phys. Rep. 149 (1987) 1.
- [35] T. Wakasa, M. Ichimura, H. Sakai, Phys. Rev. C 72 (2005) 067303.
- [36] T. Wakasa, et al., Phys. Rev. C 55 (1997) 2909.
- [37] K. Yako, et al., Phys. Lett. B 615 (2005) 193.
- [38] W. H. Dickhoff, et al., Phys. Rev. C 23 (1981) 1154.
- [39] T. Wakasa, et al., Phys. Lett. B 645 (2007) 402.
- [40] A. K. Kerman, H. McManus, R. M. Thaler, Ann. Phys. 8 (1969) 551.