The Gamma-ray Albedo of the Moon
Abstract
We use the GEANT4 Monte Carlo framework to calculate the -ray albedo of the Moon due to interactions of cosmic ray (CR) nuclei with moon rock. Our calculation of the albedo spectrum agrees with the EGRET data. We show that the spectrum of -rays from the Moon is very steep with an effective cutoff around 3–4 GeV (600 MeV for the inner part of the Moon disk) and exhibits a narrow pion-decay line at 67.5 MeV, perhaps unique in astrophysics. Apart from other astrophysical sources, the albedo spectrum of the Moon is well understood, including its absolute normalisation; this makes it a useful “standard candle” for -ray telescopes. The steep albedo spectrum also provides a unique opportunity for energy calibration of -ray telescopes, such as the forthcoming Gamma Ray Large Area Space Telescope (GLAST). Since the albedo flux depends on the incident CR spectrum which changes over the solar cycle, it is possible to monitor the CR spectrum using the albedo -ray flux. Simultaneous measurements of CR proton and helium spectra by the Payload for Antimatter-Matter Exploration and Light-nuclei Astrophysics (PAMELA), and observations of the albedo -rays by the GLAST Large Area Telescope (LAT), can be used to test the model predictions and will enable the LAT to monitor the CR spectrum near the Earth beyond the lifetime of the PAMELA.
Subject headings:
elementary particles — line: formation — radiation mechanisms: non-thermal — Moon — cosmic rays — gamma-rays: theory1. Introduction
Interactions of Galactic CR nuclei with the atmospheres of the Earth and the Sun produce albedo -rays due to the decay of secondary neutral pions and kaons (e.g., Seckel et al., 1991; Orlando et al., 2007). Similarly, the Moon emits -rays due to CR interactions with its surface (Morris, 1984; Thompson et al., 1997). However, contrary to the CR interaction with the gaseous atmospheres of the Earth and the Sun, the Moon surface is solid, consisting of rock, making its albedo spectrum unique.
Due to the kinematics of the collision, the secondary particle cascade from CR particles hitting the Moon surface at small zenith angles develops deep into the rock making it difficult for -rays to get out. The spectrum of the albedo -rays is thus necessarily soft as it is produced by a small fraction of low-energy splash particles in the surface layer of the moon rock. The high energy -rays can be produced by CR particles hitting the Moon surface with a more tangential trajectory. However, since it is a solid target, only the very thin limb contributes to the high energy emission.
The -ray albedo of the Moon has been calculated by Morris (1984) using a Monte Carlo code for cascade development in the Earth’s atmosphere that was modified for the Moon conditions. However, the CR spectra used as input in the Morris calculation differ considerably from recent measurements by AMS (Alcaraz et al., 2000a, b) and BESS (Sanuki et al., 2000) at both low and high energies. In particular, the CR proton spectrum used by Morris produces the correct intensity only around 10 GeV. Additionally, due to the lack of accelerator data and models a number of approximations and ad-hoc assumptions were required to calculate the hadronic cascade development in the solid target of the Moon’s surface.
The Moon has been detected by the EGRET as a point source with integral flux cm-2 s-1 (Thompson et al., 1997), 24% below the predictions by Morris (1984) although the spectral shape agrees with the data. The observed spectrum is steep and yields only the upper limit cm-2 s-1 above 1 GeV. At lower energies, -ray spectroscopy data acquired by the Lunar Prospector have been used to map the elemental composition of the Moon surface (Lawrence et al., 1998; Prettyman et al., 2006).
2. Monte Carlo simulations
Since the first calculation of the Moon albedo (Morris, 1984), computers and Monte Carlo codes have advanced considerably, while more data on particle interactions and CR fluxes have become available. The modern GEANT4 toolkit111Available from http://cern.ch/geant4 (Agostinelli et al., 2003) is widely used across particle physics, medical science, and space physics to simulate the passage of particles through matter. It provides extensive functionality including physics models, tracking, geometry, and visualisation. A full range of electromagnetic and hadronic physics processes over a wide energy range are available including long-lived particles. A large set of materials and elements are also included. Together with the extensive documentation and examples, it is straightforward to describe and simulate complicated detectors and interactions.
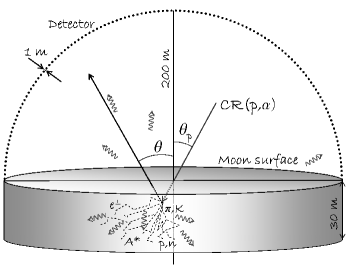
In the present work, we use version 8.2.0 of the GEANT4 toolkit. Figure 1 illustrates our beam/target/detector setup for simulating CR interactions in the Moon. The primary CR beam (protons, helium nuclei) is injected at different incident angles into a moon rock target. We take the composition of the moon rock to be 45% SiO2, 22% FeO, 11% CaO, 10% Al2O3, 9% MgO, and 3% TiO2 by weight, consistent with mare basalt meteorites and Apollo 12 and 15 basalts (Lawrence et al., 1998; Anand et al., 2003; Prettyman et al., 2006). A thin hemispherical detector volume surrounding the target is used to record the secondary -ray angular and energy distributions in the simulation.
In GEANT4 the specification of the physics list is of considerable importance since it is where all the physics to be used in the simulation is defined. In the physics list, the user defines all necessary particles in the simulation, assigns physics processes to each, and sets appropriate range cuts for secondary production. In GEANT4 there is a distinction between processes and models: processes take care of particle decays and interactions while for any process there may be one or more models and cross section parameterizations. For most processes (electromagnetic, elastic, decay) there is only one model. However, for hadronic processes and, in particular, inelastic processes, more than one model can be used over different energy ranges. The preference for one model over another is not specified in the documentation but depends on the particular application. Fortunately, to guide users of the toolkit, extensive examples are provided for use cases in different settings.
To construct our physics list, we examined the two examples in the GEANT4 distribution that most closely resembled our simulation setup: the “cosmicray_charging” and “radioprotection” examples in the 8.2.0 release. We included all relevant particles (leptons, photons, pions, kaons, heavy mesons, protons, antiprotons, neutrons, antineutrons, and resonances) and included the standard electromagnetic processes (ionisation, bremsstrahlung, multiple scattering, etc.) appropriate for each particle. For hadronic processes, we included “at rest” processes, such as negative pion and kaon absorption, neutron and muon capture, antiproton and antineutron annihilation, and “in flight” processes such as elastic and inelastic scattering (photo- and electro-nuclear and other secondary production), in-flight capture, and fission. For all long-lived unstable particles the decay process was also included.
For inelastic processes GEANT4 provides different types of hadronic shower models, each of which has an intrinsic range of applicability. Three types of hadronic shower models are available: data-driven models for high precision treatment of the transport of low energy neutrons, parameterised models based on a re-implementation of the GHEISHA package of GEANT3.21, and theory-based models that cover a wide energy range. Pre-packaged combinations of these models are provided with the GEANT4 distribution. However, for all of these inelastic scattering by ions is only treated up to 100 MeV. Cosmic-ray helium is a significant component of the CR flux interacting in the Moon’s surface, and we consider beam energies considerably higher than this in our simulations. Furthermore, many of the pre-packaged lists are intended for use in applications such as high energy collider simulations where the treatment of low energy processes is less important.
Guided by the aforementioned examples and the documentation, we constructed the hadronic physics list using the following models. For energies up to 70 MeV, a pre-equilibrium decay and evaporation (PreCo) model for interactions of protons and neutrons was used. Above this, a Bertini cascade (BERT) model between 60 MeV and 4 GeV, a parameterised model (LEP) from 3 GeV to 15 GeV, and a quark gluon string (QGS) model from 12 GeV up to 100 GeV were employed. For pions and kaons, the BERT model was used up to 4 GeV with the LEP and QGS models used over the same energy ranges as for protons and neutrons. Deuterons, tritons, and alpha particles use the low energy inelastic code up to 100 MeV, and a binary ion cascade model from 40 MeV to 40 GeV. Each model is used in its applicable energy range (D. Wright, private communication). In the energy ranges where there are overlaps, the GEANT4 code interpolates between the models. The overlap ranges were chosen to ensure as smooth a transition between the models as possible. These models compare well with data and other particle transport codes in standard accelerator and space environments (Wellisch, 2003; Ersmark et al., 2004)222see also physics lists at http://geant4.slac.stanford.edu/ and http://www.particle.kth.se/desire/.
The -ray yield is calculated using the GEANT4 beam/target setup with a Monte Carlo method; here is the kinetic energy per nucleon of the incident particle, is the incident polar angle, is the energy of -rays, and is the polar photon emission angle.
Figure 2 (left) shows the total secondary -ray yield and the contribution by different processes integrated over all emission angles outward from the Moon’s surface for protons with MeV and incident angle . The -ray emission is produced in a number of processes: pion and kaon decay, secondary electron and positron bremsstrahlung, and so forth. A considerable flux of -rays is produced in nuclear reactions such as neutron capture and nonelastic scattering (Lawrence et al., 1998; Prettyman et al., 2006); the features below 10 MeV are due to nuclear de-excitation lines, where the most prominent contribution comes from oxygen nuclei. The development of the cascade in the rock causes modification of the yield spectra from the usual spectral distributions. For example, the -decay spectrum would normally be symmetric about 67.5 MeV, instead it has a significant low-energy extension due to Compton scattering of the -rays in the rock.

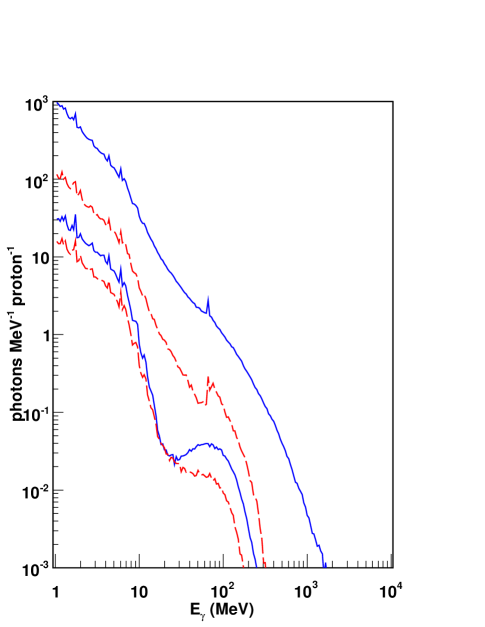
Figure 2 (right) shows the secondary -ray yields integrated over all emission angles outward from the Moon surface for protons with MeV and 10000 MeV at incident angles and 1, respectively. The shapes of the yield curves for different incident angles are very similar to each other for the case of low energy protons where the secondary particles (pions, kaons, neutrons, etc.) are produced nearly at rest. In the high energy case, the secondary distribution for protons incident near zenith has a cutoff above 500 MeV. Further away from zenith, higher yields of secondary -rays are produced while the spectrum of -rays becomes progressively harder. This is a result of the cascade developing mostly in the forward direction: for near zenith primaries, most high energy secondary -rays will be absorbed in the target, while a small fraction of splash albedo particles, mostly low energy ones, produce the soft spectrum -rays; further from zenith, the high energy secondary -rays will shower out of the Moon surface.
The clear narrow line at 67.5 MeV in Figure 2 (left and right panels) is due to neutral pions decaying near rest. To ensure that it is not an artefact of the simulation, we made an extensive analysis of the hadronic interaction models employed in GEANT4 and various geometries of the beam/target/detector configuration. Independently of the hadronic interaction model used, the line is always present, but its intensity may vary slightly. However, dependent on the beam/target/detector configuration the line may appear or disappear. The most feasible explanation of this effect is the following. The line is always present since there is always some small fraction of pions decaying at rest, but in the most common configurations, such as thin target, gaseous target, and/or detector position in the forward hemisphere, the line is hidden under the strong continuum background. In our case of a solid thick target and the detector location in the backward hemisphere, a considerable part of the continuum background is cut off and the line becomes visible.
There are several reasons why the continuum background is cut off. The interaction length of a GeV proton in oxygen (the most abundant element in the moon rock) is 80 g cm-2, which corresponds to 25 cm for the moon rock (density 3.3 g cm-3). As the cascade develops, energetic particles penetrate deep into the rock, too deep for -rays to come out. The -ray albedo is produced by relatively low-energy particles at the depth of about one radiation length, 34 g cm-2, which corresponds to 10 cm for the moon rock. The pions decaying in the upper layer of the moon rock are necessarily low-energy (splash) particles while the high-energy part of the cascade producing the continuum spectrum is cut off because of the kinematics of the interaction and the forward cascade development. Since many photons are coming from a large depth, this explains the large contribution of the Compton scattered -rays below 60 MeV (Figure 2). For lower energy protons, this also explains why the 67.5 MeV line is not prominent, since the development of the cascade then occurs relatively close to the surface producing a continuum that essentially washes out any line feature.
3. Calculations
The CR spectrum above the geomagnetic cutoff near Earth (at 1 AU) can be directly measured by balloon-borne instruments or spacecraft. However, it has been done during short flights at different phases of solar activity. To calculate the Moon albedo at an arbitrary modulation level, we use the local interstellar (LIS) spectra of CR protons and helium as fitted to the numerical results of the GALPROP propagation model (reacceleration and plain diffusion models, Table 1 in Ptuskin et al. (2006)); the CR particle flux at an arbitrary phase of solar activity at 1 AU can then be estimated using the force-field approximation (Gleeson & Axford, 1968):
| (1) |
where is the LIS spectrum of CR species, is the kinetic energy per nucleon, is the total energy per nucleon, is the modulation potential, and are the nucleus charge and atomic number correspondingly, and is the nucleon mass.
To fit the LIS CR spectra we choose a function of the form:
| (2) |
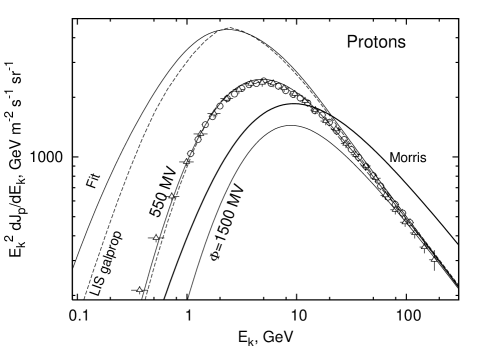
where the flux units are m-2 s-1 sr-1 (GeV/nucleon)-1 and the parameter values are given in Table 1. The latter are not unique and other sets could produce similar quality fits, but this does not affect the final results. Figure 3 shows the LIS CR proton spectrum and modulated one compared with the BESS (Sanuki et al., 2000) and AMS (Alcaraz et al., 2000a) data taken during the period of moderate solar activity. The parameters given in Table 1 yield a LIS proton spectrum that is somewhat higher than the GALPROP LIS below 2 GeV (plain diffusion model 44_999726, Ptuskin et al., 2006). However, the fit to the AMS and BESS data after modulation ( MV) is good. The spectrum labelled MV corresponds to the period of high solar activity. The proton spectrum used by Morris (1984) is shown by the thick solid line. The disagreement with the modern CR proton data is considerable. For the helium spectrum, the parameters given in Table 1 provide a good fit to the GALPROP LIS, and agree with the AMS (Alcaraz et al., 2000b) data after modulation ( MV); at high energies the fit also passes through JACEE (Asakimori et al., 1998) and Sokol (Ivanenko, et al., 1993) data.
| particle | ||||||||||
|---|---|---|---|---|---|---|---|---|---|---|
| proton | 1 | 0.458 | 2.75 | –3.567 | 0.936 | 4.90 | 14.4 | 6.88 | ||
| helium | 1 | 1.116 | 3.75 | 2.611 | 4.325 | 3.611 | 0.219 | 0.923 | 2.58 |
Note. — Intensity units: m-2 s-1 sr-1 (GeV/nucleon)-1.
The -ray albedo flux at the Earth is calculated as:
| (3) |
where is the angular distance from the geometrical center of the Moon disk as seen from the Earth, is the Jacobian,
| (4) |
| (5) |
km is the Moon radius, and km is the distance to the Moon.
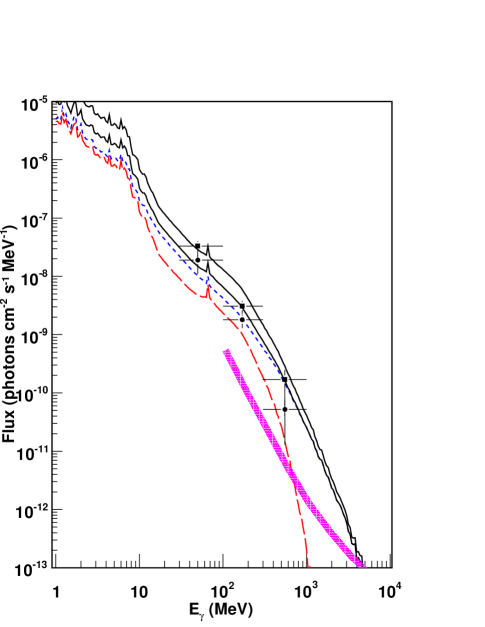
Figure 4 shows the calculated total -ray albedo spectrum for CR protons and helium compared to the EGRET data for periods of lower (upper solid: MV) and higher (lower solid: MV) solar activity. Taking into account that the exact CR spectra during the EGRET observations are unknown, the agreement with the data is remarkable. The broken lines show the spectra from the limb (outer ) and the central part of the disk ( across) for the case of higher solar activity. As expected, the spectra from the limb and the central part are similar at lower energies (10 MeV); at high energies the central part exhibits a softer spectrum so that virtually all photons above 600 MeV are emitted by the limb.
Interestingly, the pion-decay line is still significant even when the -ray yields are integrated over the spectrum of CR, although, its intensity is small relative to the total albedo flux. The line perhaps always exists due to the splash albedo pions, but in case of a thin and/or gaseous target (usual in astrophysics) it is indistinguishable from the background -rays (see Section 2 for more discussion).
4. Discussion
The GLAST LAT is scheduled for launch by NASA in early 2008. It will have superior angular resolution and effective area, and its field of view (FoV) will far exceed that of its predecessor, the EGRET (McEnery et al., 2004). The LAT will scan the sky continuously providing complete sky coverage every two orbits (approximately 3 hr). The on-axis effective area of the LAT increases from 3000 cm2 at 100 MeV to 8500–9000 cm2 at 1 GeV and higher333see http://glast.stanford.edu. In this case, the point spread function (PSF) of the instrument has a 68% containment radius at 100 MeV reducing dramatically at higher energies: at 1 GeV, at 2 GeV, and at 10 GeV. Using only events from the front section of the LAT, the PSF improves to a 68% containment radius of at 100 MeV, at 1 GeV, at 2 GeV, and at 10 GeV, but the on-axis effective area is essentially halved.
About 20% of the time the Moon will be in the FoV at different viewing angles. The photon flux expected from the Moon for MV above 100 MeV, 1 GeV, and 4 GeV is , , and photons cm-2 s-1, respectively. For MV, the expected flux is reduced by a factor of 2 at 100 MeV only. With these fluxes and the above values for the effective area, and allowing for an additional factor 2 reduction to take into account time off-axis, instrumental deadtime, and South Atlantic Anomaly traversals, we estimate the LAT will collect , , and 5 photons, respectively, in the above energy ranges in one year. These numbers are reduced by a factor of two if only events from the front section of the LAT are used. Interestingly, the albedo flux at low energies is high enough that the impact of the broader PSF is significantly reduced.
Measuring -rays from the Moon presents several interesting possibilities for the LAT. Apart from other astrophysical sources, the albedo spectrum of the Moon is well understood, including its absolute normalisation, while the Moon itself is a “moving target” passing through high Galactic latitudes and the Galactic centre region. This makes it a useful “standard candle” for the GLAST LAT at energies where the PSF is comparable to the Moon size , i.e., at 1 GeV and higher. At these energies the albedo flux is essentially independent of the solar modulation. At lower energies the -ray flux depends on the level of the solar modulation and thus can be used to infer the incident CR spectrum. A simultaneous presence of the PAMELA on-orbit capable of measuring protons and light nuclei with high precision (Picozza et al., 2006) provides a necessary input for accurate prediction of the albedo flux and a possible independent calibration of the GLAST LAT. An additional bonus of such a calibration is the possibility to use the GLAST observations of the Moon to monitor the CR spectra near the Earth beyond the projected lifetime of the PAMELA (currently 3 years).
The line feature at 67.5 MeV from -decay produced by CR particles in the solid rock target is interesting. There is no other astrophysical object predicted to produce such a narrow line and there is no other line expected except, perhaps, from dark matter annihilation. The lower energy limit of the LAT instrument is below 20 MeV while the energy resolution is 15% at 100 MeV, and improves at higher energies. With a suitable event selection it may be possible to observe the line; if so, it will provide a possibility of in-orbit energy calibration. Another possibility for energy calibration at higher energy is provided by the steep albedo spectrum above 100 MeV: a small error in the energy determination will result in a large error in the intensity.
Because of the steep albedo spectrum, very few photons will be detected above 3–4 GeV. The central part of the Moon has an even steeper spectrum with an effective cutoff at 600 MeV. Above a few GeV, the Moon presents almost a black spot on the -ray sky providing an opportunity to screen out a piece of the sky. Additionally, the expected irreducible background rate444-rays produced in the FoV by CR interactions in the inert material surrounding the LAT. at these energies within the solid angle subtended by the Moon is 0.1 photons per year (S. Digel, private communication). The absence of any significant excess over the predicted rate will be a useful cross check on the expected irreducible background.
5. Conclusions
The -ray albedo of the Moon makes it a unique calibration target for -ray telescopes. Apart from other astrophysical sources the albedo spectrum is well understood, including its absolute normalisation. The albedo of the Moon is dim, especially its central part at high energies. Its lower energy part exhibits a narrow pion-decay line at 67.5 MeV, perhaps unique in astrophysics and never before observed, while its continuum intensity depends on the phase of the solar cycle and allows one to monitor the ambient spectrum of CR particles. The GLAST LAT instrument is well suited for such observations.
References
- Agostinelli et al. (2003) Agostinelli, S., et al. 2003, Nucl. Instr. Meth. Phys. Res. A, 506, 250
- Alcaraz et al. (2000a) Alcaraz, J., et al. 2000a, Phys. Lett. B, 490, 27
- Alcaraz et al. (2000b) Alcaraz, J., et al. 2000b, Phys. Lett. B, 494, 193
- Anand et al. (2003) Anand, M., et al. 2003, Meteoritics & Planetary Science, 38, 485
- Asakimori et al. (1998) Asakimori, K., et al. 1998, ApJ, 502, 278
- Ersmark et al. (2004) Ersmark, T., et al. 2004, IEEE Trans. Nuc. Sci., 51, 1378
- Gleeson & Axford (1968) Gleeson, L. J. & Axford, W. I. 1968, ApJ, 154, 1011
- Ivanenko, et al. (1993) Ivanenko, I. P., et al. 1993, Proc. 23rd Int. Cosmic Ray Conf. (Calgary), 2, 17
- Lawrence et al. (1998) Lawrence, D. J., et al. 1998, Science, 281, 1484
- McEnery et al. (2004) McEnery, J. E., Moskalenko, I. V., & Ormes, J. F. 2004, in Astrophys. & Spa. Sci. Library, 304, Cosmic Gamma-Ray Sources, eds. Cheng, K. S. & Romero, G. E. (Dordrecht: Kluwer), 361
- Michelson (2007) Michelson, P.F. 2007, in AIP Conf. Proc., 921, First Int. GLAST Symp., ed. Ritz, S. et al. (Melville: AIP), 8
- Morris (1984) Morris, D. J. 1984, J. Geophys. Res. A, 89, 10685
- Moskalenko & Porter (2007) Moskalenko, I. V., & Porter, T. A. 2007, Proc. 30th Int. Cosmic Ray Conf. (Merida), in press; arXiv:0705.3856
- Orlando et al. (2007) Orlando, E., Petry, D., & Strong, A. W. 2007, in AIP Conf. Proc., 921, First Int. GLAST Symp., ed. Ritz, S. et al. (Melville: AIP), 502
- Picozza et al. (2006) Picozza, P., et al. 2006, APh, 27, 296
- Prettyman et al. (2006) Prettyman, T. H., et al. 2006, J. Geo. Phys. Res., 111, 12007
- Ptuskin et al. (2006) Ptuskin, V. S., Moskalenko, I. V., Jones, F. C., Strong, A. W., & Zirakashvili, V. N. 2006, ApJ, 642, 902
- Ritz (2007) Ritz, S. 2007, in AIP Conf. Proc., 921, First Int. GLAST Symp., ed. Ritz, S. et al. (Melville: AIP), 3
- Sanuki et al. (2000) Sanuki, T., et al. 2000, ApJ, 545, 1135
- Seckel et al. (1991) Seckel, D., Stanev, T., & Gaisser, T. K. 1991, ApJ, 382, 652
- Thompson et al. (1997) Thompson, D. J., Bertsch, D. L., Morris, D. J., & Mukherjee, R. 1997, J. Geophys. Res. A, 120, 14735
- Wellisch (2003) Wellisch, J. P. 2003, Nucl. Instr. Meth. Phys. Res. A, 502, 669