The Nature of Nearby Counterparts to Intermediate-Redshift Luminous Compact Blue Galaxies. III. Interferometric Observations of Neutral Atomic and Molecular Gas
Abstract
We present the results of a Very Large Array (VLA) and Owens Valley Radio Observatory Millimeter Wavelength Array (OVRO–MMA) follow-up to our single-dish surveys of the neutral atomic and molecular gas in a sample of nearby Luminous Compact Blue Galaxies (LCBGs). These luminous, blue, high surface brightness, starbursting galaxies were selected using criteria similar to that used to define LCBGs at higher redshifts. The surveys were undertaken to study the nature and evolutionary possibilities of LCBGs, using dynamical masses and gas depletion time scales as constraints. Here we present nearly resolved VLA H I maps of four LCBGs, as well as results from the literature for a fifth LCBG. In addition, we present OVRO–MMA maps of CO(J=10) in two of these LCBGs. We have used the resolved H I maps to separate the H I emission from target galaxies and their companions to improve the accuracy of our gas and dynamical mass estimates. For this sub-sample of LCBGs, we find that the dynamical masses measured with the single-dish telescope and interferometer are in agreement. However, we find that we have overestimated the mass of H I in two galaxies by a significant amount, possibly as much as 75%, when compared to the single-dish estimates. These two galaxies have companions within a few arc minutes; we find that our single-dish and interferometric measurements of H I masses are in reasonable agreement for galaxies with more distant companions. Our CO(J=10) maps, despite long integration times, were faint and barely resolved making analysis difficult except to verify the central concentration of the molecular gas. The H I velocity fields indicate that all five galaxies are clearly rotating yet distorted, likely due to recent interactions. Our measurements of the gas and dynamical masses of LCBGs point towards evolution into low mass galaxies such as dwarf ellipticals, irregulars, and low mass spirals, consistent with studies of LCBGs at higher redshifts.
1 INTRODUCTION
Luminous Compact Blue Galaxies (LCBGs) are small galaxies brightened by a burst of star formation. Interactions or mergers may have triggered such galaxies to enter the LCBG phase (Östlin et al., 2001; Lacey & Silk, 1991), and, indeed, many nearby LCBGs have companions and show signatures of interactions (Garland et al., 2004). LCBGs contribute roughly 45% of the star formation rate (SFR) density and 20% of the field galaxy number density at a redshift near one; their contribution has decreased by at least a factor of ten today (Werk et al., 2004; Guzmán et al., 1997; Phillips et al., 1997; Marzke et al., 1994). While it is clear that these galaxies are the fastest evolving galaxy population from a redshift of one to today, the details of this evolution are unclear.
Since luminous, compact, starbursting galaxies appear to represent an important phase in the early history of galaxy formation, Jangren et al. (2007, submitted) developed a classification for such galaxies to permit selection over a wide redshift range (see also Werk et al. (2004) for a description.) LCBGs are spectroscopically and morphologically diverse, but are separated from local normal galaxies by their small size, high luminosity, high surface brightness, and blue color. The specific cut-offs in parameter space that define LCBGs have been selected so that they may be observed out to a redshift of one in deep Hubble Space Telescope images. Note that while they do have optical diameters of a few kpc, LCBGs have higher luminosities and metalicities than the Blue Compact Galaxies (BCGs) and Blue Compact Dwarf Galaxies (BCDGs) widely studied by, for example, Thuan & Martin (1981), Taylor et al. (1994), and Salzer et al. (2002). Previous BCG and BCDG surveys have used many different selection criteria, leading to various definitions of these galaxies and samples with a range of properties. Most surveys focused on dwarf star forming galaxies by selecting faint sources from emission line surveys. There are only a few local LCBGs in previous BCG and BCDG surveys.
Galaxies undergoing an LCBG phase will fade and redden once the star formation activity has been quenched. Their dynamical masses, however, are expected to remain largely unchanged. Based on measurements of optical sizes and line widths of intermediate redshift LCBGs, it has been suggested that some LCBGs may be the progenitors of today’s dwarf ellipticals111Sometimes called spheroidals. These are galaxies such as NGC 205, not dwarf spheroidals such as Draco and Carina. (Guzmán et al., 1996; Koo et al., 1994), irregular, or late type spirals (Noeske et al., 2006; Mallén-Ornelas et al., 1999; Phillips et al., 1997; Guzmán et al., 1996), and/or spheroidal components of today’s disk galaxies (Hammer et al., 2001; Phillips et al., 1997). It is unclear, however, if these line widths truly reflect the dynamical masses of the galaxies as such optical emission lines may originate primarily from the central regions of the galaxies.
Measures of the neutral interstellar medium (ISM) in LCBGs provide another avenue to examine the nature and evolutionary possibilities of such galaxies (Pisano et al., 2001). Neutral atomic hydrogen (H I) provides a more robust measure of the dynamical mass as it samples the gravitational potential out to a larger scale than optical emission lines. The mass of atomic and molecular hydrogen, when combined with the SFR, allows an estimate of the length of the starburst activity. With these points in mind, we began a survey of the neutral ISM in LCBGs. Current technology limited us to studying the rare, nearby LCBGs. However, we carefully selected a local sample of LCBGs to match the observed properties (luminosity, surface brightness, and color) of the common, more distant LCBGs so that our findings may apply to both LCBG populations.
In Paper I (Garland et al., 2004), we described the sample of 20 local (within 70 Mpc) LCBGs, and the results of a single-dish H I survey completed with the Green Bank Telescope (GBT). Paper II (Garland et al., 2005) described a single-dish beam-matched survey of the three lowest rotational transitions of carbon monoxide (CO) in the same sample of galaxies. We found LCBGs to be gas-rich, with centrally concentrated CO and low ratios of H2 to H I masses (typically 5%). The total gas depletion timescales are short, less than 5 Gyrs for 80% of our sample. Despite their high luminosities, these LCBGs have dynamical masses consistent with low-mass galaxies such as dwarf ellipticals, irregulars, and low luminosity spirals. These findings are consistent with optical studies of higher redshift LCBGs by, for example, Noeske et al. (2006) and Guzmán et al. (1996).
However, contamination by emission from companion galaxies is a concern, especially for the observations of H I. Forty per cent of our sample have companions within the 9.2 beam of the GBT, potentially leading to overestimates of the gas and dynamical masses. To improve these measurements, we have begun a program of interferometric, resolved observations of the H I and CO in our sample of local LCBGs, which we report here. We assume H0 = 70 km s-1 Mpc-1 throughout.
2 OBSERVATIONS AND REDUCTIONS
To begin our interferometric follow-up, we selected the brightest local LCBGs with nearby companions in our sample. We also utilized any available archival and/or published observations of our original LCBG sample.
2.1 Neutral Atomic Hydrogen
We used the National Radio Astronomy Observatory222The National Radio Astronomy Observatory is a facility of the National Science Foundation operated under cooperative agreement by Associated Universities, Inc. (NRAO) Very Large Array (VLA) for observations of 21 cm H I emission. We observed two local LCBGs, SDSSJ0834+0139 and Mrk 325. We obtained data of two additional sources, Mrk 297 and Mrk 314, from the VLA archives. Finally, we also used published VLA maps of Mrk 538 from Smith et al. (1997). Observations of the target galaxy and phase calibrator were alternated, and a flux calibrator observed at the beginning and/or end of each track.
The observing details for each source, except Mrk 538, are shown in Table 1, where we list the observing date, array configuration, flux calibrators, central velocity (heliocentric, except as noted), total channels, channel size, and integration time for each source. The integration time indicated is the total amount of time. Typically, the target was observed for 30 40 minutes at a time, the phase calibrator for four minutes at a time, and the flux calibrator for 10 30 minutes. Observations were made during a single day, except SDSSJ0834+0139, which was observed on three separate days within a two week period. The maps of Mrk 538, published by Smith et al. (1997), were made by combining observations in configurations B, C, and D. The approximate resolutions of the VLA are 4″ in B array, 13″ in C array, and 10″ in combined arrays B+C+D.
We used the NRAO Astronomical Image Processing System (AIPS) package to edit and calibrate the VLA data. Standard AIPS tasks were used to edit the raw data to remove obviously bad sections, calibrate the absolute flux level and bandpass shape, and remove continuum emission. The visibility function was then Fast Fourier Transformed (FFT) and the images CLEANed (Högbom, 1974) using the robust weighting algorithm implemented in the AIPS task IMAGR (Briggs, 1995).
We found a robustness of zero a good compromise for all sources except Mrk 314 and Mrk 325, due to their diffuse emission. Instead, for Mrk 314, we utilized a robustness of five along with a taper of 15 15 k for imaging. For Mrk 325, we used a robustness of two, with no additional taper. We did not apply tapers to any other sources. We examined these initial images to find the channels containing line emission and created a final set of images using only those channels. Finally, we created 9′ 9′ maps of integrated H I intensity (moment 0) and H I velocity (moment 1) using the AIPS task MOMNT. The maps were blanked at a 3 level, except for SDSSJ0834+0139 which was not blanked at all due to the low-level emission of its companion galaxy. Details of the H I intensity maps are shown in Table 2. We list the final beam size, the velocity range of the emission, the 1 noise in the maps, and the corresponding H I mass sensitivities. Note that diffuse, extended emission was searched for beyond the 9′ 9′ regions shown here, but none was found. The reduction of the VLA data of Mrk 538 is described in Smith et al. (1997); they use pure natural weighting (robustness = 5).
2.2 Carbon Monoxide
The former Owens Valley Radio Observatory Millimeter Wavelength Array (OVRO–MMA) was utilized to observe Mrk 297 and Mrk 325 in the lowest rotational transition of carbon monoxide, CO(J=10). The 86 116 GHz double-sideband receiver was used with the digital cross-correlator for these observations. Observing details, as described in 2.1, are shown in Table 1. The targets were typically observed for 20 minutes at a time; these observations were alternated with the phase calibrator which was typically observed for four minutes at a time. In addition, a flux calibrator was observed at the beginning and/or end of each track. At this frequency the resolution is approximately 10″ in C array and 5″ in 4BG and L array.
We reduced the CO(J=10) data of Mrk 297 and Mrk 325 in the standard manner, similar to the approach described in §2.1, but using the mma333mma is written and maintained by the California Institute of Technology millimeter interferometry group specifically for the OVRO–MMA; see Scoville et al. (1993). data reduction software. We then used AIPS, as described in 2.1, to make maps of the total emission. Details of the CO(J=10) intensity maps are shown in Table 2.
3 RESULTS
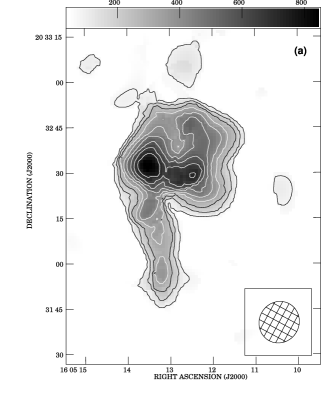
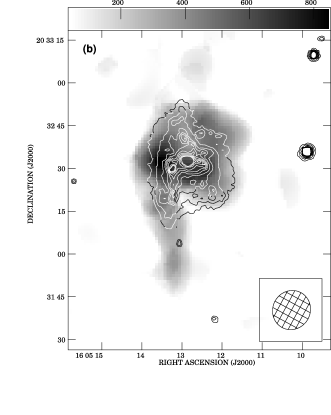
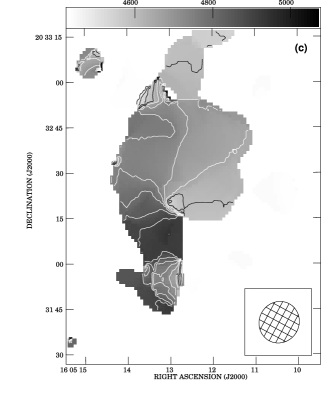
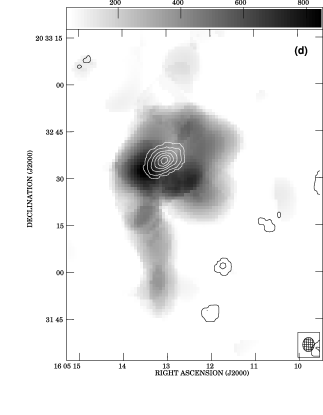
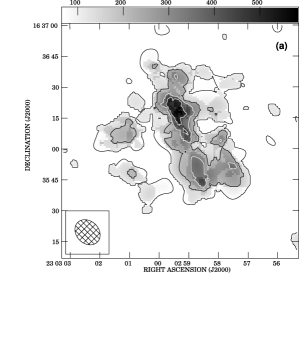
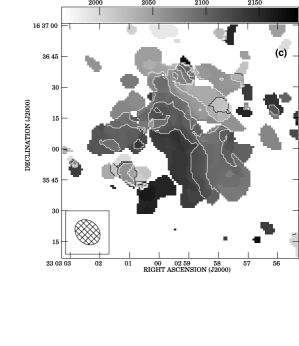
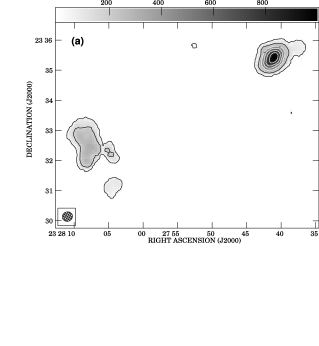
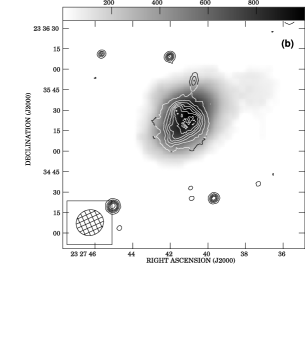
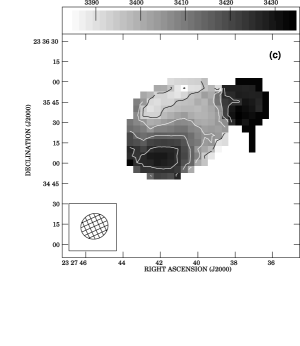
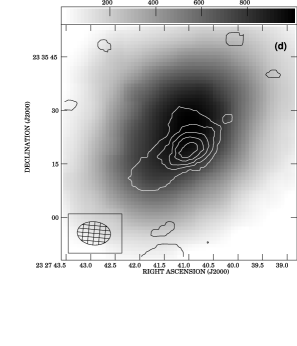
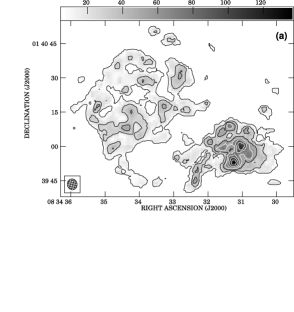
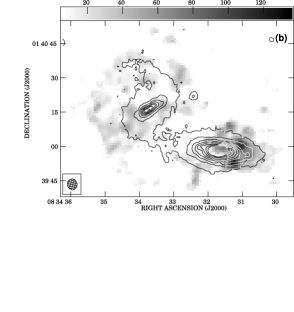
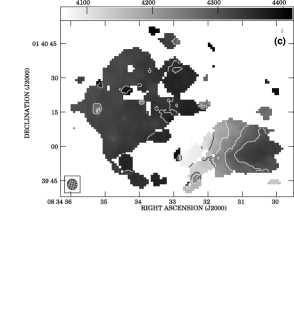
Figures 1 through 4 show the total H I and CO(J=10) intensity maps and intensity-weighted velocity fields of Mrk 297, Mrk 314, Mrk 325, and SDSSJ0834+0139. We have restricted the spatial size of the maps to show only those regions containing significant emission. We show three H I maps for each source: a contour plot of the H I emission down to 3 , an overlay of the R-band Digitized Sky Survey 2 or r-band Sloan Digital Sky Survey (when available) optical image of the galaxy on a gray scale map of the H I emission, and the H I velocity field. For Mrk 297 and Mrk 325, we have also included maps of the CO(J=10) emission down to a level of 3 , overlaid on the H I emission maps.
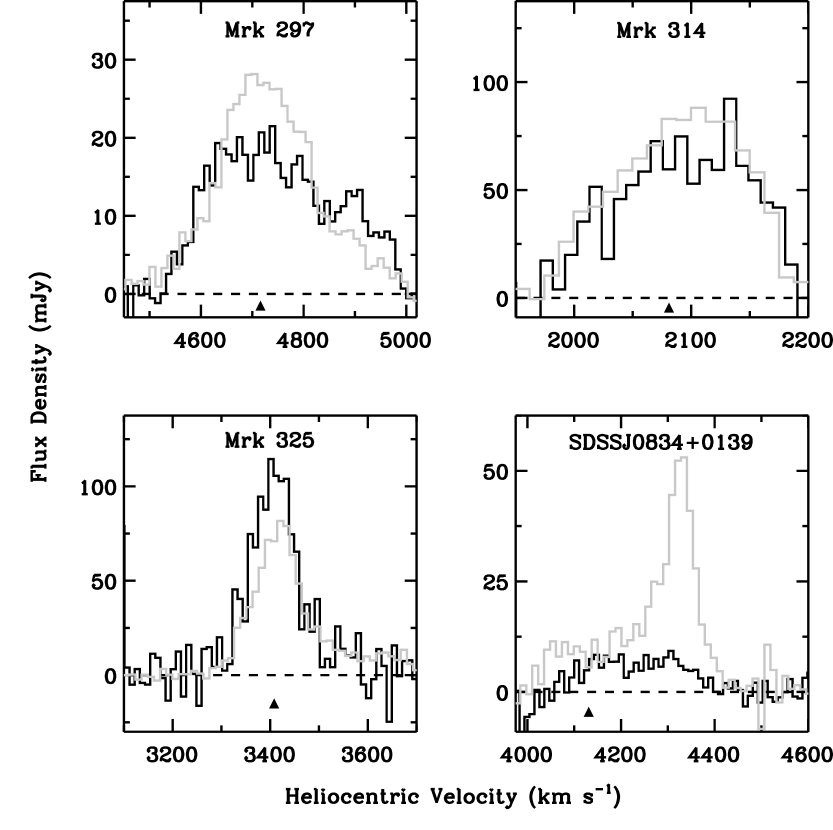
H I spectra created from the VLA data using the AIPS task ISPEC are shown in Figure 5. Using the same procedures as outlined in Paper I for our single-dish spectra, we measured the integrated flux and derived the corresponding H I mass for each galaxy from these spectra. Table 3 lists the integrated flux density, S dv, and the corresponding mass of atomic hydrogen, MHI, for each target galaxy. For comparison, we have also shown the integrated fluxes and H I masses from the GBT single-dish observations (Paper I) and the ratio of the H I masses derived using the VLA and GBT observations.
Finally, we used the H I spectra to calculate dynamical masses for Mrk 297, Mrk 314, Mrk 325 and SDSSJ0834+0139 using the same procedure detailed in Paper I. (We cannot do detailed velocity field fits due to the lack of resolution elements across each galaxy.) Table 4 lists inclination and random-motion corrected line widths at 20% (W), and the derived dynamical masses from the VLA data, assuming virialization. We also calculated the dynamical mass for Mrk 538, by assuming the spectrum is Gaussian and estimating the line width at 20% from the full width at half maximum cited by Smith et al. (1997). For comparison, we also list the values derived from the GBT data (Paper I) and the ratio of the VLA and GBT derived dynamical masses. Note that the dynamical masses are those within R25, the isophotal radius at the limiting surface brightness of 25 B-magnitudes arc sec-2.
3.1 General Results
As expected, we find that the H I masses measured using the GBT and VLA are in reasonable agreement for those sources without nearby companions (Mrk 314, Mrk 325) or for mergers (Mrk 297). Not surprisingly, the single-dish GBT data greatly overestimated the amount of H I in those LCBGs with companions at similar velocities within a few arc minutes (Mrk 538 and SDSSJ0834+0139).
While there were some differences between the line widths measured from the GBT and VLA spectra, in all five cases any differences in the derived dynamical masses are within the random errors, approximately 50% (Paper I). That is, for this small sample of LCBGs, the accuracy of the dynamical mass estimates was not improved by using interferometric data. The velocity fields of all five galaxies indicate rotation, however the velocity fields are clearly distorted as expected due to the presence of companions. As our estimates of dynamical masses assume the galaxies are virialized, we may be overestimating these masses. For example, in Mrk 297 we measure a large line width with the VLA which corresponds to a dynamical mass (within R25) of 1.7 1011 M⊙. However, the velocity field of this galaxy (Figure 1) shows a north-south extension (tidal tail) at a high velocity. This tidal tail contributed at least part of the higher velocity “shoulder” in the H I spectrum (Figure 5) used to estimate the galaxy’s dynamical mass. This resolved interferometric data suggests we are likely overestimating the rotational velocities of these galaxies.
Despite long integration times, our CO maps of Mrk 297 and Mrk 325, are faint and barely resolved, making further analysis difficult. However, we did measure the CO(J=10) radii (RCO) for these two galaxies, for comparison with local galaxies of various types. We chose to measure RCO at a level of 1 K km s-1, following Young et al. (1995). This corresponds to an H2 column density of 1.8 1020 molecules cm-2, or 1 M⊙ pc-2 (Dame et al., 2001). We find RCO to be 7″.5 4″.8 in Mrk 297, and 15″ 7″.5 in Mrk 325. That is, RCO = 0.30 R25 in Mrk 297, and 0.37 R25 in Mrk 325. Young et al. (1995) found the ratio of RCO to R25 to be 0.52 0.02 in a sample of nearby galaxies of varied Hubble types and environments. The CO in these two local LCBGs is more concentrated than the median value found by Young et al. (1995). This could be a result of these galaxies undergoing interactions with companions, which can cause gas to be funneled toward the centers of the primary galaxies (e.g. Walker et al., 1996; Hernquist & Mihos, 1995). See Paper II for a complete discussion of the molecular gas in this sample of LCBGs.
3.2 Individual Galaxies
3.2.1 Mrk 297
Figures 1 and 1 show a disturbed, asymmetric distribution of H I in Mrk 297, with a north-south elongation. A slight extension is also visible in the optical image. The H I velocity field of Mrk 297 (Figure 1) shows a velocity gradient across the main part of the galaxy, but the north-south extension is at a nearly constant higher velocity. The measured H I mass, 6.3 109 M⊙, is 90% of that measured with the GBT. We did not expect any contamination as Mrk 297 has no known companions.
Figure 1 shows the CO(J=10) emission originating from a region between the two peaks of H I emission. The CO(J=10) emission is compact and offset approximately 5″ northeast from the optical center. Our CO map is qualitatively similar to that produced by Sage et al. (1993) using the Institut de Radioastronomie Millimétrique (IRAM) single-dish telescope, although the Sage et al. (1993) map shows more extended CO emission.
Due to its clumpy, irregular shape, Mrk 297 has been classified as an archetypal Clumpy Irregular Galaxy (e.g. Heidmann, 1987), and was included in the Atlas of Peculiar Galaxies (Arp, 1966). Color maps indicate star formation is occurring in a number of areas across most of the galaxy, while the H emission is clumpy and suggestive of outflows (Cairós et al., 2001). This galaxy has been interpreted as the result of a collision between two late-type spirals (Alloin & Duflot, 1979), or a spiral and an irregular (Burenkov, 1988), which induced star formation throughout the galaxy. Taniguchi & Noguchi (1991) found, using numerical N-body simulations, that the optical morphological properties of Mrk 297 can be explained as the result of a co-planar radial penetration collision between two disk galaxies. They suggest that in this collision, the target galaxy (on left) was deformed into the north-south “wing” by the face-on intruder galaxy. Our H I map (Figure 1) shows a tidal tail that is much more extended and lopsided than the optical “wing” to which Taniguchi & Noguchi (1991) matched their simulation. Our H I observations do not appear to support the co-planar radial penetration model; more likely Mrk 297 is in a later stage of merging than suggested by this model. While our CO maps show molecular gas in the central region of Mrk 297, it is unclear if it is only related to one component of the galaxy as suggested by Sage et al. (1993) and Sofue et al. (1990).
In our sample of nearby LCBGs, Mrk 297 has the highest infrared luminosity, dynamical mass, molecular gas mass, and ratio of molecular to atomic gas mass (Papers I and II). These observations may be explained by its suggested merger state: such a close interaction could trigger quick conversion of atomic to molecular gas resulting in a bright starburst, centrally concentrated CO, and a disturbed H I component, as in Ultraluminous Infrared Galaxies (Solomon & Sage, 1988).
3.2.2 Mrk 314
Figure 2 shows diffuse, irregularly shaped H I emission in Mrk 314. The H I and optical peaks are roughly coincident. The H I emission extends well beyond the optical portion of the galaxy, although there are optical features at the ends of two H I extensions to the south. There is an east-west velocity gradient across the southern half of the galaxy, while the northern portion of the galaxy has a confused velocity field (Figure 2). Young (2002) attempted to map Mrk 314 in CO(J=1–0) using the OVRO–MMA but did not detect the galaxy. However, their upper limit on a mass of molecular hydrogen was an order of magnitude greater than the mass we detected in our single-dish CO survey (Paper II).
Mrk 314 is not cataloged as having a companion, but a map of the H I emission made with the VLA in D array by Taylor et al. (1993) shows the presence of a companion 5′ to the north. Taylor et al. (1993) measure an H I mass of 2.5108 M⊙ for this companion. As this low-mass, distant companion is outside the half-power point of the GBT beam, it is no surprise that our measurements of the H I mass using the VLA and GBT are in reasonable agreement: the VLA detected an H I mass of 2.0 109 M⊙, 80% of the GBT measured mass.
Mrk 314 is classified as an elliptical in both the NASA/IPAC Extragalactic Database (NED) and HyperLeda (Paturel et al., 2003), and may be a polar ring galaxy, as suggested by Whitmore et al. (1990). Polar ring galaxies are composed of a gas-rich ring around an early-type, often S0, galaxy, and are most likely formed by tidal accretion of gas from a companion (Bournaud & Combes, 2003). Cairós et al. (2001) obtained deep optical images of Mrk 314 and suggested that optical clumps seen to the south and southwest (lower right) may be part of the polar ring structure. This is consistent with the H I emission we detect. We also detect clumps of H I to the east (left) of the main galaxy which are not associated with any optical emission. It is possible these are also part of the polar ring structure. If this galaxy is a polar ring galaxy, this may explain this galaxy’s unusually high ratio of gas to dynamical mass (Paper I), the disturbed appearance of the H I, and the nearby companion. Mrk 314 has the smallest fraction of molecular to atomic hydrogen, and one of the longest total gas depletion time scales (Paper II) in our sample. If the H I is not contained within the central region of the LCBG, then it may also imply that Mrk 314 has already consumed its H I. Our current observations do not have the spatial resolution to confirm this, however.
3.2.3 Mrk 325
Mrk 325 has clumpy star forming regions throughout its disk (Homeier & Gallagher, 1999; Casini & Heidmann, 1976), and is commonly cited as a Clumpy Irregular Galaxy (e.g. Heidmann, 1987), while NED and HyperLeda classify it as a spiral. The disturbed appearance of the H I in Mrk 325, as well as its starburst activity, may be explained by its companion, Mrk 326, roughly 7′ to the southeast (Conselice et al., 2000; Homeier & Gallagher, 1999).
Figures 3 and 3 show centrally peaked, but disturbed, H I emission from Mrk 325. Figure 3 shows a fairly constant H I velocity, with a small gradient, across Mrk 325. Figure 3 also shows the diffuse H I emission of the companion, Mrk 326. However, note that the H I emission shown for Mrk 326 is not representative of the actual gas distribution as some emission has been subtracted off as part of the continuum subtraction for the target, Mrk 325. The actual H I distribution of Mrk 326 is symmetric and centered on the optical emission.
We measured an H I mass of 5.7 109 M⊙ for Mrk 325, and 1.4 109 M⊙ for its companion, or a total system mass of 7.1 109 M⊙. By comparison, the GBT measured mass of Mrk 325 was 6.3 109 M⊙. Note that when we correct for the primary beam response of the VLA and the GBT, the total system H I masses agree within the observational errors. Nordgren et al. (1997) acquired VLA D array observations of Mrk 325 and its companion. Their observations show more extended emission; they estimate H I masses of 3.6 109 M⊙ for Mrk 325 and 5.0 109 M⊙ for its companion.
The CO(J=10) emission in this galaxy is centrally concentrated and elongated towards the southeast. Figure 3 shows the CO(J=10) and H I peaks are roughly coincident; the CO(J=10) peak is 8″ south of the H I peak and slightly offset ( 3″ southwest) from the optical position. This is in contrast to Mrk 297, where the CO(J=10) is between the two H I peaks.
3.2.4 SDSSJ0834+0139
Figures 4 and 4 show asymmetric, diffuse H I emission from SDSSJ0834+0139, and extended, more diffuse H I emission from its companion to the northeast (upper left). Together, the galaxies are known as UGC 04480, and are classified as a spiral by NED and Hyperleda, while Nilson (1973) described them as a starburst galaxy (SDSSJ0834+0139) with a lens (the companion) attached to an arm . The H I from the companion galaxy is much more extended than the optical emission. The velocity field (Figure 4) shows an east-west velocity gradient across the galaxy, while its companion has a constant, higher velocity. It is possible that the interaction with SDSSJ0834+0139 has disturbed any ordered motion that this companion may have had in the past, or that the companion is seen face-on, as suggested by the optical image.
SDSSJ0834+0139 and its companion are less than an arc minute apart, so we expect contamination in our GBT spectrum and corresponding single-dish H I measurements. Our VLA observations yielded H I masses of 1.4 109 M⊙ for SDSSJ0834+0139, and 2.2 109 M⊙ for its companion. We show spectra of the target and its companion in Figure 6. The solid line shows the broad, low-level emission from SDSSJ0834+0139, the dashed line the sharply peaked emission from the companion galaxy, and the dotted line the GBT spectrum, which is the combination of both sources. Our GBT data of this system yielded an H I mass of 5.9 109 M⊙, 1.6 times the VLA measurements for the target and companion combined. However, note that the low-level emission from SDSSJ0834+0139 extends nearly to the edge of the VLA bandpass, 3980 km s-1, so that we lack a clean continuum channel. This may result in subtracting some H I emission when we do continuum subtraction.
3.2.5 Mrk 538
Smith et al. (1997) show maps of H I emission and the velocity field of Mrk 538 and its companion. The H I emission is extended, forming a bridge between the two galaxies. While the inner portion of Mrk 538 shows a normal velocity gradient for a rotating disk, deviations from circular motion are present in the outer portions of the galaxy disk. The companion galaxy also exhibits signs of rotation (Smith et al., 1997). The total H I mass for the Mrk 538 system, within a region approximately 4′ 8′, is MHI = 7.0 109 M⊙. This includes Mrk 538, its companion, the bridge connecting the two, and other clouds and loops of H I in the area (Smith et al., 1997). This total H I mass compares well with the mass derived using the GBT, 7.6 109 M⊙. Due to the small separation between Mrk 538 and its companion, it is not surprising that the mass Smith et al. (1997) report for Mrk 538 alone, 1.7 109 M⊙, is only 22% of that we reported from the GBT observations.
This pair of galaxies, known as Arp 284, is one of the prototypical collisional starburst systems. Numerical models and the observed stellar and gas morphologies suggest a recent collision, between 100 to 200 Myr ago (Struck & Smith, 2003). Multi-wavelength data, summarized in Smith et al. (1997), reveal young, intermediate age, and old stellar populations in Mrk 538. Lançon et al. (2001) found, using population synthesis models, that the starburst is responsible for only a small portion of an extended star formation episode, triggered approximately 108 years ago.
4 DISCUSSION AND CONCLUSIONS
It is becoming clear, from studies over a range of wavelengths and redshift epochs, that LCBGs are small galaxies undergoing vigorous starbursts. The growing consensus on the nature of LCBGs narrows the probable evolutionary pathways these galaxies will follow once they cease their starburst activity. As LCBGs are heterogeneous, it is likely that multiple evolutionary scenarios apply, including fading and reddening into dwarf ellipticals (Guzmán et al., 1996; Koo et al., 1994), evolving into irregulars or late type spirals (Noeske et al., 2006; Mallén-Ornelas et al., 1999; Phillips et al., 1997; Guzmán et al., 1996), or spheroidal components of today’s disk galaxies (Hammer et al., 2001; Phillips et al., 1997).
In Papers I and II, we found that the dynamical masses and sizes of these galaxies are consistent with low-mass galaxies such as irregulars, low luminosity spirals, and dwarf ellipticals. While our interferometric follow-up of a handful of LCBGs indicates that we may be overestimating the dynamical masses of these galaxies, this only strengthens our original conclusions. As the dynamical masses we measure for LCBGs are lower than typical grand-design spirals, we do not find evidence that LCBGs are spheroidal components of large disk galaxies.
Our entire sample of 20 LCBGs have H I masses ranging from 0.47 108 to 7.9 109 M⊙ (Paper I), within the range of local irregulars and low luminosity spiral galaxies (Pilyugin & Ferrini, 2000; Roberts & Haynes, 1994). Local LCBGs also have small (typically less than 5%) ratios of molecular to atomic hydrogen, consistent with low luminosity spirals (Young & Knezek, 1989). Our interferometric follow-up has also indicated that we are overestimating the neutral gas mass, and therefore the total gas depletion time scales, of at least some LCBGs. Again, this strengthens our initial findings: LCBGs will consume their star formation fuel relatively quickly, typically in less than five Gyrs. If they consume/expel much of their interstellar medium and halt their star formation, their properties will be consistent with dwarf ellipticals which have low masses of atomic gas ( 106 M⊙) (e.g. Welch et al., 1998; Young & Lo, 1997). (However, note that dwarf ellipticals may have higher H I masses than currently assumed; cluster dwarf ellipticals have been observed with H I masses up to 109 M⊙ (Morganti et al., 2006; Conselice et al., 2003).)
It is unclear if LCBGs will indeed consume and/or expel most of their gas, or if the burst of star formation will halt at some point, leaving a large amount of neutral gas in the galaxy. Modeling by Mac Low & Ferrara (1999) and De Young & Heckman (1994) suggest that starbursts could not expel more than a few percent of the total interstellar medium in galaxies of this size. Similar arguments led Werk et al. (2004), for example, to conclude that LCBGs are not capable of blowing out enough gas to become “gas-poor” galaxies, such as dwarf ellipticals, given their typical dynamical masses. Instead, they suggest LCBGs may fade somewhat but still exhibit modest levels of star formation. If LCBGs retain much of their interstellar medium and maintain a lower level of star formation, their properties will be consistent with irregulars and low luminosity spirals.
To illustrate these conclusions, in Figure 7 we plot the H I mass versus the dynamical mass (within R25) of our sample of local LCBGs, as well as a selection of other well known galaxies. For the five galaxies with VLA observations reported in this paper, we plot both the VLA and GBT derived masses. For the remainder of the galaxies, we plot simply the GBT derived masses from Paper I. Note that the two galaxies in our sample with the smallest H I masses have uncertain dynamical masses as they are estimated from marginal detections (Paper I). The two dashed lines in Figure 7 indicate ratios of H I to dynamical mass of 10 and 1%. For comparison with local LCBGs, we have included well known galaxies of various morphological types:
- •
- •
-
•
NGC 4449 is a global starburst known for having an extended H I distribution, with streamers and filaments extending from the optical disk (Hunter et al., 1998). It is classified as a barred irregular (HyperLeda) or Magellanic barred irregular (NED). In Figure 7, we used the H I mass and line width published by Bajaja et al. (1994).
-
•
NGC 4640 (VCC 1949) is a member of the Virgo Cluster. It is classified as an S0 in HyperLeda and a dwarf S0 in NED. It is also commonly classified as a dwarf elliptical, as, for example, in the Virgo Cluster Catalog (Binggeli et al., 1987). We used the H I information culled from the literature by Conselice et al. (2003) when including NGC 4640 in Figure 7.
-
•
The Large Magellanic Cloud (LMC), a satellite of the Milky Way with weak spiral features (de Vaucouleurs, 1955), is a prototypical Magellanic barred spiral and is classified as such in HyperLeda and NED. When including the LMC in Figure 7, we used the H I mass and line width reported by Staveley-Smith et al. (2003).
- •
Dynamical masses for these comparison galaxies were calculated within R25 (from HyperLeda, except from Bothun & Thompson (1988) for the LMC) using H I line widths corrected for inclination and random motions in the same manner as described for our LCBG sample in Paper I. The only exception is M 31, for which we used a rotational velocity derived from an H I rotation curve. If needed, values were scaled to reflect our use of H0 = 70 km s-1 Mpc-1. (More detailed comparisons of the gas and dynamical mass properties with the range of galaxies along the Hubble sequence are explored in Paper I.)
We have included an example of a non-cluster dwarf elliptical (NGC 205) and a cluster dwarf elliptical (NGC 4640) to illustrate the range in dynamical and H I masses possible for this type of galaxy. In cluster dwarf ellipticals, the galaxy characteristics are influenced by both internal and external processes, as discussed in, for example, Bouchard et al. (2005). The range of dynamical masses in dwarf ellipticals is still unclear: much depends on environment, but also on differences in data analysis, as pointed out by De Rijcke et al. (2006). For example, we estimate a dynamical mass within R25 of 1.1108 M⊙ for NGC 205 by using an H I line width, corrected for turbulence and inclination. When De Rijcke et al. (2006) used models fit to infrared surface brightness distributions and kinematics, a dynamical mass of 1.0109 M⊙ within half R25 was estimated. Note that Young & Lo (1997) found that the gas and stars in NGC 205 are kinematically distinct.
For those five galaxies with both GBT and VLA observations, Figure 7 illustrates how our interferometric observations have decreased the H I mass estimates, in some cases by a large amount, but have not changed the dynamical mass estimates a great deal. Looking at Figure 7 in terms of the evolutionary possibilities for LCBGs, it is possible that LCBGs will evolve downward in this figure as H I is transformed into stars (or ejected). However, it is unlikely, in the framework of passive evolution, that LCBGs will move to the left or right in this figure, since the dynamical mass is assumed to stay relatively constant. From this viewpoint, the likely end-products of LCBGs are the Magellanic spirals and irregulars. Dwarf ellipticals with high dynamical masses are also a possibility.
Note that while both NGC 55 and NGC 4449 occupy the same region of H I and dynamical mass space in Figure 7 as many LCBGs, both are approximately a magnitude too faint (HyperLeda, NED) to be considered luminous BCGs. All aspects of LCBGs need to be examined when attempting to trace their evolutionary pathways. The optical properties, such as stellar masses and color, are also an important consideration and will be discussed by Hoyos et al. (2007, submitted.)
The evolutionary scenarios discussed in this paper are consistent with the recent results of Noeske et al. (2006) who concluded that 90% of high redshift (0.2 z 1.3) LCBGs are small galaxies that will evolve into dwarf ellipticals, irregulars, and small disk galaxies. However, we note that all these evolutionary scenarios exist in the framework of passive evolution; interactions and mergers after the initially triggered burst of star formation may play a role in the evolution of at least some LCBGs. Previous studies have shown that major, and potentially even minor, interactions can funnel gas into the centers of galaxies and trigger nuclear activity (e.g. Walker et al., 1996; Hernquist & Mihos, 1995; Dahari, 1984). Our observations of centrally concentrated CO in our LCBGs are consistent with this scenario. The asymmetries in the H I profiles and resolved H I maps of our LCBGs may be due to ongoing interactions (e.g. Zaritsky & Rix, 1997; Odewahn, 1994), but may also be a normal feature of galaxies arising as long-lived phenomenon (e.g. Wilcots & Prescott, 2004; Levine & Sparke, 1998; Richter & Sancisi, 1994). While interactions and mergers can certainly provide additional fuel for star formation and trigger activity in LCBGs, we cannot determine the specific effect on our small sample of LCBGs. However, we can ask, if interactions and mergers provide additional star formation fuel causing LCBGs to keep their “LCBG” color, luminosity, and surface brightness characteristics at a later stage in their lives, where are these galaxies today? In our local universe, LCBGs are quite rare.
We are pursuing interferometric observations of the remaining 15 local LCBGs in our sample using both the VLA and the Giant Metrewave Radio Telescope (GMRT, India). The five LCBGs studied in detail in this paper are among the most luminous of our sample, and all have companions or are mergers. Their H I distributions appear to be quite disturbed, indicating recent or ongoing interactions. They may not be representative of LCBGs in general, as roughly one half of our local sample of LCBGs do not show evidence of optical companions. The OVRO–MMA maps we presented are of two of our brightest galaxies, and yielded barely resolved, faint CO emission despite long integration times. New millimeter telescopes, such as the GBT, Large Millimeter Telescope (LMT), Combined Array for Research in Millimeter-wave Astronomy (CARMA) and, eventually, the Atacama Large Millimeter Array (ALMA), will permit more detailed studies of the CO in a larger sample of LCBGs. Finally, we are also working to compare the detailed H I kinematics with 3D optical spectroscopy for our sample of LCBGs (Pérez Gallego et al., 2005, 2006). This combined multi-wavelength study of local LCBGs will provide a key reference to better understand the current properties and evolutionary pathways of their high-redshift analogs.
References
- Alloin & Duflot (1979) Alloin, D., & Duflot, R. 1979, A&A, 78, L5
- Arp (1966) Arp, H. 1966, Atlas of Peculiar Galaxies Publisher: California Institute of Technology, Pasaadena, CA, 1966
- Bajaja et al. (1994) Bajaja, E., Huchtmeier, W. K., & Klein, U. 1994, A&A, 285, 385
- Binggeli et al. (1987) Binggeli, B., Tammann, G. A., & Sandage, A. 1987, AJ, 94, 251
- Bosma (1981) Bosma, A. 1981, AJ, 86, 1825
- Bothun & Thompson (1988) Bothun, G. D., & Thompson, I. B. 1988, AJ, 96, 877
- Bouchard et al. (2005) Bouchard, A., Jerjen, H., Da Costa, G. S., & Ott, J. 2005, AJ, 130, 2058
- Bournaud & Combes (2003) Bournaud, F., & Combes, F. 2003, A&A, 401, 817
- Briggs (1995) Briggs, D.S. 1995 Thesis, “High Fidelity Deconvolution of Moderately Resolved Sources,” New Mexico Institute of Mining and Technology, Socorro, NM
- Burenkov (1988) Burenkov, A. N. 1988, Astrofizika, 28, 47
- Cairós et al. (2001) Cairós, L. M., Caon, N., Vílchez, J. M., González-Pérez, J. N., & Muñoz-Tuñón, C. 2001, ApJS, 136, 393
- Cairós et al. (2001) Cairós, L. M., Vílchez, J. M., González Pérez, J. N., Iglesias-Páramo, J., & Caon, N. 2001, ApJS, 133, 321
- Carignan et al. (2006) Carignan, C., Chemin, L., Huchtmeier, W. K., & Lockman, F. J. 2006, ApJ, 641, L109
- Casini & Heidmann (1976) Casini, C., & Heidmann, J. 1976, A&A, 47, 371
- Conselice et al. (2000) Conselice, C. J., Gallagher, J. S., Calzetti, D., Homeier, N., & Kinney, A. 2000, AJ, 119, 79
- Conselice et al. (2003) Conselice, C. J., O’Neil, K., Gallagher, J. S., & Wyse, R. F. G. 2003, ApJ, 591, 167
- Dahari (1984) Dahari, O. 1984, AJ, 89, 966
- Dame et al. (2001) Dame, T. M., Hartmann, D., & Thaddeus, P. 2001, ApJ, 547, 792
- De Young & Heckman (1994) De Young, D. S., & Heckman, T. M. 1994, ApJ, 431, 598
- De Rijcke et al. (2006) De Rijcke, S., Prugniel, P., Simien, F., & Dejonghe, H. 2006, MNRAS, 369, 1321
- de Vaucouleurs (1955) de Vaucouleurs, G. 1955, AJ, 60, 126
- Garland et al. (2004) Garland, C. A., Pisano, D. J., Williams, J. P., Guzmán, R., & Castander, F. J. 2004, ApJ, 615, 689 (Paper I)
- Garland et al. (2005) Garland, C. A., Williams, J. P., Pisano, D. J., Guzmán, R., Castander, F. J., & Brinkmann, J. 2005, ApJ, 624, 714 (Paper II)
- Guzmán et al. (1996) Guzmán, R., Koo, D. C., Faber, S. M., Illingworth, G. D., Takamiya, M., Kron, R. G., & Bershady, M. A. 1996, ApJ, 460, L5
- Guzmán et al. (1997) Guzmán, R., Gallego, J., Koo, D. C., Phillips, A. C., Lowenthal, J. D., Faber, S. M., Illingworth, G. D., & Vogt, N. P. 1997, ApJ, 489, 559
- Hammer et al. (2001) Hammer, F., Gruel, N., Thuan, T. X., Flores, H., & Infante, L. 2001, ApJ, 550, 570
- Heidmann (1987) Heidmann, J. 1987, IAU Symp. 115: Star Forming Regions, 115, 599
- Hernquist & Mihos (1995) Hernquist, L., & Mihos, J. C. 1995, ApJ, 448, 41
- Högbom (1974) Högbom, J. A. 1974, A&AS, 15, 417
- Homeier & Gallagher (1999) Homeier, N. L., & Gallagher, J. S. 1999, ApJ, 522, 199
- Hunter (1997) Hunter, D. 1997, PASP, 109, 937
- Hunter et al. (1998) Hunter, D. A., Wilcots, E. M., van Woerden, H., Gallagher, J. S., & Kohle, S. 1998, ApJ, 495, L47
- Koo et al. (1994) Koo, D. C., Bershady, M. A., Wirth, G. D., Stanford, S. A., & Majewski, S. R. 1994, ApJ, 427, L9
- Lacey & Silk (1991) Lacey, C., & Silk, J. 1991, ApJ, 381, 14
- Lançon et al. (2001) Lançon, A., Goldader, J. D., Leitherer, C., & Delgado, R. M. G. 2001, ApJ, 552, 150
- Levine & Sparke (1998) Levine, S. E., & Sparke, L. S. 1998, ApJ, 496, L13
- Mac Low & Ferrara (1999) Mac Low, M.-M., & Ferrara, A. 1999, ApJ, 513, 142
- Mallén-Ornelas et al. (1999) Mallén-Ornelas, G., Lilly, S. J., Crampton, D., & Schade, D. 1999, ApJ, 518, L83
- Marzke et al. (1994) Marzke, R. O., Geller, M. J., Huchra, J. P., & Corwin, H. G. 1994, AJ, 108, 437
- Morganti et al. (2006) Morganti, R., et al. 2006, MNRAS, 773
- Nilson (1973) Nilson, P. 1973, Nova Acta Regiae Soc. Sci. Upsaliensis Ser. V, 0
- Noeske et al. (2006) Noeske, K. G., Koo, D. C., Phillips, A. C., Willmer, C. N. A., Melbourne, J., Gil de Paz, A., & Papaderos, P. 2006, ApJ, 640, L143
- Nordgren et al. (1997) Nordgren, T. E., Chengalur, J. N., Salpeter, E. E., & Terzian, Y. 1997, AJ, 114, 77
- Odewahn (1994) Odewahn, S. C. 1994, AJ, 107, 1320
- Östlin et al. (2001) Östlin, G., Amram, P., Bergvall, N., Masegosa, J., Boulesteix, J., & Márquez, I. 2001, A&A, 374, 800
- Paturel et al. (2003) Paturel, G., Petit, C., Prugniel, P., Theureau, G., Rousseau, J., Brouty, M., Dubois, P., & Cambrésy, L. 2003, A&A, 412, 45
- Pérez Gallego et al. (2005) Pérez Gallego, J., Guzmán, R., Castander, F. J., Garland, C. A., & Pisano, D. J. 2005, ASSL Vol. 329: Starbursts: From 30 Doradus to Lyman Break Galaxies, 59P
- Pérez Gallego et al. (2006) Pérez-Gallego, J., Gruel, N., Guzmán, R., 2006, RevMexAA, ed. Guzmán, R., Packham, C. & Rodríguez-Espinosa, J. M.
- Phillips et al. (1997) Phillips, A. C., Guzmán, R., Gallego, J., Koo, D. C., Lowenthal, J. D., Vogt, N. P., Faber, S. M., & Illingworth, G. D. 1997, ApJ, 489, 543
- Pilyugin & Ferrini (2000) Pilyugin, L. S. & Ferrini, F. 2000, A&A, 354, 874
- Pisano et al. (2001) Pisano, D. J., Kobulnicky, H. A., Guzmán, R., Gallego, J., & Bershady, M. A. 2001, AJ, 122, 1194
- Puche et al. (1991) Puche, D., Carignan, C., & Wainscoat, R. J. 1991, AJ, 101, 447
- Richter & Sancisi (1994) Richter, O.-G., & Sancisi, R. 1994, A&A, 290, L9
- Roberts & Haynes (1994) Roberts, M. S. & Haynes, M. P. 1994, ARA&A, 32, 115
- Sage et al. (1993) Sage, L. J., Loose, H. H., & Salzer, J. J. 1993, A&A, 273, 6
- Salzer et al. (2002) Salzer, J. J., Rosenberg, J. L., Weisstein, E. W., Mazzarella, J. M., & Bothun, G. D. 2002, AJ, 124, 191
- Sandage & Bedke (1994) Sandage, A., & Bedke, J. 1994, Washington, DC: Carnegie Institution of Washington with The Flintridge Foundation, —c1994,
- Scoville et al. (1993) Scoville, N. Z., Carlstrom, J. E., Chandler, C. J., Phillips, J. A., Scott, S. L., Tilanus, R. P. J., & Wang, Z. 1993, PASP, 105, 1482
- Smith et al. (1997) Smith, B. J., Struck, C., & Pogge, R. W. 1997, ApJ, 483, 754
- Sofue et al. (1990) Sofue, Y., Taniguchi, Y., Handa, T., Wakamatsu, K.-I., Nakai, N., Fujisawa, K., & Yasuda, N. 1990, PASJ, 42, L45
- Solomon & Sage (1988) Solomon, P. M., & Sage, L. J. 1988, ApJ, 334, 613
- Staveley-Smith et al. (2003) Staveley-Smith, L., Kim, S., Calabretta, M. R., Haynes, R. F., & Kesteven, M. J. 2003, MNRAS, 339, 87
- Struck & Smith (2003) Struck, C., & Smith, B. J. 2003, ApJ, 589, 157
- Taniguchi & Noguchi (1991) Taniguchi, Y., & Noguchi, M. 1991, AJ, 101, 1601
- Taylor et al. (1994) Taylor, C. L., Brinks, E., Pogge, R. W., & Skillman, E. D. 1994, AJ, 107, 971
- Taylor et al. (1993) Taylor, C., Brinks, E., & Skillman, E. D. 1993, AJ, 105, 128
- Thuan & Martin (1981) Thuan, T. X. & Martin, G. E. 1981, ApJ, 247, 823
- Walker et al. (1996) Walker, I. R., Mihos, J. C., & Hernquist, L. 1996, ApJ, 460, 121
- Welch et al. (1998) Welch, G. A., Sage, L. J., & Mitchell, G. F. 1998, ApJ, 499, 209
- Werk et al. (2004) Werk, J. K., Jangren, A, & Salzer, J. J. 2003, ApJ, 617, 1004
- Whitmore et al. (1990) Whitmore, B. C., Lucas, R. A., McElroy, D. B., Steiman-Cameron, T. Y., Sackett, P. D., & Olling, R. P. 1990, AJ, 100, 1489
- Wilcots & Prescott (2004) Wilcots, E. M., & Prescott, M. K. M. 2004, AJ, 127, 1900
- Young (2002) Young, L. M. 2002, AJ, 124, 788
- Young & Knezek (1989) Young, J. S., & Knezek, P. M. 1989, ApJ, 347, L55
- Young & Lo (1997) Young, L. M., & Lo, K. Y. 1997, ApJ, 476, 127
- Young et al. (1995) Young, J. S., Xie, S., Tacconi, L., Knezek, P., Viscuso, P., Tacconi-Garman, L., Scoville, N., Schneider, S., Schloerb, F. P., Lord, S., Lesser, A., Kenney, J., Huang, Y., Devereux, N., Claussen, M., Case, J., Carpenter, J., Berry, M., & Allen, L. 1995, ApJS, 98, 219
- Zaritsky et al. (1994) Zaritsky, D., Kennicutt, R. C., Jr., & Huchra, J. P. 1994, ApJ, 420, 87
- Zaritsky & Rix (1997) Zaritsky, D., & Rix, H.-W. 1997, ApJ, 477, 118
| Source | Date | Configuration | Flux | Velocity | Total | Channel Size | Time |
|---|---|---|---|---|---|---|---|
| Calibrators | (km s-1) | Channels | (km s-1) | (hours) | |||
| NRAO–VLA | |||||||
| Mrk 297 | 1992 May | C | 3C286 | 4750 | 63 | 10 | 6 |
| Mrk 314 | 1985 April | B | 3C48 | 2081 | 31 | 10 | 5 |
| Mrk 325 | 2002 November | C | 3C48 | 3412 | 63 | 10 | 1 |
| SDSSJ0834+0139 | 2003 October | B | 3C286 | 4296 | 63 | 10 | 12 |
| OVRO–MMA | |||||||
| Mrk 297 | 1993 AprilJune | 4BG | 3C273, 3C454.3, Neptune, Uranus | 471811 Local standard of rest. | 124 | 5 | 17 |
| Mrk 325 | 2003 March | L | 3C454.3 | 3375 | 120 | 5 | 8.5 |
| 2003 May | C | 3C84, 3C454.3 | 3375 | 120 | 5 | 33.3 |
| Source | Beam Size | Emission Velocity Range | rms | H I Mass Sensitivity |
|---|---|---|---|---|
| (arc sec) | (km s-1) | (Jy beam-1 m s-1) | (M⊙ beam-1) | |
| H I | ||||
| Mrk 297 | 14 13 | 4510 4980 | 15 | 1.6 107 |
| Mrk 314 | 14 11 | 1981 2191 | 23 | 5.0 106 |
| Mrk 325 | 20 19 | 3292 3592 | 1.0 | 5.7 105 |
| SDSSJ0834+0139 | 4.8 4.3 | 4063 4413 | 1.9 | 1.6 106 |
| CO(J=10) | ||||
| Mrk 297 | 4.6 3.7 | 4693 4753 | 57 | |
| Mrk 325 | 9.4 6.6 | 3382 3432 | 36 |
| Source | VLA S dv | GBT S dv | VLA MHI | GBT MHI | |
|---|---|---|---|---|---|
| (Jy km s-1) | (Jy km s-1) | (109 M⊙) | (109 M⊙) | ||
| Mrk 297 | 5.8 0.2 | 6.5 0.08 | 6.3 0.2 | 7.0 0.1 | 0.90 0.04 |
| Mrk 314 | 11 0.9 | 12 0.1 | 2.0 0.2 | 2.5 0.03 | 0.80 0.08 |
| Mrk 325 | 10 0.7 | 11 0.2 | 5.7 0.4 | 6.3 0.1 | 0.90 0.07 |
| Mrk 538 | 20 0.2 | 1.711From Smith et al. (1997) | 7.6 0.1 | 0.22 | |
| SDSSJ0834+0139 | 1.6 0.2 | 6.9 0.2 | 1.4 0.2 | 5.9 0.2 | 0.24 0.03 |
| Source | VLA W | VLA MDYN11 Within R25 | GBT W | GBT MDYN11 Within R25 | |
|---|---|---|---|---|---|
| (km s-1) | (1010 M⊙) | (km s-1) | (1010 M⊙) | ||
| Mrk297 | 595 | 17 | 486 | 11 | 1.5 |
| Mrk 314 | 158 | 0.54 | 170 | 0.63 | 0.86 |
| Mrk 325 | 207 | 2.4 | 242 | 3.3 | 0.73 |
| Mrk 538 | 25122 Estimated from FWHM published in Smith et al. (1997). | 4.1 | 264 | 4.5 | 0.91 |
| SDSSJ0834+0139 | 250 | 2.4 | 293 | 3.3 | 0.73 |