The Local Velocity Anomaly
1 Historical Notes
1.1 What is the Local Velocity Anomaly?
The Local Velocity Anomaly was first discussed at the Vatican Conference in 1988 fab88 ; tul88 and was given attention for a few years gir90 ; han90 ; tul92 . Subsequently, there has been little notice of the phenomenon. The observation is the following: our Galaxy lies in a structure that has very low internal motions in a cosmic expansion reference frame but there is a discontinuity of velocities as we step to the nearest adjacent structures. A modern view of peculiar velocities is provided by Figure 1 tul07 . In earlier discussions, we referred to our home structure as the Coma–Sculptor Cloud. Here we refer to the co-moving part of it as the ‘Local Sheet’. The nearest adjacent structure is the Leo Spur, found to have large negative peculiar velocities.
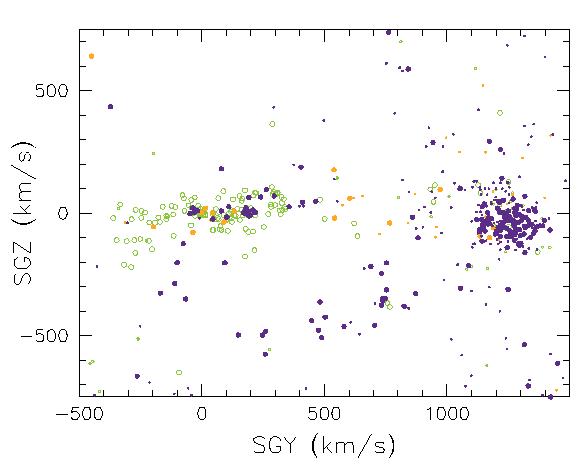
There is a relationship to the historic Hubble Constant controversy. There was a point of view bot86 ; kra86 that what was seen as the Local Velocity Anomaly was just a manifestation of Malmquist bias. The normal consequence of Malmquist bias is underestimation of distances that gets worse as one goes farther away, resulting in increasing estimates of the Hubble parameter with distance san99 . An upturn in the Hubble parameter is seen at km s-1. Is it due to Malmquist bias (and low H0) or is it something that, at least in part, requires a physical explanation? Malmquist bias can be mitigated tul00 . In any event, modern data shows unambiguously that the Local Velocity Anomaly is a real phenomenon.
1.2 The Great Attractor Problem
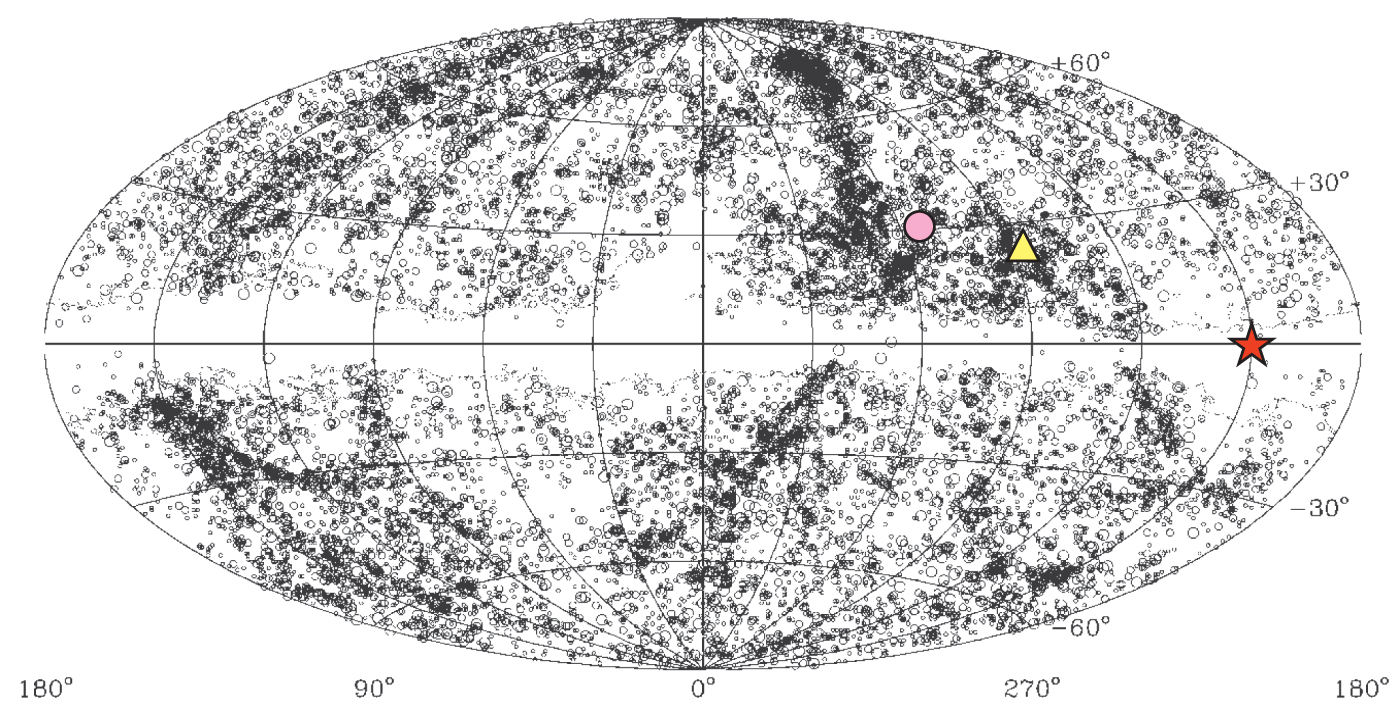
Since that same Vatican Conference there has been an appreciation that what we see in the distribution of galaxies does not adequately explain the motion inferred by the Cosmic Microwave Background (CMB) dipole lyn88 . Our motion with respect to the CMB reference frame is close to the plane of our Galaxy (even after subtraction of our Galactic orbital motion). The dipole in the distribution of galaxies, as determined back in 1988 from the distribution of galaxies seen in Figure 2 kra00 was near but not precisely aligned with the CMB dipole direction. It was reasonable to suspect that there were many galaxies hidden in the zone of avoidance and a considerable industry developed to look for them koc07 ; kra00 . Objects were found but not in the quantity required to explain the offset of the CMB dipole direction away from the supergalactic equator (defined by the ridgeline of the pronounce vertical band to the right of center in the plot) toward the supergalactic south (to the right of that ridgeline). Already in 1988 lyn88 , the prescient but unsubstantiated suggestion was made that this offset might be the consequence of a push from the Local Void.
1.3 Dynamical Models
There have been attempts to reconstruct the development of local structure phe01 ; sha95 . Numerical Action models involve the reconstruction of orbits to match the observed distribution of galaxies. Masses are assigned to galaxies in proportion to light. Resultant models are evaluated through a comparison of predicted and observed peculiar velocity fields. The greatest deficiency of the models has been an inability to explain the amplitude of the motions seen in the Local Velocity Anomaly. Model velocities were only large enough with unreasonably large masses assigned to nearby galaxies. More on the resolution of this problem in the ensuing discussion.
1.4 The Local Void
The Local Void was identified in the Nearby Galaxies Atlas tul87 . It begins at the edge of the Local Group. It is poorly understood because much of it lies behind the plane of the Milky Way. It is hard to see nothing, especially when it is obscured. The HI Parkes All Sky Survey mey04 penetrates the zone of avoidance and clearly shows that the Local Void is to be taken seriously. The Local Void occupies much of the foreground in the underdense region in the left half of Fig. 2.
2 What’s New?
We now have a database of almost 1800 distances to galaxies within 3000 km/s. Over 600 of these have accuracies better than 10%, derived from either the Cepheid Period–Luminosity fre01 , Tip of the Red Giant Branch (TRGB) sak96 , or Surface Brightness Fluctuation ton01 methods. The rest are based on luminosity–linewidth measures kar02 ; tul77 ; tul00 . With distances, , it is possible to separate the radial component of peculiar velocities, , from observed velocities, : . In this analysis we take H km/s/Mpc.
A map of peculiar velocities is shown in the aitoff projection in supergalactic coordinates of Figure 3. It is seen that motions in the lower right quadrant are overwhelmingly toward us while motions in the upper left quadrant are predominantly away from us. This pattern can be explained if we have a velocity toward the lower right quadrant. The inferred apex of our motion is identified on the figure by the cross labeled ‘LSC’. The relationship with the CMB dipole should be noted.
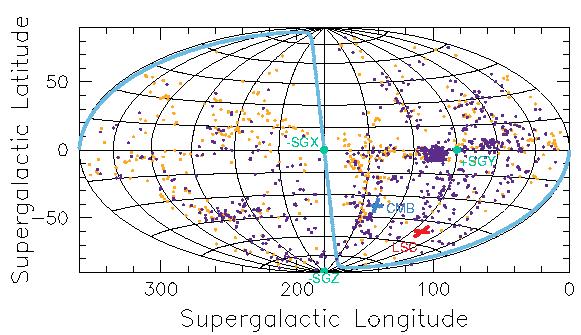
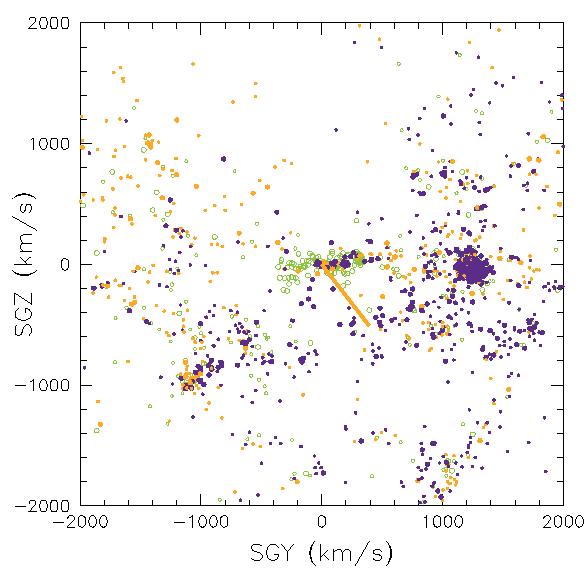
Figure 4 uses the same data but steps from our location at the center of the scene to a vantage point looking in from a large distance. From the viewing position that is chosen, once again galaxies in the lower right tend to have negative peculiar velocities and galaxies in the upper left tend to have positive peculiar velocities. The pattern is explained if we are moving with respect to the ensemble of observed objects toward the lower right, in the direction of the bar emanating from the origin.
We zoom in on this scene with Figure 5. It is seen that the pattern of peculiar velocities (negative to lower right, positive to upper left) only begins beyond Mpc, outside our immediate structure. Within 7 Mpc, almost 200 galaxies now have well observed TRGB distances and are found to be expanding with roughly the Hubble law with very low peculiar velocities kar03 . This entire local region is moving together in the direction toward the lower right. We are calling our co-moving flattened structure the Local Sheet.
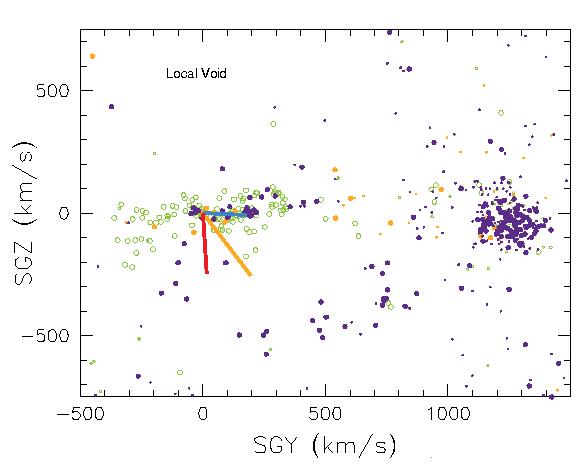
The Virgo Cluster is the prominent knot of objects with net negative velocities at the right edge of Fig. 5. It has long been appreciated that this structure influences our motion aar82 and dynamical models provide an estimate of the amplitude moh05 . The velocity of the Local Sheet with respect to galaxies beyond 7 Mpc and within 3000 km/s is 323 km/s. A component is directed toward the Virgo Cluster with an amplitude of 185 km/s, which is in reasonable accord with expectations given in the cluster at 17 Mpc. If this component is subtracted from the observed vector, the result is a vector of amplitude 259 km/s in a direction close to the supergalactic south pole. This direction is orthogonal to the disk of the Local Sheet. It is not toward anything substantial, but it is directly away from the Local Void.
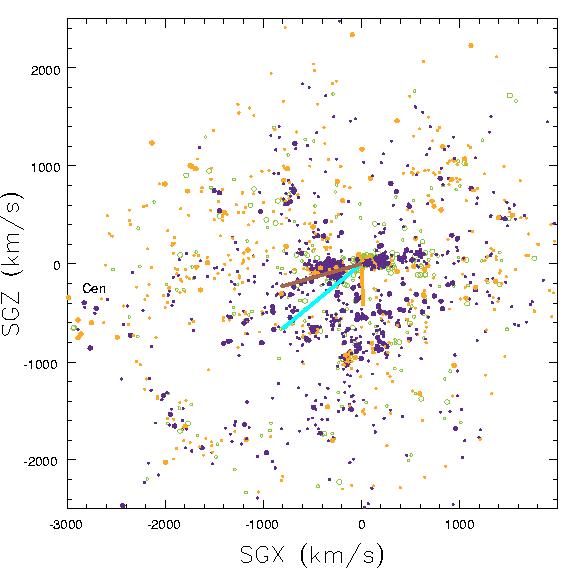
We will return to a consideration of the motion away from the Local Void in the next section, but let us first look at the importance of this component in the inventory that makes up the motion reflected in the CMB dipole. With Fig. 6 we have rotated in the supergalactic equatorial plane and see that the orange vector displayed in Fig. 4 is directed almost straight down in this new view. The cyan vector directed toward the lower left is the projection of the CMB dipole vector of 631 km/s. The difference between these two is the brown vector of 455 km/s, pointing almost horizontal (ie, close to the supergalactic equator) to the left. This component was not picked up by our sample of distances, so is attributed to structure at velocities greater than 3000 km/s.
3 Voids Push
In a more complete description of this research tul07 it is shown that a completely empty hole in an otherwise uniform medium in a CDM cosmology with matter density expands at 16 km/s/Mpc. In the present situation, we want to interpret 260 km/s as expansion away from the Local Void. It is required that the Local Void have a diameter of at least 45 Mpc. To the degree that it is not empty, it must be larger.
There is an attempt to illustrate the region of the Local Void with Figure 7. It is difficult to give a fair representation, first because much of it is concealed behind the center of our Galaxy, and second because it is so very large. The region is not entirely empty of galaxies. Several minor filaments lace through the volume and motivate us to separate the nearest part of the Local Void from more distant North and South extensions. On observational grounds, an ensemble void region of greater than 45 Mpc cannot be excluded.
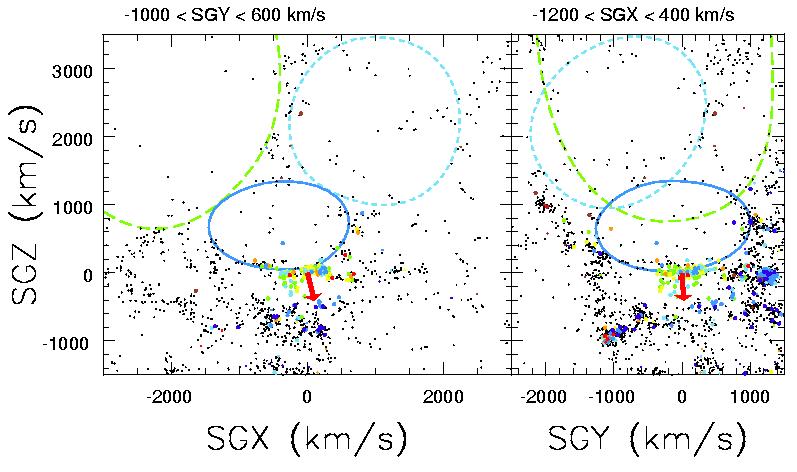
A probem mentioned earlier with dynamic models is now illuminated. Those models require some assumption about the distribution of matter in the zone of avoidance. A priori, it would be unreasonable to assume that this region is empty, and modelers use a variety of recipes that usually result in assigning the mean density to unseen places. Future models should consider what happens if the sector of the Local Void is left empty.
Perhaps the most interesting issue raised in this study is the following. There are debates about whether voids are really empty of matter or whether they are just low density regions where star formation is inefficient. Researchers have studied voids at large distances in attempts to answer this question but have given little attention to the void that starts only 1 Mpc away. We are in a unique position to study the peculiar motion of the shell bounding our own void. The observed motion away from the Local Void, the Local Velocity Anomaly, might represent the best available evidence that voids are really empty.
This report summarizes research undertaken with Ed Shaya, Igor Karachentsev, Hélène Courtois, Dale Kocevski, Luca Rizzi, and Alan Peel and published as reference tul07 . Videos in support of the discussion are found at http://www.ifa.hawaii.edu/ tully/. Financial support has been provided by the US National Science Foundation and Space Telescope Science Institute.
References
- (1) M. Aaronson, J.P. Huchra, J.R. Mould, P.L. Schechter, R.B. Tully: 1982, ApJ, 258, 64
- (2) L. Bottinelli, L. Gouguenheim, G. Paturel, P. Teerikorpi: 1986, A&A, 156, 157
- (3) S.M. Faber, D. Burstein: Motions of Galaxies in the Neighborhood of the Local Group. In: Large-Scale Motions in the Universe: Vatican Study Week, ed by V.C. Rubin, G.V. Coyne (Princeton University Press 1988) p116
- (4) W.L. Freedman et al.: 2001, ApJ, 553, 47
- (5) E. Giraud: 1990, A&A, 231, 1
- (6) M. Han, J.R. Mould: 1990, ApJ, 360, 448
- (7) I.D. Karachentsev et al.: 2003, A&A, 398, 479
- (8) I.D. Karachentsev, S.N. Mitronova, V.E. Karachentseva, Y.N. Kudrya, T.H. Jarrett: 2002, A&A, 396, 431
- (9) D.D. Kocevski, H. Ebeling, C.R. Mullis, R.B. Tully: 2007, ApJ, 662, 224
- (10) R.C. Kraan-Korteweg, L. Cameron, G.A. Tammann: 21cm Line Widths and Distances of Spiral Galaxies. In Galaxy Distances and Deviations from Universal Expansion, ed by BF Madore and R.B. Tully (Reidel Publishing Co 1986) p65
- (11) R.C. Kraan-Korteweg, O. Lahav: 2000, A&AR, 10, 211
- (12) D. Lynden-Bell, O. Lahav: Whence Arises the Local Flow of Galaxies? In: Large-Scale Motions in the Universe: Vatican Study Week, ed by V.C. Rubin, G.V. Coyne (Princeton University Press 1988) p199
- (13) M.J Meyer et al. (HIPASS collaboration): 2004, MNRAS, 350, 1195
- (14) R. Mohayaee, R.B. Tully: 2005, ApJ, 635, L113
- (15) S.D. Phelps, P.J.E. Peebles, E.J. Shaya, R.B. Tully: 2001, ApJ, 554, 104
- (16) S. Sakai, B.F. Madore, W.L. Freedman: 1996, ApJ, 461, 713
- (17) A.Sandage: 1999, AJ, 117, 157
- (18) E.J. Shaya, P.J.E. Peebles, R.B. Tully: 1995, ApJ, 454, 15
- (19) R.B. Tully: Distances to Galaxies in the Field. In: Large-Scale Motions in the Universe: Vatican Study Week, ed by V.C. Rubin, G.V. Coyne (Princeton University Press 1988) p169
- (20) R.B. Tully, J.R. Fisher: 1977, A&A, 54, 661
- (21) R.B. Tully, J.R. Fisher: 1987, Nearby Galaxies Atlas, Cambridge University Press
- (22) R.B. Tully, M.J. Pierce: 2000, ApJ, 533, 744
- (23) R.B. Tully, E.J. Shaya, I.D. Karachentsev, H. Courtois, D.D. Kocevski, L. Rizzi, A. Peel: 2007, ApJ, submitted (astro-ph/0705.4139)
- (24) R.B. Tully, E.J. Shaya, M.J. Pierce: 1992, ApJS, 80, 479
- (25) J.L. Tonry et al.: 2001, ApJ, 546, 681