Observation of the “head-tail” effect in nuclear recoils of low-energy neutrons
Abstract
Directional detection of dark matter can provide unambiguous observation of dark matter interactions even in the presence of background. This article presents an experimental method to measure the direction tag (“head-tail”) of the dark matter wind by detecting the scintillation light created by the elastic nuclear recoils in the scattering of dark matter particles with the detector material. The technique is demonstrated by tagging the direction of the nuclear recoils created in the scattering of low-energy neutrons with CF4 in a low-pressure time-projection chamber that is developed by the DMTPC collaboration. The measurement of the decreasing ionization rate along the recoil trajectory provides the direction tag of the incoming neutrons, and proves that the “head-tail” effect can be observed.
keywords:
Dark Matter, Directional Detector, Nuclear Scattering, Optical Readout , TPC , WIMPPACS:
29.40.Cs , 29.40.Gx , 95.35.+d1 Introduction
Searches for non-baryonic dark matter in the form of weakly interacting massive particles (WIMPs) rely on detection of nuclear recoils created by the elastic scattering between a WIMP and the detector material. The current generation of experiments [1] attempt to suppress all backgrounds to negligible levels so that any remaining events would be attributed to the WIMP signal. However, as the size of the apparatuses increases and the sensitivity to dark matter improves, some irreducible backgrounds will start to appear, rendering a positive observation of a dark matter signal suspect. Examples of such backgrounds are nuclear recoils due to neutrons generated by cosmic rays in the rock surrounding the detector, or neutrinos from the sun [2]. The measurement of an annual modulation of the interaction rate of dark matter has been suggested [3], but this effect is expected to be small (a few percent).
An unambiguous observation of dark matter in presence of background is possible by detecting the direction of the incoming dark matter particles. As the Earth moves in the galactic halo with a velocity of approximately 220 km/s, the dark matter particles appear to come from the Cygnus constellation. By measuring the direction of the WIMPs and correlating such measurement with the position of Cygnus in the sky, an experiment can gain orders of magnitude in sensitivity to dark matter [4]. The determination of the vector direction of the incoming particle, often referred to as the “direction tag” or the “head-tail”, is very important since it further increases the sensitivity of a directional detector by approximately an order of magnitude [5].
The DRIFT experiment [6] pioneered the study of directional detection of dark matter and demonstrated the ability to reconstruct the direction of the incoming particles by detecting the direction of recoiling nuclei in a gaseous detector. However, the capability of detecting the direction tag of the incoming particles has not been demonstrated by any experiment to date.
This paper demonstrates a technique to determine the direction tag (“head-tail”) of low-energy nuclear recoils created by dark matter particles by using a time-projection chamber (TPC) with optical readout developed by the DMTPC collaboration. The projection of nuclear recoils along the anode wires of the TPC is recorded by a charge-coupled device (CCD) camera imaging the scintillation photons produced during the avalanche process. The measurement of the direction tag relies on the fact that the stopping power (dE/dx) of recoiling nuclei depends on their residual energy, and therefore the recoil direction can be tagged from the light distribution along the track. The energy of the nuclear recoils created by the scattering of low energy neutrons or dark matter particles is of the order of a few keV per nucleon, well below the Bragg peak. Therefore a decreasing light yield along the track is expected.
2 Experimental Setup
A schematic of the detector is shown in Figure 1. The chamber utilizes wire frames. The drift region between the cathode mesh and the ground wire plane is 2.6 cm, while the amplification region between the ground and the anode wire planes is about 3 mm. The pitch of the wires for the ground (anode) plane is 2 mm (5 mm) and the wire diameter is 50 m (100 m). The chamber is filled with CF4 at 150-380 Torr. The pressure is monitored with a capacitance gauge (Inficon PCG400) in the calibration runs with alpha particles, and a thermocouple gauge (LVG-200TC) in the nuclear scattering runs.
The scintillation light is recorded with a CCD camera manufactured by Finger Lake Instrumentation equipped with a CCD chip (Kodak KAF-0401E). The camera has a built-in cooler that maintains the temperature in the range [-20,-18] C to minimize electronic noise. The pixel size is 99 . The photographic lens has the aperture ratio, f/# of 1.4 and the focal length of 55 mm. The peak value for the quantum efficiency of the CCD chip is approximately 80%. The gain of the camera is measured to be e-/ADC count. The RMS spread of pixel yields due to ADC noise and dark current is measured to be 7 counts when all pixels are read out, and 25 counts when pixels are combined during the CCD readout. Pixels that have intensity greater than 5 standard deviations from the mean dark field at least 10% of the time are flagged as ‘hot channels’ and excluded in the data analysis. ADC bias is corrected for by subtracting from each image the average of 100 images taken with the shutter closed.
Neutrons used in this work are produced isotropically with 14.1 MeV energy from deuteron-triton reactions in a neutron generator (Thermo MF Physics A-325). The deuterium plasma is generated by a 3 kV voltage pulse and accelerated through a 70 kV region toward a triton target. The pulses are 100 s wide and issued at a frequency of 1 kHz. Using the manufacturer’s specifications, the total isotropic flux of neutrons is estimated to be neutrons/s. The solid angle imaged with the CCD camera is sr.
3 Calibration with Source
The detector response is evaluated using 5.5 MeV particles from a collimated 241Am source. The chamber is filled with CF4 at various pressures in the range 100-380 Torr. The drift field is set to 580 V/cm, while the amplification voltage is varied between 2.1 and 4.1 kV. Images are taken sequentially with 1 second exposure time.
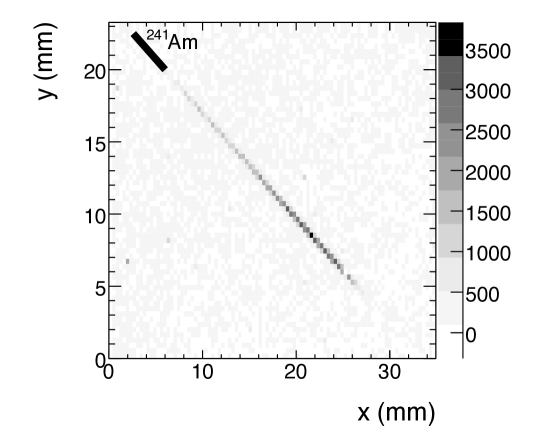
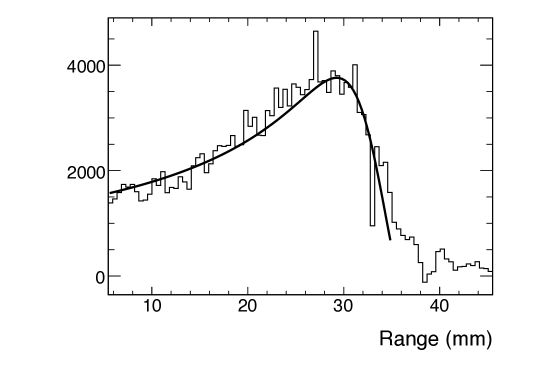
Figure 2 shows the accumulation of 12 images of tracks from a source placed in the upper-left corner of the CCD field of view with its collimator pointing toward the lower-right corner. The anode wires are oriented parallel to the source. As the particle travels in the medium, the intensity of the scintillation light increases until it reaches a maximum corresponding to the Bragg peak, and then decreases toward the end of the track. The longitudinal scintillation profile is shown in the lower plot of Figure 2. This profile can be described with the energy loss due to ionization and excitation of gas molecules. This assumption is verified by fitting the distribution with the stopping power curve obtained with the SRIM simulation. The result of such a fit is shown in the same plot.
The range of particles in CF4 is obtained by varying the end-point of the track in the fit. Images at pressures ranging from 280 to 380 Torr are taken in 20 Torr increments. The range measured in data () is compared with values predicted by the simulation (). The agreement between data and simulation is found to be within the experimental errors, .
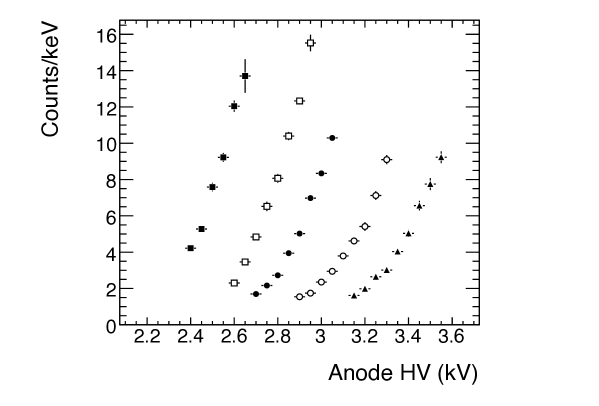
The gain of the detector is determined by measuring the intensity of the scintillation light recorded by the CCD camera as a function of the energy deposited in the detector by particles oriented perpendicular to the anode wires. SRIM is used to estimate the total energy deposited at each wire. Figure 3 shows the average yield in the CCD normalized to the expected energy loss over a wire for different pressures and amplification voltages.
The signal spread due to electron diffusion through the gas is one of the critical parameters in the design of a detector for dark matter search. Since the expected range of fluorine recoils in CF4 gas at 50 Torr is a few millimeters, the effect of the diffusion must be contained to well below 1 mm. This requirement defines the maximum drift length of the detector.
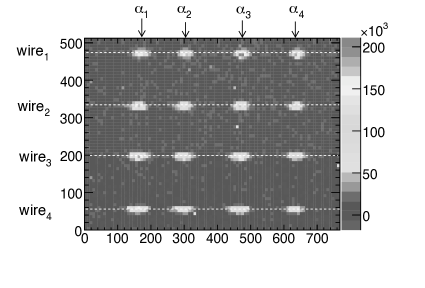
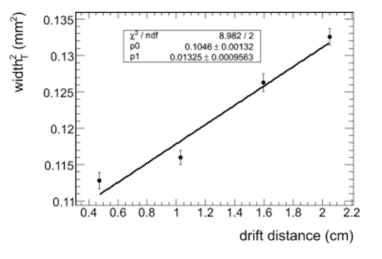
The diffusion parameters are measured using four sources placed perpendicular to the anode wires at different heights () above the grounded plane of the amplification region. Figure 4 shows the accumulation of 250 images of tracks coming from the four sources. The activity of the sources is small enough that each image contains only one track. Since there is no electric field parallel to the wires, the width of the signal along the wires is a measure of the electron diffusion in the drift and amplification regions. Taking the average width from all wires at a pressure of approximately 220 Torr, the resolution as a function of the drift distance is measured to be , where the errors are statistical. These measurements show that the maximum drift distance in this detector should be limited to 25 cm, for which the resolution is () .
 |
 |
4 Neutron Beam Results
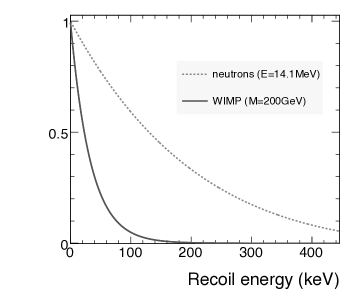
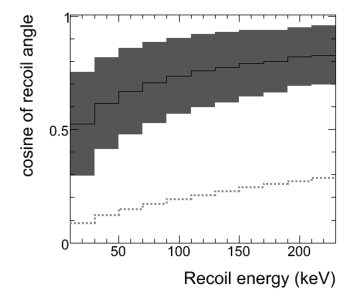
Nuclear recoils produced in dark matter scattering are simulated by using a 14.1 MeV neutron beam. Figure 5 compares the energy and scattering angle of the nuclear recoils generated by a 200 GeV WIMP (solid line) and by 14.1 MeV neutrons (dashed line). Overall the distributions are similar. Note that the lower energy of the recoils generated by WIMPs causes shorter track lengths. This effect is compensated by a much better alignment of the recoil momentum with the WIMP direction.
The neutrons enter the tracking chamber through a small opening in a 19 cm thick concrete shield. The wires of the tracking chamber are aligned with the direction of the neutron beam.
 |
 |
The tracking chamber is operated with cathode voltage of -1.5 kV, amplification anode voltage of +3 kV, and CF4 pressure of 200-250 Torr. Sequential 1-second exposures are taken with the CCD camera, imaging a region of 1 cm2 area. Only a few percent of the exposures are expected to contain the signature of a fluorine recoil since the total cross section for scattering of neutrons on fluorine is 1.75 b, and the cross section for elastic scattering is 0.9 b [8]. The dominant background comes from the F(n,n+)N process, with the cross section estimated at 0.45 b. However, the particles produced in this process are more energetic and have smaller energy loss than fluorine recoils, so they can be easily rejected.
The light yield and the length of the recoil tracks are measured for all candidates that pass the selection criteria. The length is extracted by projecting the pixels in the vicinity of the wire onto the axis parallel to the wires and measuring the span of the pixels above the background threshold. The light yield of the recoil segment is measured by making a projection of the CCD array to the axis perpendicular to the direction of wires. In this projection, the recoil appears as a Gaussian signal on top of a flat background. The width of the Gaussian function roughly equals the diameter of the wire, as the majority of the scintillation photons are created around the wire where the electric field is strongest, and the mean corresponds to the position of a wire. The integral of the Gaussian measures the light yield.
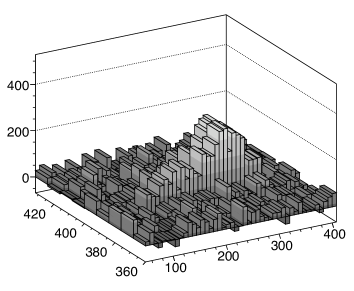
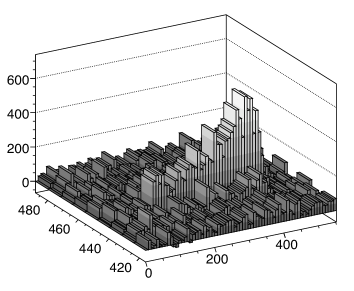
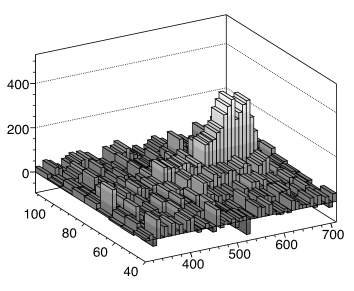
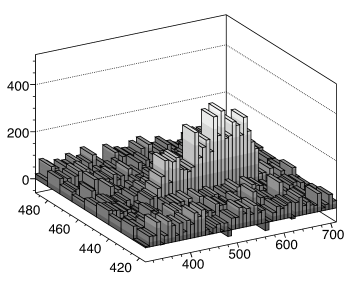
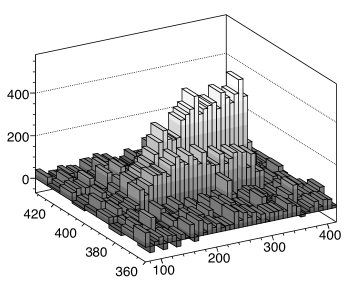
Empty images that make up about 70% of the data sample are rejected, as well as images that have segments shorter than 0.36 mm, images with more than one segment per wire, and recoil tracks that fall close to the boundary of the CCD field of view. If a recoil is found to have scintillation light at two wires, only the wire with the larger scintillation signal is used in the analysis. Approximately 5-7% of all events pass the selection criteria. Some of the selected images are shown in Figure 6. The noticeable asymmetry of the light yield along the wire indicates observation of the “head-tail” effect.
 |
 |
 |
 |
 |
 |
In order to quantify the observed asymmetry in the scintillation light, we define the skewness as the dimensionless ratio between the third and second moments of the light yield along the wire coordinate ():
| (1) |
The skewness provides a simple measure of the “head-tail” asymmetry. This quantity is zero for perfectly symmetric distributions, and non-zero for asymmetric distributions around the mean. The sign of the skewness indicates the slope of the light intensity along the track. Recoils that travel in the direction of the incoming neutrons have a decreasing light profile, and therefore a negative skewness. Since the skewness is dimensionless, it is not affected if the coordinate is multiplied by a constant factor, which in our case is the cosine of the recoil angle with respect to the wire. However, shorter segments can be affected by the finite detector resolution.
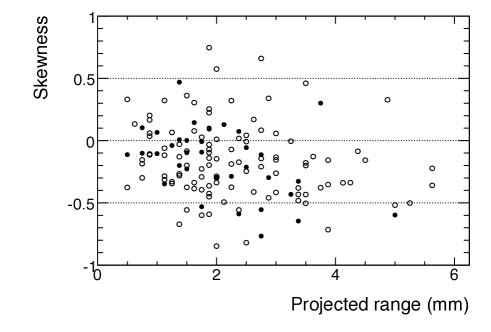
The measured skewness as a function of the segment length is shown in the upper plot of Figure 7. In ()% of all events the skewness is measured to be negative, as expected for the nuclear recoils from neutrons. This represents a 6 observation of the “head-tail” effect.
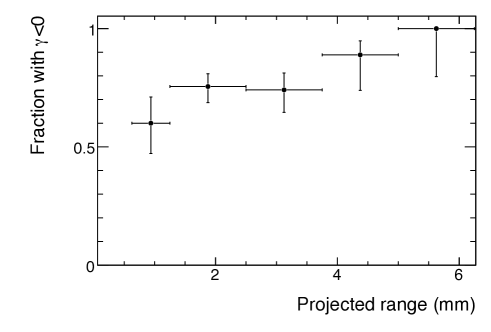
Because the skewness is computed along the direction of the wires, the asymmetry is easier to observe for longer tracks that are better aligned with the anode wires and create more scintillation light. The bottom plot in Figure 7 shows the fraction of events with negative skewness as a function of the track length.
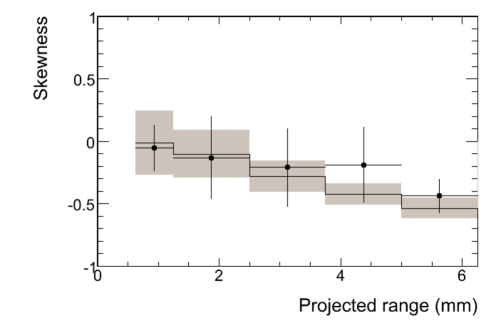
The skewness of nuclear recoils is computed using the stopping power and straggling according to the SRIM simulation. In addition, detector effects such as diffusion and light detection inefficiencies are included based on the measurements obtained with tracks. The simulation also takes into account that some of the recoils are only partially contained in the CCD view field. The middle plot of Figure 7 shows the mean values and the dispersion of the skewness in data (dots) and simulation (histogram). The agreement between data and simulation is satisfactory.
5 Discussion of Results
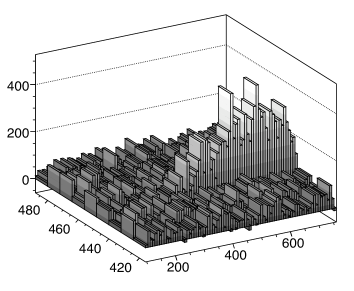
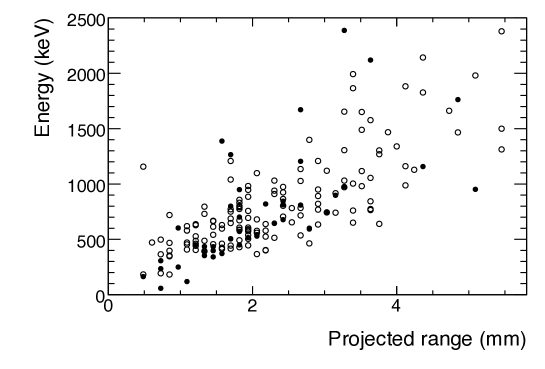
Several cross-checks are performed to validate this result. Since the measured light yield is proportional to the energy of the recoil segment and the length is proportional to the track range projected to the wire, these two quantities should be correlated. Figure 8 shows the scatter plot of the energy versus projected range of the recoil segments measured in data. A clear correlation is observed.
The possibility that the “head-tail” asymmetry is created by imperfections in the construction of the tracking chamber is excluded by taking a fraction of the data with anode wires rotated by 180 degrees with respect to the neutron beam. The measurement of the skewness is consistent in the two data-sets.
We collect data with the neutron beam perpendicular to the anode wires. In this configuration there are an equal number of recoils traveling in both directions, resulting in an equal number of events with positive and negative skewness. The average skewness in all events is , consistent with the expected symmetric distribution.
The average skewness due to tracks traveling perpendicularly to the anodes is measured to be , consistent with having symmetrical scintillation transverse to the direction of the trajectory.
The hypothesis that the scintillation signal is affected by recoil tracks leaving the drift region was discarded because such segments would have abrupt endings, which is inconsistent with the slowly dimming signals observed in data.
As a final check, we collect data without sources and search for signatures that resemble nuclear recoils. In this analysis we count events with pixel yields at least five standard deviations above the background level. We measure the rejection rate to be approximately , which can be further improved by taking into account the energy, range and direction of recoil candidates.
A conservative error of 20% was assigned to the density of the CF4 gas to account for problems with the pressure measurement. This measurement was obtained by using a gas-dependent thermo-couple gauge in the nuclear recoil measurements, which was cross-calibrated with a more precise capacitance gauge used in the calibration measurements with alpha particles. However, the uncertainty of the pressure measurement relates to the exponential error on the gain measurement. This effect is minimized by assuming that all events are fluorine recoils, and by determining the chamber gain by adjusting the slope in Figure 8 to correspond to the slope of fluorine recoils. Using this procedure, the a gain of 8 ADC counts per keV is measured. This gain was used as input for MC studies and to calibrate the axes of figure 8. Other systematic errors on the energy measurement come from the non-uniformity in the gain between wires and the stability of the gain with time. In addition, the statistical uncertainty on the energy measurements is approximately 10%, as determined from calibration with alpha particles.
The error on the recoil range comes from the non-uniformity in the wire pitch (10%) and the analysis technique that overestimates the range for low-energy recoils with the range close to the diffusion width.
6 Conclusion and Outlook
This study demonstrates a method for tagging the direction of low-momentum nuclear recoils generated by the elastic scattering of low-energy neutrons in CF4 gas. The tag of the incoming particle is determined from the profile of the scintillation light along the track trajectory, leading to a 6 observation of the “head-tail” effect for recoil energies above 500 keV.
In the near future, these studies will be extended to lower energy recoils produced by a Californium-252 source. By using a similar detector but built with higher quality standards, the “head-tail” effect is expected to be visible down to approximately 100 keV.
These studies have profound implications for the development of directional dark matter detectors, as they proves that “head-tail” discrimination is indeed feasible. Directional detectors will be essential to provide convincing evidence for dark matter particles in the presence of backgrounds.
7 Acknowledgments
We acknowledge support by the Advanced Detector Research Program of the U.S. Department of Energy (contract number 6916448), as well as the Reed Award Program, the Ferry Fund, the Pappalardo Fellowship program, and the Physics Department at the Massachusetts Institute of Technology.
References
- [1] R. J. Gaitskell, Ann. Rev. Nucl. Part. Sci. 54, 315 (2004).
- [2] J. Monroe and P. Fisher, Phys. Rev. D 76, 033007 (2007).
- [3] A. K. Drukier, K. Freese and D. N. Spergel, Phys. Rev. D 33, 3495 (1986). K. Freese, J. A. Frieman and A. Gould, Phys. Rev. D 37, 3388 (1988).
- [4] D. N. Spergel, Phys. Rev. D 37, 1353 (1988).
- [5] A. M. Green and B. Morgan, Astropart. Phys. 27, 142 (2007).
- [6] S. Burgos et al., arXiv:0707.1488 [hep-ex].
- [7] J. F. Ziegler, J. P. Biersack, U. Littmark, Pergamon Press, New York, 1985. The code is available online at www.SRIM.org.
- [8] M.B. Chadwick et al., Nuclear Data Sheets 107 (2006), 2931-3060