Adaptive optics imaging and optical spectroscopy of a multiple merger in a luminous infrared galaxy1
Abstract
We present near-infrared (NIR) adaptive optics imaging obtained with VLT/NACO and optical spectroscopy from the Southern African Large Telescope (SALT) of a luminous infrared galaxy (LIRG) IRAS 19115-2124. These data are combined with archival HST imaging and Spitzer imaging and spectroscopy, allowing us to study this disturbed interacting/merging galaxy, dubbed the Bird, in extraordinary detail. In particular, the data reveal a triple system where the LIRG phenomenon is dominated by the smallest of the components.
One nucleus is a regular barred spiral with significant rotation, while another is highly disturbed with a surface brightness distribution intermediate to that of disk and bulge systems, and hints of remaining arm/bar structure. We derive dynamical masses in the range 3–7 for both. The third component appears to be a 1–2 mass irregular galaxy. The total system exhibits H II galaxy-like optical line ratios and strengths, and no evidence for AGN activity is found from optical or mid-infrared data. The star formation rate is estimated to be . We also report a search for supernovae from NIR images separated by 5 months and search for super star cluster candidates. We detect outflowing gas from the Bird mostly in the range 100–300 km s-1 using Na I D absorption features. Overall, the Bird shows kinematic, dynamical, and emission line properties typical for cool ultra luminous IR galaxies. However, the interesting features setting it apart for future studies are its triple merger nature, and the location of its star formation peak – the strongest star formation, as revealed by Spitzer imaging, does not come from the two major -band nuclei, but from the third irregular component. This is in contrast to the conventional view that the (U)LIRG phases are powered by infalling gas to the major nuclei of the merging spiral galaxies. Aided by simulations, we discuss scenarios where the irregular component is on its first high-speed encounter with the more massive components.
keywords:
galaxies:individual(IRAS 19115-2124) – infrared: galaxies – galaxies: starburst – galaxies: interactions – galaxies: evolution – galaxies: kinematics and dynamics1 Introduction
11footnotetext: Based on observations made with ESO Telescopes at the Paranal Observatory under programme 073.D-0406A, and with the Southern African Large Telescope (SALT).Over the last three decades, evidence has mounted that luminous infrared (IR) galaxies (LIRGs222objects with 8–1000m luminosities in excess of ; objects with 8–1000m luminosities are commonly referred to as ultraluminous IR galaxies, ULIRGs) may signpost important events in understanding the wider picture of galaxy formation and evolution. First hinted at by ground based studies in the 1970s (Rieke & Low, 1972), the importance of infrared-luminous activity in galaxies was clearly demonstrated by surveys with IRAS (Houck et al., 1985), which found large numbers of extragalactic sources that were bright at mid/far-IR wavelengths, and varied substantially in nature as a function of infrared (8–1000m) luminosity. Those sources with IR luminosities less than about were mainly either dwarf galaxies or relatively dustless ellipticals, where the IR emission arose almost entirely from dust grains heated by ambient interstellar light. Sources with IR luminosities in the range contained a significant fraction of ellipticals, but with a rising number of IR-luminous disk galaxies and galaxy mergers. At IR luminosities of however, mergers were almost ubiquitous, with very few undisturbed disk or elliptical systems. In the bulk of these systems the IR emission was thought to arise from some combination of dense, compact starbursts, and deeply buried AGN. Surveys with ISO (e.g. Elbaz et al., 2002) and SCUBA (e.g. Hughes et al., 1998; Coppin et al., 2006) then showed that LIRGs become increasingly common with increasing redshift, going from of order a few hundred examples over the whole sky at to several hundred per square degree at . These distant LIRGs seem similar, at least superficially, to their low redshift counterparts (e.g. Farrah et al., 2002a, b; Chapman et al., 2003; Smail et al., 2003; Takata et al., 2006; Valiante et al., 2007). Excellent reviews of the properties of LIRGs can be found in Sanders & Mirabel (1996), and more recently in Lonsdale et al. (2006).
That the luminous end of LIRGs were discovered to be almost invariably mergers containing obscured starbursts and AGN linked them to several important galaxy transformational processes, but also raised many questions. Numerical simulations suggested that mergers could serve to transform disk galaxies into elliptical galaxies (e.g. Barnes, 1990), potentially linking LIRG activity to a key step in the formation of the familiar galaxy morphologies seen locally, but some recent simulations have found evidence that this may not always be the case (e.g. Bournaud et al., 2005; Robertson et al., 2006). The exact number of merger progenitors is also controversial, with some studies finding that LIRGs are mostly mergers between two galaxies (Veilleux et al, 2002), and others finding evidence for multiple mergers in a significant number of LIRGs (Borne et al., 2000; Farrah et al, 2001). The starbursts and AGN in LIRGs are obviously candidates for building up the stellar masses and large central black holes seen in ellipticals, but exactly how and when starburst and AGN activity are triggered as a function of merger stage, how the star formation is distributed spatially and evolves in time, and how the starburst and AGN contributions to the total IR emission can be disentangled, are still debated. Two examples include the longstanding debate over the links between LIRGs and QSOs (Kawakatu et al., 2006), and the recent suggestion that the far-IR emission from LIRGs is determined more by whether the starburst or AGN is the dominant feedback mechanism, rather than which is more intrinsically luminous (Chakrabarti et al., 2007). The issue of feedback in LIRGs, in particular large-scale outflows, is also important for determining how LIRGs may contribute to the enrichment of the intergalactic medium (Veilleux et al., 2003; Lípari et al., 2005).
The central position that LIRGs seem to play in galaxy evolutionary processes at all redshifts makes their in-depth understanding of great interest. When considering studies of local LIRGs there are, broadly, two approaches; population studies of large samples to assess trends, and concentrated studies of single objects using panchromatic datasets. In this paper we adopt the latter approach, utilizing a comprehensive library of imaging and spectroscopic data to study the dynamics and power source within a nearby gas-rich interacting LIRG, to understand how merger dynamics are affecting, and have affected, its starburst and AGN activity. Our dataset comprises imaging from the Advanced Camera for Surveys onboard the Hubble Space Telescope (ACS/HST), deep optical spectroscopy from the newly commissioned Southern African Large Telescope (SALT), adaptive optics near-infrared (NIR) imaging from the Very Large Telescope (VLT), and mid-infrared photometry and spectroscopy from the instruments onboard Spitzer. Using this dataset we (1) construct a detailed picture of the merger dynamics in this system, (2) estimate the number of merger progenitors, (3) deduce the luminosities and other relevant parameters for starburst and AGN activity, (4) search for evidence for outflows, and (5) discuss scenarios of the system’s evolution. We assume a spatially flat cosmology with km s-1 Mpc-1, , and .
2 Observations and data reduction
2.1 The target
The luminous infrared galaxy IRAS 19115-2124, also known as ESO 593-IG 008, lies at a redshift . It has an IR luminosity of (Sanders et al., 2003), making it fall just short of a formal ULIRG classification of , and a molecular hydrogen mass of (Mirabel et al., 1990). It is a classical example of a nearby, IR-luminous, gas-rich interacting system. The Virgo infall corrected distance to IRAS 19115-2124 with our adopted systemic velocity of km s-1 is 200.0 Mpc, and the angular scale 0.97 kpc arcsec-1.
2.2 NACO near-infrared imaging
Near-infrared imaging of IRAS 19115-2124 was carried out using the NAOS-CONICA (NACO) adaptive optics (AO) instrument on the VLT UT4. The -band (the subscript will be dropped henceforth for simplicity) data set, using the S27 camera giving a field of view (FOV) of 27 arcsec and pixel size of 0.027 arcsec, presented here was taken in service mode on April 13, 2004. The visual wavefront sensor in mode VIS-WFS 2-7 using a mag natural guide star 22 arcsec southwest of the target was used for the AO correction. Coherent energies of the reference star in the range 48 to 54 per cent were achieved in individual frames, while a strehl ratio (SR) was measured at the location of the target galaxy in the final image. The FWHM of point sources close to the target galaxy in the final image are approximately 0.10 arcsec. The NACO -band observations were repeated on September, 10, 2004, to allow searching for supernovae (SNe) within the nuclear regions of the galaxy. This time coherent energies for the reference star ranged between 36 and 51 per cent in the individual frames, yielding SR0.18 at the location of the target galaxy in the final image.
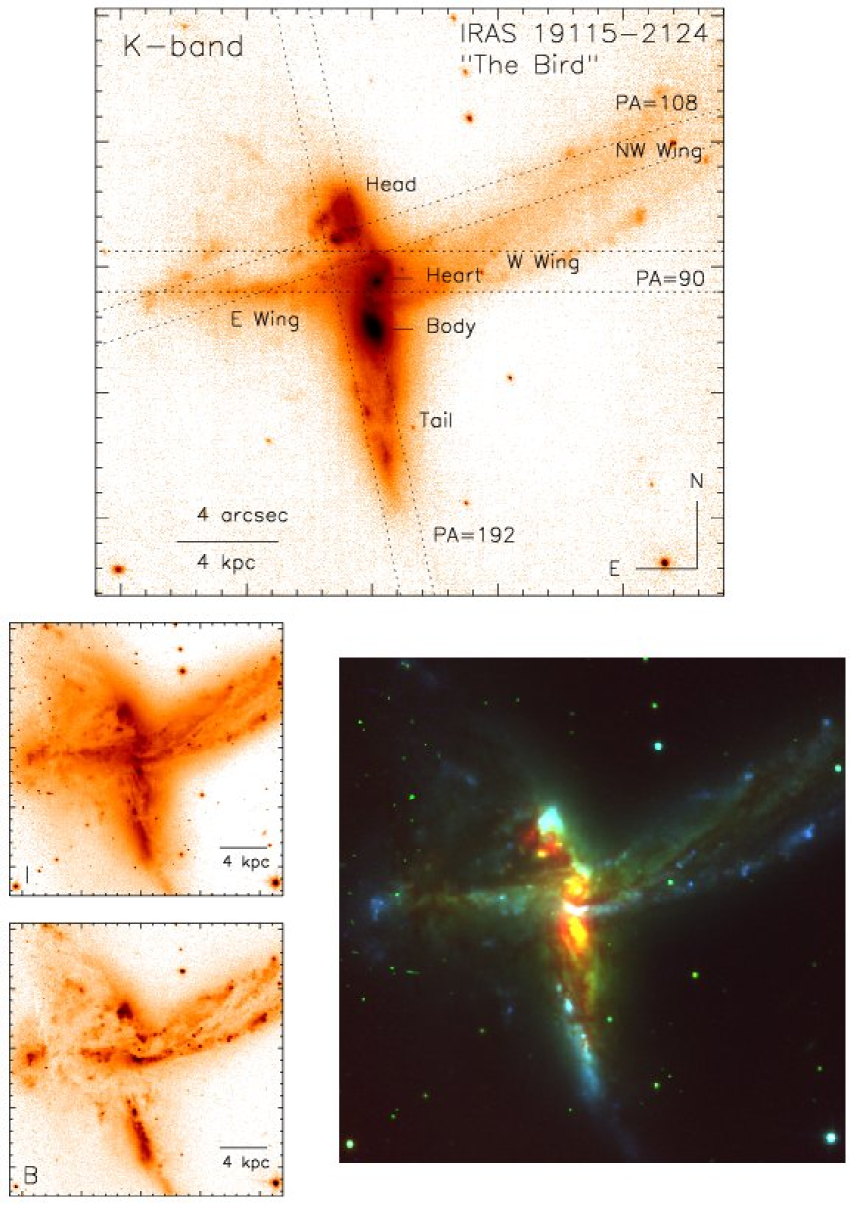
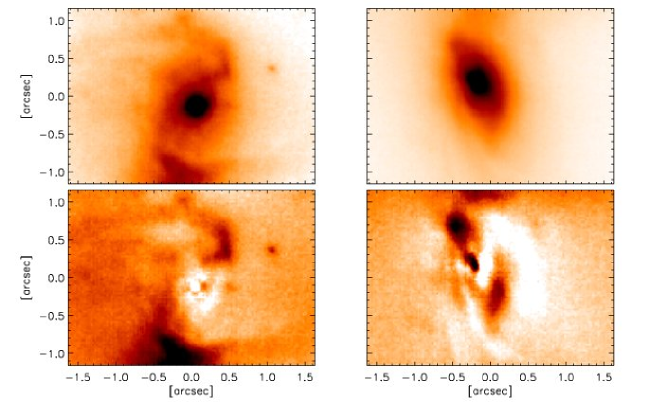
The (auto)jittered frames were median combined to form a sky image using IRAF. The sky subtracted images were then de-dithered using the centroid of a bright field star. The AO correction was sufficiently stable over the whole observation that 23 out of the 24 frames obtained on April 13 were used to median combine the final image. The individual frames had 90 sec exposure times, giving a total integration time of 2070 seconds for the final image of IRAS 19115-2124 (Fig. 1). For the second epoch image all 24 of the 90 sec exposures taken were median combined to form the final frame with 2160 sec total integration time.
We tied the photometry of the final image to the 2MASS -band using large-aperture photometry of the galaxy itself, as well as 2MASS stars in the FOV. The resulting zero-point is also consistent with the ESO provided photometric standard star calibration, and we estimate the absolute Vega-based magnitude to be accurate to within mag. The astrometric solution was found using GSC2 field stars. Four were available in the FOV, and the rms of the fit was 0.09 arcsec; the absolute GSC2 system has an uncertainty in the range 0.2–0.5 arcsec for individual stars.
2.3 Optical observations
2.3.1 HST/ACS imaging
We extracted archival ACS images (PI: Evans) of the Bird in F435W and F814W bands, i.e. in the HST and -bands, of exposure times 1260 and 720 seconds, respectively. These data are already calibrated and we used the supplied Vega-based zeropoints. We did not perform any additional processing of the images, except a flux-conserving geometric transformation into the NACO image size and resolution for the purpose of photometry in identical apertures. The images, as well as a 3-colour image with the -band included, are shown in Fig. 1.
2.3.2 SALT/RSS spectroscopy
Spectroscopic observations presented here were obtained with the Robert Stobie Spectrograph (RSS, Burgh et al., 2003; Kobulnicky et al., 2003) during the commissioning and performance verification stage of SALT (Buckley et al., 2006; O’Donoghue et al., 2006), a new 10-m class telescope in Sutherland, South Africa.
The RSS observations are described in Table 1. We placed slits through the galaxy system in three different position angles (PA) on three different nights. The slit positions are indicated in Fig.1. The same grating (PG1800) with a dispersion of 0.41 Å and spectral resolution of 2.4 Å FWHM (with 1.5 arcsec slit), and spectral range from Å to Å was used each time. The October 22 data set is of the best quality, taken in both good seeing and transparency conditions. The October 10 observations were taken through thin clouds, and have lower signal to noise ratio (SNR) than the others, though all the strong emission lines are very clearly seen. Spectra of Cu-Ar and Ne comparison lamps were taken after the science frames.
The data were first bias and overscan subtracted, gain corrected, trimmed, cross-talk corrected, and mosaiced, using a specially adapted salt IRAF package, and cosmic ray corrected using MIDAS routines. The IRAF twodspec package was used to wavelength calibrate and correct each frame for distortion and tilt, and to background subtract the 2D spectra. The apall routine was used to extract various 1D spectra. The derived internal errors for the 2D wavelength calibrations are Å throughout the wavelength range of detected emission lines, i.e. km s-1, except for September 19 where Å. In addition, a check of night sky lines throughout the wavelength range, using methods described in Zasov et al. (2000), confirmed the accuracy of the calibration to this level. All line-of-sight velocities presented here were then corrected for heliocentric motion.
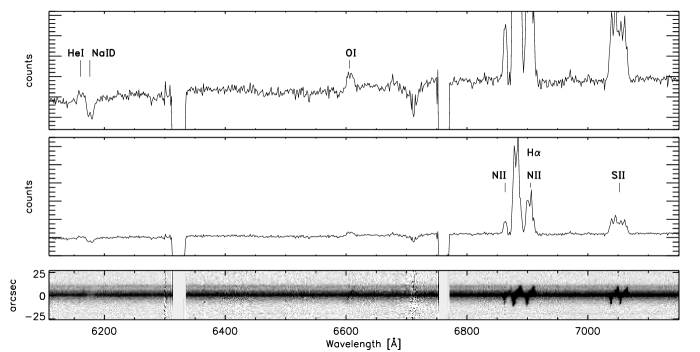
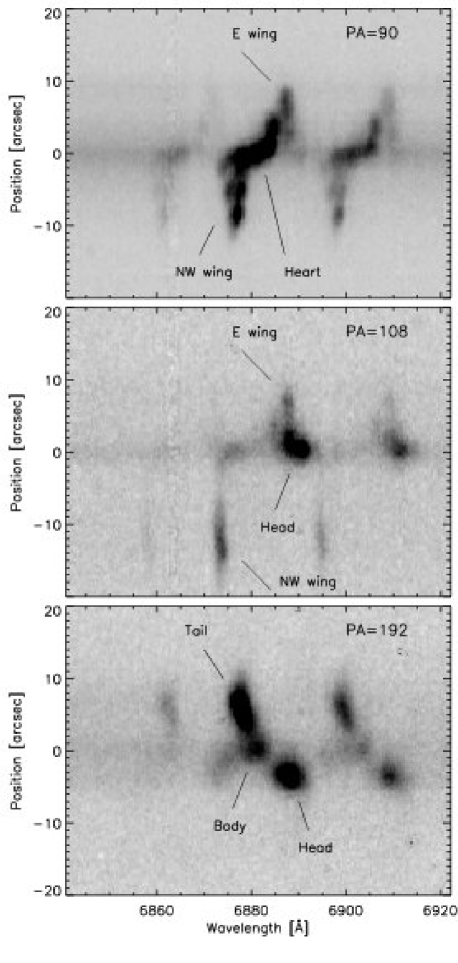
Figure 2 shows the 1D and 2D spectra of the PA=90 data, while Fig. 3 shows the 2D spectral region around H of all three slit positions.
| Date | Exp.time | Band | ||
| VLT/NACO | 13/04/2004 | 2070 sec | ||
| VLT/NACO | 10/09/2004 | 2160 sec | ||
| Date | Exp.time | Slit | PA | |
| SALT/RSS | 19/09/2006 | 1500 sec | 1.5″ | 192 deg |
| SALT/RSS | 10/10/2006 | 900 sec | 1.0″ | 108 deg |
| SALT/RSS | 22/10/2006 | 1200 sec | 1.5″ | 90 deg |
2.4 Spitzer MIR imaging and spectroscopy
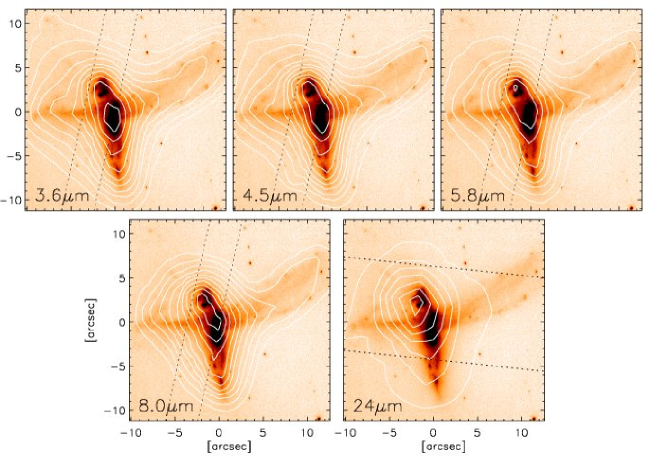
We obtained archived Spitzer IRAC (3.6, 4.5, 5.8, and 8m) and MIPS (24m) images of IRAS 19115-2124 (PI: Mazzarella). We used the post-basic calibrated data (PBCD) products provided by the S14.0.0 and S14.4.0 versions of the pipeline for the IRAC and MIPS data, respectively. The IRAC PBCD mosaics were rebinned to the pixel scale of NACO and were aligned to the same orientation and pixel coordinates using centroid positions of 2–4 point sources visible in both images. Fig. 4 shows the IRAC and MIPS contours.
Spitzer IRS data (PI: Armus) were also extracted from the archive. The data consists of SL (5.2 – 14.5 m wavelength range, 3.7 arcsec slit width) and LL-mode (14 – 38 m, 10.5 arcsec slit width). Figure 5 shows the spectrum with the most important polycyclic aromatic hydrocarbon (PAH) and emission lines indicated. The orientations of the SL and LL mode slits are overlaid on the IRAC and MIPS contour images, respectively, in Fig. 4.
The IRS data were reduced using the SMART and SPICE software packages. The individual BCD frames for each nod position were cleaned of cosmic rays and other artifacts using the irsclean software package, and combined into a single image using the ‘fair coadd’ option within SMART. Sky subtraction was performed for each module by using the off-order image from the same module (so called ’order-order’ sky subtraction). Spectra were then extracted and flux-calibrated from these sky-subtracted, combined images using the ’optimal extraction’ option within SPICE. All other parameters, such as extraction apertures ( arcsec), were left at their default values. The 1D spectra for each nod position were then combined to give the final spectrum. However, since the IRS slits do not completely cover the galaxy system, and because of the varying slit size in the short and long wavelength part of the IRS spectrum, we multiplied the SL section of the this final spectrum by a factor of 1.6 and the LL section by 1.2. These corrections were estimated from flux falling outside the slits in the IRAC and MIPS maps, and we estimate them to be accurate to 10–15 per cent. The IRS spectrum agrees with broad band photometry after the correction.

3 Analysis
3.1 System characteristics from imaging
3.1.1 General morphology and photometry
On the basis of the -band NACO AO-image alone, IRAS 19115-2124 appears to be a major merger system with at least two prominent components, perhaps three, with tidal tails in addition (see Fig. 1). With its outspread wings, a head complete with a beak, a body and a tail, we dub this merging galaxy system the Bird.
We present photometry of the major components in the optical and NIR bands below. For these SExtractor (Bertin & Arnouts, 1996) and IDL based aperture photometry was used, and all the magnitudes are Vega based. We note that no aperture corrections, or corrections dependent on the slightly varying SR ratio over the image are needed when the aperture used is greater than arcsec in radius, or in the case of extended objects. Photometry of smaller point-like sources is explained in Sections 3.1.4 and 3.1.3.
The largest and brightest component in -band is the Southern galaxy nucleus, or the Body of the Bird. It is severely extinguished and virtually invisible in the ACS -band image. The bright NIR extent of this galaxy is kpc. In a 1 kpc radius aperture (1.03 arcsec) the apparent brightness of the central region is =12.82 mag, corresponding to absolute magnitude. This is not much fainter than an galaxy, Cole et al. (2001). Magnitudes in other apertures and all bands are tabulated in Table 2. The galaxy is quite disturbed and extends South with a more than 6 kpc long Tail of the Bird, which has several clear non-pointlike, elongated 0.3–1.0 kpc sized subconcentrations. The brightest two of these have (, mag), i.e. inside 300 pc radii.
The Heart of the Bird consists of a fairly regular looking barred spiral (in -band), with a wide opening of the spiral arms. The arms can be traced out to at least 2 kpc from the nucleus. In a radial aperture of 1 kpc the brightness is =13.35 mag, ie. . In the optical, the spiral arms are more pronounced than the nucleus, though only small sections of the arms can be seen in the -band.
The Head, the northernmost component, appears to be an irregular galaxy, extending approximately 2 kpc with numerous distinctive bright knots in the image, presumably bright H II regions and super star clusters (SSC). The optically brightest section is the northern part of the Head, while the brightest NIR knot is in the most obscured southern part of the Head. The total brightness of the Head is =13.80 mag in a 1 kpc radial aperture () i.e. only half a magnitude fainter than the Heart. Individual knots, excluding the more diffuse K-band background light, range in brightness from to . We can isolate 12 of these H II regions mainly at the edge of the component closest to the Heart; the blobs get fainter with increasing distance from the Heart and Body. Most of these blobs are in highly extincted regions and are not visible in the optical images – an elaboration on point-like SSC candidates is presented below in Section 3.1.4.
Additionally, there are tidal tails, the Wings, extending East and North-West, visible for 8 kpc and 15 kpc, respectively. In addition we separate a West Wing, a shorter section of the tidal tail below the larger structure extending North-West, and which appears from the ACS images to continue from the Heart spiral arms. All the Wings also have numerous bright knots though not as extended as the ones in the Tail. Finally, there is a very complex dusty area North of the E-wing and to the NE of the Head.
| Component | aperture111The 1.5, 1.0 and 0.5 kpc radius apertures are calculated above the global sky level, the 0.2 kpc aperture is above the local galaxy background. Photometric errors in all bands are dominated by systematic effects and are approximately at 0.05 mag level – only the 0.2 kpc aperture -band values have errors of the order of 0.2–0.4 mag. | |||
|---|---|---|---|---|
| (kpc) | (mag) | (mag) | (mag) | |
| Bird total | 15222Flux within a large 30 arcsec diameter. -band value is also equal to the 2MASS total magnitude | 15.6 | 13.6 | 11.0 |
| Body | 1.0 | 19.80 | 17.00 | 12.82 |
| … | 0.5 | 22.00 | 18.00 | 13.58 |
| … | 0.2 | 19.32 | 15.68 | |
| Heart | 1.0 | 19.31 | 16.87 | 13.35 |
| … | 0.5 | 21.52 | 18.22 | 14.41 |
| … | 0.2 | 23.81 | 19.63 | 16.63 |
| Head | 1.5 | 18.64 | 16.49 | 13.39 |
| … | 1.0 | 21.51 | 17.13 | 13.80 |
3.1.2 Surface brightness profiles and effective radii
To study the morphologies of the galaxy components of the Bird more quantitatively, we used the GALFIT (Peng et al., 2002) software on the NACO data to fit 2D surface brightness distributions to the two brightest components, the Heart and the Body, and in addition fit simple surface brightness profiles to cuts along the semi-major axes of these two galaxies. All the systems of the Bird are quite disturbed, so unique solutions, especially with GALFIT, are difficult to find. Nevertheless, results are satisfactory for the purpose of classifying the galaxies, and to derive effective radii to better than a factor of 2 accuracy, that is needed in mass estimates later.
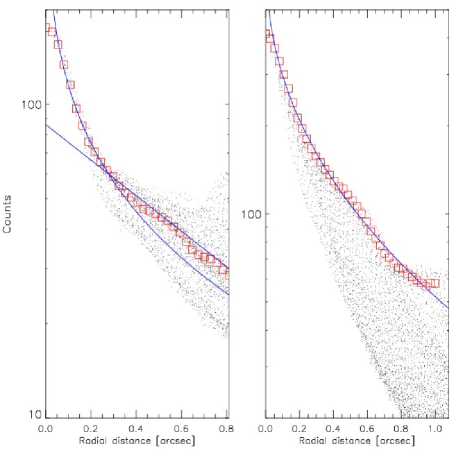
First of all, we do not find point-source components from the central parts of the galaxy system. The Heart of the Bird, the apparent barred spiral galaxy, is a combination of a de Vaucouleurs bulge component and an exponential disk. The best-fitting effective radius for the disk component is =1.2 kpc using a 1D profile along the semi-major axis (see Fig. 7), and when fit out to a distance of 1 arcsec. GALFIT turned out to be quite sensitive to the adopted ’sky’ value, i.e. in this case the value assigned to the underlying light from the tidal tails and other neighbouring components. With a realistic range of experiments, GALFIT produces a range of kpc, consistent with the simpler method. Table 3 gives the best-fitting GALFIT parameters for all components. The derived bulge-to-disk ratio with these parameters is B/T = 0.09, i.e. typical of late type spirals. The lower left panel in Fig. 6 shows the residual image after subtraction of both the bulge and disk components using GALFIT.
| Component | subcomp | Method | PA | boxiness333parameter boxy, disky | ||||
|---|---|---|---|---|---|---|---|---|
| (mag) | (kpc) | (deg) | ||||||
| Heart.. | bulge | GALFIT444The errors reflect systematic uncertainties of parameters found when using a range of fitting areas, initial values etc. Formal GALFIT errors of parameters are much smaller. | 16.30.2 | 1.30.2 | 4 | 0.90.1 | -6010 | – |
| disk | GALFIT | 13.70.2 | 1.90.4 | 1 | 0.40.1 | 75 | – | |
| disk | 1D555Formal errors are given for 1D fit parameters that were not fixed. | – | 1.260.03 | 1 | – | 12 | – | |
| Body … | bulge | GALFIT | 16.10.2 | 0.70.2 | 2.30.2 | 0.70.1 | 3310 | +0.60.1 |
| disk | GALFIT | 12.40.2 | 2.10.4 | 1.60.1 | 0.50.1 | 47 | +0.10.1 | |
| disk | 1D | – | 2.520.05 | 2.230.04 | – | 13 | – |
The Body of the Bird, a very disturbed galaxy, was more difficult to fit using GALFIT, and impossible with simple exponential and/or de Vaucoulers components. Using a 1D slice through the galaxy (Fig. 7) out to a distance of 1 arcsec, a single Sersic profile with n=2.2 and kpc is the best fit. Using GALFIT, a reasonable fit is found with two separate Sersic profiles with n=2.3 and n=1.6 for the nuclear and outer region components, respectively. Though the best fit here was again sensitive to the background value, and the index is coupled to the radius, a reasonable range of parameters resulted in kpc. The right panel of Fig. 6 shows the original surface brightness distribution, and the residual after the best-fitting subtraction, which reveals a complicated underlying appearance, with evidence for a bar-like structure extending NE-SW, and perhaps remains of spiral arms. It is also noteworthy that regardless of the other parameters, the 2D GALFIT profile for the nuclear region of the Body is always “boxy” (with the GALFIT boxyness parameter ).
3.1.3 Search for supernovae in NACO images
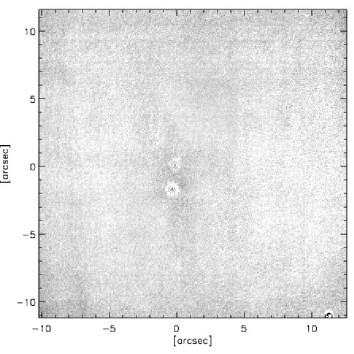
We have NACO -band images obtained at two different epochs separated by 153 days. This allows us to search for supernovae that have exploded within the nuclear regions of IRAS 19115-2124 during this period or before the first epoch image. The images were aligned, subtracted and analysed in the manner described in Mattila et al. (2007), where we detected the SN 2004ip in a similar NACO dataset of the LIRG IRAS 18293-3413. No obvious point-sources were found from the subtracted images (Fig. 8). We then estimated SN detection limits by placing simulated sources made from a real PSF of a nearby bright star in a grid of locations within the nuclear regions of the Bird prior to the image subtraction. We used an aperture radius of 0.15 arcsec and a sky annulus between 0.20 and 0.30 arcsec for measuring both the noise and the simulated sources in the subtracted images. This yielded as the 3 limiting magnitude for the nuclear SN detection within the Head. Within the Body, where larger image subtraction residuals were seen, we obtain a 3 limiting magnitude of . However, within the innermost 0.3 arcsec (or 300 pc) diameter of the Body the SN detection is more difficult and a SN of mag would remain undetected in our NACO images.
3.1.4 Super star cluster candidates
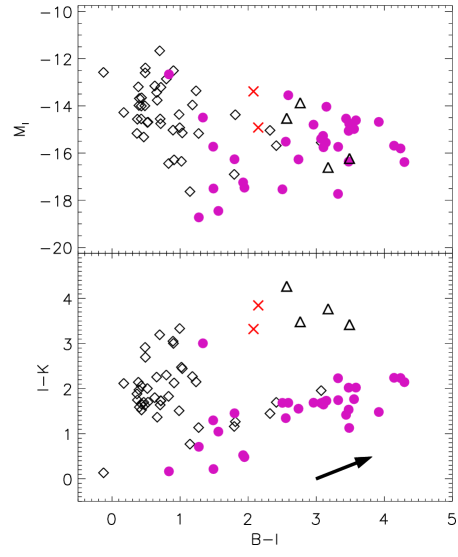
To create a list of SSC candidates we searched for all point-sources in the ACS images within the NACO image FOV – 83 were found – and aperture photometry was performed in 0.2 arcsec radii apertures and the background measured in the surrounding 0.1 arcsec sky annuli. Aperture corrections for each ACS image were applied (Sirianni et al., 2005), and Galactic extinction was corrected for. Identical apertures were then used on the NACO image, and 78 of the 83 point-sources were detected, 2 of them marginally (cross points in Figure 9). Aperture corrections of 0.84 mag were applied, determined from brighter isolated point-sources in the field; scatter is of the order 0.1 mag, and a small dependance on the distance to the WFS reference star was ignored, since it is smaller than the scatter.
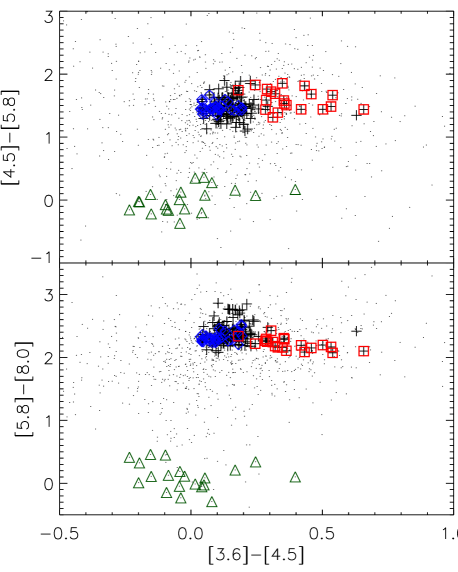
Figure 9 shows plots of the SSC candidates, the different symbols differentiate between point-sources inside the Bird system, (45 of them, open diamonds), and those outside the system (31, filled circles). The largest single concentration of these point-sources is along the W and NW Wings. The number density of the measured sources inside and outside of the galaxy was compared to the number density of point sources (foreground stars) in the ACS images outside the NACO FOV. From this we estimate that per cent of the SSC candidates inside the Bird and per cent of those outside the system are foreground stars. Therefore, the colour-colour diagram (Fig. 9, lower panel) appears to nicely separate the SSCs from the foregound stars. A handful of points have very red and colours; these are all within the core regions of the Head and Heart. We note that based on Fig. 9 the luminosity function of the SSC candidates appears to be brighter by at least a magnitude than e.g. in the local luminous interacting galaxy prototype Antennae (Anders et al., 2007). However, we defer more detailed discussion on SSC candidates in the Bird to a separate work.
3.1.5 MIR emission
Figure 4 shows the Bird -band data overlaid with Spitzer IRAC and 24 m MIPS contours. The 3.6 m data closely matches the -band, but the longer the wavelength, the more of the relative flux comes from the northernmost Head component, the irregular galaxy with numerous H II/SSC regions. We also used the 3.6 m band map to extrapolate an approximate stellar contribution in the other IRAC bands by simply assuming a Vega-like stellar spectrum (see e.g. Pahre et al., 2004). The stellar light subtracted 5.8 and 8.0 m maps do not differ appreciably from the non-subtracted ones, which is not surprising since these are expected to be dominated by non-stellar emission everywhere. The stellar-subtracted 4.5 m image, however, clearly reveals the Head to be the major source of non-stellar MIR flux.
MIR colours are examined in more detail in Figure 10, where all IRAC pixels in a 22 by 22 arcmin area around the Bird are plotted. Pixels at the locations of two field stars are located close to zero-colours as expected. Most colours of the interacting system are close to those expected from late type spiral and irregular galaxies, e.g. [3.6]-[4.5]0.1 and [4.5]-[5.8]1.5 (Davoodi et al., 2006; Smith et al, 2007). There are two significant exceptions, however. All colours with the 8.0 m IRAC band are very red, indicating stronger than normal spiral galaxy PAH emission contribution in that band. Secondly, the Head (red squares) has very red colours in [3.6]-[4.5] and [3.6]-[5.8], more typical of e.g. Seyfert nuclei. This must be a result of warm to hot dust in the irregular galaxy, which can in principle be heated either by very strong star formation, or AGN activity. We investigate spectral evidence for AGN further in Section 3.2.1.
3.2 Analysis of spectra
3.2.1 Physical characteristics from emission lines
Several warm gas emission lines are readily detected in the SALT/RSS spectra, as seen for example in Fig. 2. Table 4 summarizes the optical line ratios available from our data for the different parts of the Bird, gathered from all three slit positions, and calculated using multi-component fitting with the IRAF task splot. The line ratios are not corrected for stellar absorption; with typical EW Å (see below) we expect the correction to be not significant. All areas have uniform ratios, in the range [N II]6583/H and [S II]6716,6731/H both suggesting H II type regions (Veilleux & Osterbrock, 1987). The only notable exceptions are the nuclear region of the Heart, and the deblended blue wing from the Heart: while the nucleus has even more solid H II type ratios than the average, the blueshifted emission from the Heart has an elevated [N II] level with the ratio to H at (similar to other deblended blue-shifted components as well, which are not tabulated). This is close to the H II vs. AGN separation line; but instead of photoionization by an AGN, it may well indicate shock-heating mechanisms contaminating the normal ratios expected from H II regions.
The strongest equivalent width of H in the main components is detected in the Tail, where EW Å. The next highest are in the Head and Heart. The whole measured range is typical of H II type (U)LIRGs (Veilleux et al., 1995). The strongest individual star formation knots falling within our slits also result in EW Å values (such as a blue double-knot in the W-wing 8 arcsec West of the Heart nucleus). The EW values imply ages of 6 to 7 Myr for stellar populations involved, with an instantaneous burst, and depending on metallicity (Monreal-Ibero et al., 2007).
A rough averaged metallicity estimate can be obtained using the N2 = [N II]6584/H ratio: from relations in Denicolo, Terlevich & Terlevich (2002) we get 12+log(O/H) where uncertainties both in the ratio and the method are included. The metallicity would be 8.75 for the lowest detected ratio at the deblended nuclear component of the Heart.
The R[SII] = [S II]6716/[S II]6731 ratio ranges between R throughout the Bird, which correspond to electron densities from n 500 cm-3 to less than 10 cm-3. Apertures within the Heart and Body show the highest densities of cm-3, while all the other Bird components appear to have n cm-3 .
From the IRS mid-IR spectrum (Fig. 5) we measure a line ratio of [Ne III]15.5/[Ne II]12.8=0.10, which is typical of low to medium excitation starbursts, and corresponds to effective stellar temperatures of K in H II regions (Giveon et al., 2002). The IRS spectrum is examined in more detail in Section 4.3.
| Component | subcomp | 666Approximate extent of component in the NACO image, not formal | 777Heliocentric line-of-sight velocity; error includes formal error and the spread of velocities derived from different lines | 888Half of peak-to-peak velocity from rotational curves of one-component fits, not corrected for inclination effects | 999Velocity dispersion, corrected for instrumental resolution and redshift | [N II]/H101010From [N II]6583, not corrected for reddening, uncertainties approximately 0.03 | [S II]/H111111From [S II]6716+6731, not corrected for reddening, uncertainties approximately 0.03 | EW(H)121212Uncertainties approximately 3 Å |
|---|---|---|---|---|---|---|---|---|
| (kpc) | (km s-1) | (km s-1) | (km s-1) | (Å) | ||||
| Heart… | total131313Wide aperture, unblended multiple components | 4 | 1452020 | 1856141414The deblended adopted rotational velocity from this aperture is 157 km s-1. See text. | 1297 | 0.43 | 0.35 | 51 |
| nuclear151515Deblended component | 0.5 | 145769161616Adopted systemic velocity of the Bird | … | 769 | 0.32 | 0.28 | 35 | |
| blue wing171717Deblended blue component of the nuclear aperture | … | 1436223 | … | … | 0.56 | 0.39 | 19 | |
| W-disk181818Separate aperture West of the nucleus | 1.5 | 1436212 | … | 906 | 0.44 | 0.41 | 37 | |
| E-disk191919Separate aperture East of the nucleus | 1.5 | 147016 | … | 525 | 0.42 | 0.42 | 39 | |
| Body | 3 | 1459040 | 754 | 13416 | 0.42 | 0.32 | 42 | |
| Head | 2.5 | 1494030 | 405 | 938 | 0.47 | 0.45 | 69 | |
| Tail | 6 | 144677 | … | … | 0.41 | 0.40 | 97 | |
| E-wing | 8 | 148176 | … | … | 0.45 | 0.40 | 28 | |
| NW-wing | 16 | 141756 | … | … | 0.44 | 0.45 | 27 | |
| W-wing | 3 | 143376 | … | … | 0.38 | 0.34 | 63 |
3.2.2 Velocities of major components
As seen from the RSS 2D spectra (Fig. 3) the velocity structure of the Bird is quite complex, and we used multi-component fitting to derive line ratios (above) and accurate velocities and dynamics (next and later sections). However, we found it useful to also simply fit a single-component gaussian to the H lines along all the three slits for general characteristics of the primary components. The resulting velocity curves, each point representing a single pixel row, are shown in the bottom panels of Fig. 11, where the main structural components are also indicated. The results are unchanged, though more inaccurate, if the weaker [N II], [S II], or [O I] lines are used.
The Body and the Tail of the system join together smoothly in velocity space, while the Head is clearly a separate component from the rest. The Heart, the smaller spiral, is the only component that shows a clear rotational structure with peak-to-peak velocity of approximately 370 km s-1, while any rotational velocity of the other components is km s-1 from our slit orientations. The velocity of the W Wing appears to join well the arms of the small spiral, but there is a jump of 100 km s-1 from the arms on the other side to the E wing.

A general picture emerges from these spectral profiles, where the Head is moving away from us with the highest radial velocity of 14 940 km s-1, i.e. km s-1 with respect to the systemic velocity (see below), and the E Wing has the second highest relative velocity of km s-1. The NW Wing, in contrast, is turning our way with a high relative velocity of km s-1. The Tail has an average of km s-1 offset with respect to the systemic velocity, while the Body appears to be very close to the systemic velocity.
Velocities of the different components have an excellent match with those of Mirabel et al. (1990), whose CO() based values show three distinct components at 14400–14550 km s-1, 14600–14800 km s-1, and 14850–15000 km s-1, corresponding to our Tail, Heart, and Head, respectively. Moreover, their fourth, weaker and narrow component at 14200 km s-1 agrees exactly with our derived velocity for the NW wing of te Bird (see Fig. 12).

We also plot the velocity dispersions (middle panels of Fig.11) extracted from the one-component fits along the slits. The Wings and the Head are kinematically cold, while the Heart and Body nuclei have quite high values (we return to velocity dispersions for the purpose of mass estimates in Section 3.4). Note also that the strength of the H line emission (top panels of Fig. 11) does not always exactly correspond to the position of the maximum velocity dispersion. The velocity dispersion peak does, however, match well the position of the peak continuum emission along the slit, which is chosen as the zero-point of the x-axis radial distance.
Table 4 summarizes the properties of the major components of the Bird.
3.2.3 Velocities of sub-components and the systemic velocity
The lower panel of Figure 13 shows the spectral profile of the October 22 data, at the wavelength region of H and [N II] lines, over a one-pixel (0.26 arcsec) aperture at the centre of the continuum of the observed spectrum, which we expect to correspond closely to the centre of the nucleus of the galaxy in the NIR image. A two-component gaussian is fit to the H profile, the heliocentric velocities of which are plotted in the figure. Exactly the same velocity components were fitted for the [N II] line. The plotted [N II] curves, in contrast, are not fits, but are merely one third of the strengths of fits to the [N II] line, along with the appropriate wavelength shift.
The upper panel of Figure 13 shows the 1D spectrum profile of the same slit and same location, but summed inside a wider aperture of 1.5 arcsec. Wider apertures give essentially the same result. Comparing to the NACO image (Fig. 1) it is clear that the aperture should include a significant part of disk and spiral arms, in addition to the central bulge. The main features of the H are now fitted well with three gaussian components. The central component is kept fixed at the same velocity and width as derived from the small aperture profile. A higher velocity component not present in the small aperture profile is evident, and the lower velocity component has become stronger. The same velocity components were again fitted for the [N II] line, and [N II] was treated as before.
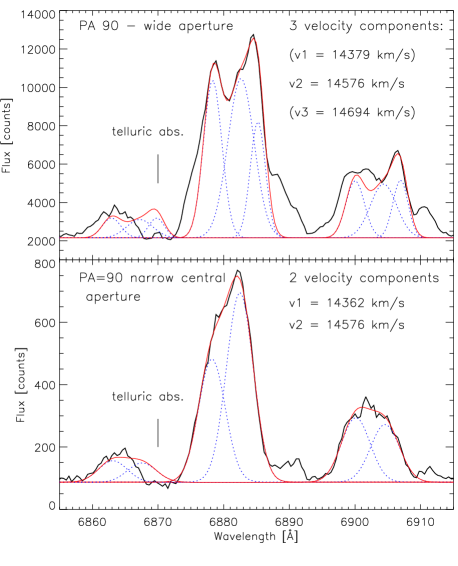
The wider aperture profile shows a typical double-horn structure of spiral galaxies, with an additional blended central component. This latter middle velocity component of km s-1 must be from the nuclear region, since it is present identically also in small apertures. The value is close to the average of the low and high velocity components, i.e. the two sides of the disk. Independent of these spectral fits, we also derive a value of approximately 14560 km s-1 for the point of symmetry in the rotation curve. Since the Heart of the Bird is the central component of the whole system, and since this velocity corresponds spatially to the -band continuum peak, we adopt this km s-1 as the systemic velocity of IRAS 19115-2124.
Note that the strongest H flux does not coincide spatially with the location of systemic velocity, i.e. the continuum peak position (see right-most panels of Fig. 11). We measure km s-1 for the deblended velocity at the strongest H location, approximately 1.0 arcsec East of the nucleus. Without the high-resolution AO image, this would have naturally been interpreted as the central velocity. Indeed, the literature systemic velocity of km s-1 (NED, Strauss et al., 1992) agrees well with this strongest H component. It should be noted, however, that none of these values agree with the NED values for individual IRAS 19115-2124 N and S components from Kim et al. (1995).
Returning to Fig. 13, upper panel, there are some additional velocity components we did not fit in the Heart central regions. In the wide aperture extraction there are two weaker structures at 14820 and 14950 km s-1 which are contamination from the Head and the E-Wing. But more significantly, the blue side of the lowest velocity (v1) component is not well fitted: the FWHM=3.1Å of this component is wider than the 2.7Å of the higher velocity arm, already implying contamination, and the fit still leaves excess emission. Moreover, the blue excess wing is present also in the small aperture profile (lower panel), i.e. in the nucleus only aperture. We interpret these effects as outflowing gas present in most apertures over the system, blue-shifted here by velocities exceeding 150 km s-1. That the blue component has an elevated [N II]6383/H ratio may be a result of contribution from shock-heating (Veilleux & Rupke, 2002; Monreal-Ibero et al., 2006).
3.2.4 Outflows detected in Na D absorption
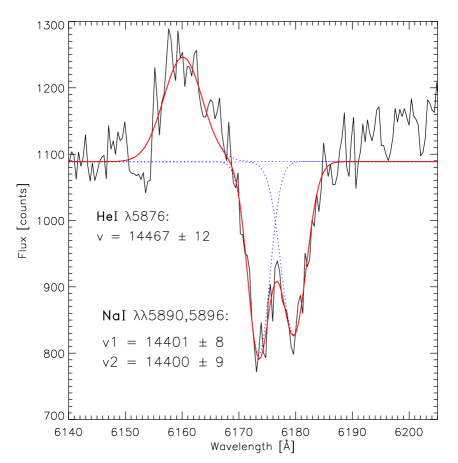
Additional evidence for the outflows come from strong Na I D (NaD) absorption doublets in the spectra, the strongest case of which is seen in the central aperture of the Heart shown in Fig. 14. In strongly star-forming systems, the NaD absorption originates partially, or mostly, from ISM, rather than being only of stellar origin, and it has often been used specifically to study outflows from star-forming galaxies and (U)LIRGs (Phillips, 1993; Sparks, Carollo & Macchetto, 1997; Heckman et al., 2000; Rupke, Veilleux & Sanders, 2002; Schwartz & Martin, 2004; Martin, 2005), and to isolate kinematics of different gaseous and stellar components within the galaxies (e.g. Arribas et al., 2007; Brosch et al., 2007).
The measured velocity of 14400 km s-1 for the doublet coincides with the blue wing of the nuclear aperture profile of the H and [N II] lines, implying an outflow velocity of the gas of approximately 180 km s-1 at this location.
Most slit positions and apertures show NaD absorption, usually blueshifted from the emission line positions. The doublet profile is not always as clear as in the case of the Heart, but rather shows a wide range of velocities, and/or the presence of a wider absorption component presumably originating from zero-velocity stellar component. Table 5 summarizes the outflow characteristics in the various components of the Bird, based on NaD. Where possible, we have also extracted the equivalent width ratio = EW(5890) / EW(5896), which is a measure of optical depth (Rupke, Veilleux & Sanders, 2002; Schwartz & Martin, 2004): for optically thin medium, while the ratio approaches unity with infinite optical depth.
Overall, the strongest outflows are related to the locations of the Heart and Head, and they are somewhat weaker over the Body. If the outflows were from the major galaxy nuclei, the Heart and Body, the implied radial velocities are in the range 100–300 km s-1. However, the velocities can be up to 600 km s-1 if some of the outflowing material originates from the Head. Any outflows at the positions of the Wings or the Tail are below our detection limits.
| Component | NaD doublet202020Offset velocity of the NaD doublet relative to the component’s velocity from emission lines. ’0’ means a zero-velocity feature, and ’–’ a non-detection. | NaD range212121Velocity range of a wider NaD absorption feature. | Optical depth222222From the = EW(5890)/EW(5896) ratio. ’–’ means the ratio can not be measured reliably. |
| (km s-1) | (km s-1) | ||
| Heart | 180 | 232323In a wider aperture than shown in Fig. 14 | thick |
| Body | – | thick | |
| Head | 300 | – | |
| Tail | 0 | – | – |
| E-Wing | 0 | 0 | thin |
| NW-Wing | 0 | 0 | – |
| W-Wing | – | – | – |
3.3 Extinction estimate and gas and dust content
Since our RSS spectra did not reach the H line, we first estimate an average extinction from the emission line strengths of IRAS 19115-2124 from Kim et al. (1995): their H/H333The value is from their North component of the galaxy, since their South component clearly suffers from a simple line misidentification., implying A, or A, which is typical of local ULIRGs. Of course, it is obvious from the optical images that extinction is highly variable over the Bird, for example the Body and southern parts of the Head are most affected by dust, but as an averaged value the above indicates significant, yet not extreme extinction. This value is consistent with a statistical value found from an empirical relation found for IR-luminous galaxies in the Spitzer First Look Survey (Choi et al., 2006): A which would give A for the Bird.
We also make an extinction estimate based on the detected NaD absorption feature – this can be done assuming it is mostly of interstellar origin, rather than stellar. Veilleux et al. (1995) show that there is a correlation between EW(Na ID) and colour excess E(B-V) for H II type (U)LIRGs (see also Sparks, Carollo & Macchetto, 1997). Taking EW(Na ID) E(B-V) and our EW(Na ID) Å from the strongest case in the Heart, gives E(B-V) 0.8, and hence A.
Broad-band colours give indications of dust reddening in specific regions. Using photometry in 500 pc radii for the Body and Heart nuclei (Table 2) and in 1 kpc radius for the brightest NIR feature in the Head, we measure , 3.8, and 3.7, respectively, and , 7.1, and 6.6. Since normal spiral galaxy colours are approximately 3.5 and 2, these colours imply A4–5, i.e. somewhat higher extinctions than from the methods above. Both the Body and Heart regions would in fact nominally be classified as Extremely Red Objects, EROs (Väisänen & Johansson, 2004).
The Spitzer data has the potential of probing the most extincted regions. Levenson et al. (2007) have calculated models that relate optical depths to IRS spectral features: the strength of the MIR silicate feature (see Fig. 5) defined as , where and are the observed flux density and the estimated continuum flux density, , implies optical depths in the range depending on the dust shell thickness and geometry. This range can be constrained by making use of the rest wavelength continuum ratio, ; the geometric models giving consistent optical depths with both indicators simultaneously are ones with very thick and nearly uniform radial density distribution ( for ), which indicate extinction at the lower end of the range, (A). Thus, the MIR spectrum extinction indicators show the Bird to be a moderately extincted source as far as (U)LIRG nuclei are concerned.
Finally, we make an estimate of the gas masses involved. Taking an optical extinction estimate of A and using a standard gas-to-dust relation of N(H)/A atoms cm-2 mag-1 (Bohlin, Savage & Drake, 1978) we get n(H) = kg cm-2, so assuming an absorption layer covering the whole system, say, a 3 by 8 kpc area, the gas mass would be . If, instead, the higher optical depth of A were used in conjunction with a 2 kpc diameter area of the 8 and 24 m emission around the Head and Heart components, we would arrive at . These are reasonable values recalling that the CO measurement of molecular hydrogen by Mirabel et al. (1990), probing the full emitting volume regardless of geometry and optical depth, gave .
3.4 Masses and dynamics
3.4.1 NIR light based mass
Before estimating the dynamical mass of IRAS 19115-2124 and its components, we use the absolute K-band magnitudes presented above in Section 3.1.1. The total integrated absolute magnitude from our NACO image is mag, or about . The individual brightnesses in 1 kpc aperture radii for the Body, Heart, and Head are , , and mag, respectively. These translate to 6.3, 4.0 and (or 0.7, 0.4, and 0.3 , and nearly 2/3 of the total Bird brightness is thus contributed from outside the 1 kpc apertures). It is commonly assumed that NIR light traces reasonably well stellar mass (though the quantitative relation is wrought with complications) – as an estimate, we use a -band mass-to-light ratio from Thronson & Greenhouse (1988), and calculate for the whole Bird system (=11.0 mag, and DL=207 Mpc). Taking , this corresponds to a mass of 2.1 in (old) stellar population in the Bird. The three individual components, within 1 kpc radii each, would range from 0.16 (Head) to 0.40 (Body), see Table 6. Since the component masses were calculated within 1 kpc radii the likely total masses would perhaps be a factor 2 larger, in accordance with the total-light derived value.
No extinction corrections were made above, making these estimates lower limits. Average extinctions over the major nuclei are in the range A, as seen above, which would mean upward mass corrections of 30 to 60 percent. However, we have not attempted a correction due to light from bright, recently-formed red supergiant populations, the continuum light of which would in contrast result in us predicting too much mass: their contributions range from nearly negligible in normal spiral galaxies to perhaps 40 per cent in localised young starburst regions (e.g. Rhoads, 1998; James & Seigar, 1999). The correction may be significant in case of the Head, where intense individual (presumably young) clusters are observed in the NIR, but it is unlikely to be very significant in the Heart and Body components. As a further potential correction, based on typical NIR spectra of ULIRGs (Murphy et al., 1999), we estimate the expected contribution from emission lines (especially Pa, Br, and H2 vibrational series) to the broad-band light to be maximally per cent, but likely much less than 5 per cent, since the strongest contamination from Pa only marginally enters the edge of the NACO filter at the Bird redshift. Taken together, it is more likely that an upward correction to mass due to extinction dominates over any downward corrections due to starbursts and emission lines from gas. Since all the corrections are somewhat uncertain, but nevertheless of similar magnitude, we prefer to keep the -band light mass estimate as is, as a lower limit, without applying the corrections. Finally, note that the mass-to-light conversion used implies values of M/L in the system: this is consistent with values expected from stellar populations in high-luminosity (isolated) spirals calculated from models that also include moderate starburst episodes (Bell & De Jong, 2001).
3.4.2 Dynamical mass
For dynamical mass estimates we follow Dasyra et al. (2006b) (see also Colina et al., 2005) and express (in units of ) as
| (1) |
where and are the line-of-sight velocity dispersion and the inclination corrected rotational velocity, both in units of km s-1, and is the effective radius in kpc. The relation assumes a virialised central region, and the constant term depends on the distribution of matter in the system: the value above assumes a King model with constant mass-to-light ratio, with tidal-to-core radius ratio of 50, which is midway between values for dwarf and giant ellipticals. Note also that the rotational velocity component effectively adds the mass of any disk to that of the bulge component estimated by the velocity dispersion term.
To get the true rotational velocity one has to correct it both for deviations of the slit orientation from the major rotational axis and inclination effects. In the following is the line-of-sight rotational velocity from our data, is the angle between the slit and the major axis of rotation and the inclination.
The only case of significant rotation seen in the three slit positions, is the Heart. The best-quality slit position PA=90 accross the Heart is aligned nearly perpendicular against the major rotation axis, in principle making the required orientation correction difficult. However, the 1.5 arcsec slit-width actually encompasses a large fraction of the disk area, which we estimate from the NACO image as approximately 2.0 arcsec across, and therefore we can estimate which fraction of the maximum rotational velocity enters the slit. Based on this geometrical assessment, we adopt an approximate value of in the above equation. We adopt km s-1 measured from the fitted blue and red velocity components in the central 1.5 by 1.5 kpc region of the Heart (Fig. 13. We thus have km s-1 as the observed rotational velocity. For an inclination estimate we use the elongation of the Heart disk, which has the ratio of the minor-to-major axes from NACO isophotes, i.e. , assuming 0.3 for the ratio of thickness and truncation radius of the disk. Thus, km s-1, which is a reasonable value for fairly massive disks. The rotational velocity would be km s-1 if only the inclination correction is applied.
Similarly, we estimate km s-1 for the Body, and km s-1 for the Head, both from the PA=192 data. For the Body , and inclination were used, whereas no corrections to the apparent observed of the Head were made due to irregularity and ambiguity of its shape.
We next measure velocity dispersions in 1.0–1.5 kpc apertures at the centers of the galaxies, corresponding to their adopted systemic velocities, with multiple component Gaussian fits to H, [N II]6583 and [S II] lines, and quadratically correct them for our instrumental resolution, and adjust for redshift (Table 6). Single component fit results, which may be contaminated by gas outflows, are also tabulated. The Heart and Body velocity dispersions come out to be km s-1 and km s-1, respectively, which can be considered as definite lower limits for velocity dispersion.
Now, with the values of rotational velocities and velocity dispersions at hand, we may estimate the masses using Eq. 1 (see Table 6). For the sizes we trust the fits over 1D cuts along major-axes more than the GALFIT best-fitting values, which are very sensitive to e.g. choices of sky background and exact Sersic parameter. Half-light radii measured photometrically from the NACO image are typically close to the lower range of values of both the 1D cuts and GALFIT for the Body and Heart. We conservatively estimate the uncertainties to be at about 30 per cent level. In the case of the Head, the irregular morphology prohibits a formal fit, and the value tabulated is an estimate based on half-light radius from photometry.
The dynamical mass of the Heart, using Eq. 1, comes out to be 0.36 (0.50 ) using the deblended (unblended) velocity dispersion. Since this is a clear case of a spiral galaxy, we also tabulate the mass obtained directly from a simple Newtonian system enclosing a mass inside 3 kpc radius and rotating at 261 km s-1. This estimate gives a lower limit of 0.32 for the Heart system, with the caveat that some part of the adopted may be tidal rather than orbital motion. The dynamical mass estimate of the Body is 0.27 (0.50 ). This system is dynamically hot – ignoring the rotational component does not appreciably change the mass estimate. Finally, the corresponding dynamical mass for the Head is 0.08 .
The mass ratio of the three main components of the Bird thus becomes 4.5:3:1 (6:6:1) for Heart:Body:Head when the deblended (unblended) velocity dispersions are used. If the rotational velocity estimate only is used for the Heart, the ratio is 4:3:1, and when -band light based estimate is used, the ratio is 1.5:2.5:1. This last ratio is the only one measured within identical radii. Every option nevertheless implies two close to equal major merger components, and a third component in the range 20 to 40 per cent in mass of the more massive ones.
| Component | note | 242424We estimate the systematic uncertainty to be per cent in the adopted effective radii. | 252525NIR light measured in 1 kpc radius, see text for M/L ratio, which also dominates uncertainty. | 262626Uncertainty is per cent, dominated by the uncertainty in | ||||
|---|---|---|---|---|---|---|---|---|
| (mag) | (kpc) | (km s-1) | (km s-1) | |||||
| Heart | 272727Deblended velocity dispersion | “ | “ | “ | 769 | 3.4 | 0.25 | 0.36 |
| … | 282828Single component velocity dispersion | -23.160.07 | 1.26 | 26135 | 1297 | 2.0 | 0.25 | 0.50 |
| … | 292929Using Keplerian rotation at 3 kpc | “ | 3.0 | 26135 | – | – | 0.25 | 0.32 |
| Body | d | “ | “ | “ | 9410 | 0.8 | 0.40 | 0.27 |
| e | -23.690.07 | 2.52 | 757 | 13416 | 0.6 | 0.40 | 0.50 | |
| Head | -22.710.07 | 0.84 | 405 | 938 | 0.4 | 0.16 | 0.08 |
4 Discussion
4.1 Dynamics and kinematics
4.1.1 Reliability
Can masses determined from velocity dispersions and rotational velocities calculated from optical emission lines be trusted for dynamical mass estimates? The answer depends very much on how closely the velocities and structures of warm ionized gas are coupled to the stellar stuctures and velocities. From the outset, there is no reason to expect closely matching correlations since the optical emission lines trace regions well outside the more extincted nuclei and since the very clumpy and disturbed nature of nuclear regions in (U)LIRGs make correspondences highly complicated.
Recently Colina et al. (2005) presented a detailed study of a sample of 11 ULIRGs with angular resolutions of approximately 1 kpc throughout, and covering a range of ULIRG types, utilizing optical integral field spectroscopy (tracing the gas distribution with H light), medium-resolution Keck and VLT near-IR spectroscopy (tracing stellar light with CO absorption bands), and millimetre CO observations (tracing the cold gas structures). They find, as expected, that in general over a few kpc the ionized gas has a complex velocity structure, with the peak-to-peak velocity differences, and often also velocity dispersions, dominated by tidal tails and tidally induced flows, rather than rotational systems (though they do find ionized gas matching stellar velocities much more accurately than the molecular gas). However, they also show that the central warm gas velocity dispersion correlates well with the stellar velocity dispersion (they find a ratio of ) and conclude that the central ionized gas velocity dispersion is, in fact, a robust tracer of dynamical mass of these systems, provided the emission lines in question can be spatially associated with the true nuclei identifiable virtually only by high-resolution near-IR imaging. We also note that Rupke, Veilleux & Sanders (2002) found a good correlation between the widths of emission lines, the Ca II triplet widths, and of the absolute K-band brightness of their sample of ULIRGs.
During this study we have seen exactly the problems posed in the Colina et al. (2005) work – without the extremely high quality near-IR imaging it would have been impossible to determine which features in the optical spectra correspond to nuclear and surrounding locations. For example, we are now able to tie the systemic velocity to the nucleus of a major component, rather than a bright off-centre H II region where the literature value seems to have originated from. We have furthermore been very conservative in deblending velocity structures in spectral profiles within the NIR AO-determined nuclear regions to account for outflows and thus avoided over-estimating masses by factors of 2–4 because of them.
We thus conclude that the optical spectroscopic method of defining kinematics and dynamics of the Bird system, in conjunction with NIR AO imaging, should be robust and reflect true dynamical masses within observational errors.
4.1.2 Tully-Fisher relation
The Heart spiral galaxy has an absolute brightness of and its rotation velocity is km s-1. Placing these values into a -band Tully-Fisher relation diagram (Conselice et al., 2005), we see that it lies well inside the expected 3 region of normal disk galaxies, on the fainter and/or faster rotation side of the relation; the small offset might be partially explained by under-estimated brightness due to extinction, or perhaps by dynamical effects due to the on-going interaction.
4.1.3 The Fundamental plane
Averaged within the respective half-light radii of the Heart (1.2 kpc) and Body (2.5 kpc) components, we calculate -band surface brightnesses of 14.8 mag arcsec-2 and 15.8 mag arcsec-2. Positioning these on the Fundamental plane of elliptical galaxies, we find them both to occupy typical regions of (U)LIRGs (Genzel et al., 2001; Dasyra et al., 2006b), i.e. well within the scatter of the relation over different types of objects, but typically 1–2 mag brighter than ordinary hot E/S0 galaxies. That our nuclei, together with other (U)LIRGs, occupy regions relatively close to the Fundamental plane is commonly interpreted as evidence that these objects are ellipticals in formation.
4.1.4 Escape velocities
Following Rupke, Veilleux & Sanders (2002) we define an escape velocity at radius for a singular isothermal sphere truncated at as
where is the rotation speed of an object in orbit. The escape velocity is not very sensitive to the choice of , though this ratio is likely to be large () since the dark matter halo extends far from the optically observable galaxy. Choosing and using km s-1 (Heart rotation) as the extreme case, we get km s-1. If the radial velocities of the components are close to the true relative velocities, it would be unlikely that any significant fraction of the outflow material or sub-systems are escaping into the intergalactic medium. The 350–400 km s-1 relative radial velocity offsets of the Head and the NW Wing are, however, sufficiently close to the that it is difficult to say whether they are truly bound or not. If one considered only the velocity dispersions in the two nuclei, which are at most km s-1, the escape velocity would be km s-1 meaning that the Head, Wings, and much of the outflows would be heading out of the system based on radial velocities only.
4.2 Classifying the Bird sub-systems
4.2.1 Differentiating nuclei from star clusters
The Bird consists of two massive components, one still a clear spiral, and the other a disturbed disk/bulge system, of two tidal tails/wings, and an ’extra’, but rather massive, irregular component with many individual bright star-forming regions.
Though there have been reports of a significant fraction of (U)LIRGS being mergers of multiple components (Borne et al., 2000; Cui et al., 2001), most surveys tend to agree that they usually are interactions and mergers of two galaxies, with the incidence of multiple mergers less than 5 per cent (Veilleux et al, 2002; Bushouse et al., 2002). The complicating factor, acknowledged in all (U)LIRG studies, is that any studies made in the optical regime, even at I-band, suffer from very complex extinction effects making photometric or morphological identification of nuclei difficult. In the case of the Bird, if only the -band were considered, we would have 6 bright clumps (measured in 600 pc diameter radii) of mag, which was selected as the cut-off between legitimate nuclei and giant star-forming regions in Cui et al. (e.g. 2001). Only our NACO image reveals that three of those clumps are in fact the nucleus and two spiral arms of the same galaxy, and one of the clumps is a bright knot within the tail of the Bird, clearly a minor feature in the system.
4.2.2 The nature of the Head of the Bird
It is the more irregular feature, the Head of the Bird, which we are now concerned with. Is it a legitimate nucleus, a remnant of a pre-existing galaxy, or merely a collection of star clusters, formed out of the material of the other two main components during the interaction, for example a tidal dwarf galaxy (TDG)?
It is clear that the differences in brightness are not that large between the three components. In the B-band and I-band, the Head is in fact the brightest single feature in the whole interacting system. Even in the -band, which more closely follows the underlying mass, the Head is only 1 mag fainter than the brightest component of the whole system. The dynamically derived mass for the Head ranges from one-third to one-sixth of the most massive component, depending on the method used. The CO-line measurements of Mirabel et al. (1990) indicate an H2 mass for the Head of not less than half of the most massive H2 component (Fig. 12). Finally, even the brighest NIR knot alone, which is totally obscured in the -band image, has and , making it very close to the e.g. the Cui et al. (2001) criterion for individual nuclei.
Furthermore, the Head is kinematically totally separate from the Heart and Body structures, with a difference in velocity nearly 400 km s-1 (see Fig. 11). It also has evidence of rotation, suggesting a self-gravitating body. The appearance of the optical morphology is that of two gas rich disks colliding almost perpendicularly, with the NIR image revealing the Heart nucleus to be likely associated with the horizontal disk component (the Wings) and the Body nucleus being more likely associated with the vertical structure comprising also the Tail – and potentially the Head. However, given the clearly discrepant velocity (and the significant stellar mass of the Head), it is difficult to imagine the Head being material merely ripped off a galaxy that originally had the Body component as its nucleus, and that component remaining such a conspicuous single nucleus.
In fact, the optical images show a large obscuring dust region crossing perpendicularly the E-Wing, and also extending some 6 kpc to the E and NE of the Head. This structure looks as if it could be separate from the two major horizontal and vertical components; and if this is true, it could be material from the same structure as the stellar component associated with the Head. The gas velocity ( km s-1) of this structure can be traced 4 kpc North out of the main Head area in NIR (PA=192; Fig 11) and together with the velocity at the eastern tip of the E-Wing ( km s-1), suggest a common kinematic origin with the Head ( km s-1).
Though the final answer warrants detailed dynamical merger simulations out of the scope of this paper, we propose that the data presented here strongly suggests a near-ULIRG merger of three pre-existing major components. The Bird would be, to our knowledge, the most-detailed studied case thus far. For a possible triple merger case of a lower luminosty LIRG see Lípari et al. (2000).
4.3 AGN contribution and star formation rate
We discuss next whether there is a possibility of an AGN contribution to the overall luminosity of the Bird, based on both optical and MIR considerations. First of all, there are no broad lines anywhere in the optical RSS spectra, nor do the line ratios suggest clear AGN activity. Some line ratios close to the H II vs. LINER dividing region come from areas associated with outflows, and thus may be attributed to shock-heating. On the other hand, while most IRAC mid-IR colours of the Bird are those of normal spiral galaxies, along with strong PAH emission expected in starbursts contributing to the 8 m band, the Head is redder than the other components in all IRAC colours, suggesting a hotter dust contribution.
To differentiate between AGN and starburst origin, we examine the IRS spectrum. Following Sturm et al. (2002); Verma et al. (2003); Farrah et al. (2007) we calculate diagnostic line ratios: [Ne III]/[Ne II] , [S IV]/[S III] (the [S IV] line is totally within the wide silicate absorption feature), and [O IV]/[Ne II] (the [O IV] line is a rather marginal detection). The Neon line ratio by itself, and also together with the Sulphur line ratio, indicates a medium excitation starburst. The marginal detection of [O IV] raises the possibility of some AGN contribution, but the [O IV]/[Ne II] ratio restricts this to definitely less than 5 per cent. In addition to the fine structure recombination line ratios, the strengths of the 6.2 m PAH feature and the 9.7 m silicate absorption feature () place the Bird firmly in the starburst dominated ULIRG section of diagnostic diagrams in Spoon et al. (2007) and Farrah et al. (2007).
Thus, if there is any AGN contribution from the Head (and this would perhaps be the more unlikely location considering the other two nuclei are more massive) it is negligible compared to the total IR output of the Bird.
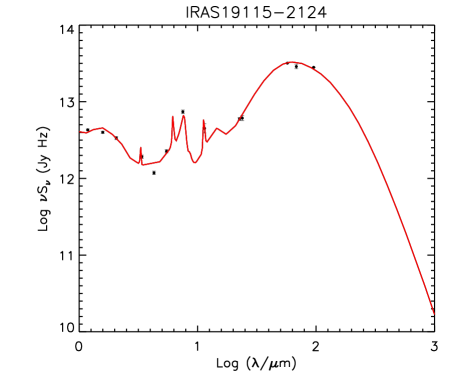
We next estimate the star formation rate using the IR data available. First, we have fitted models (, 2000, 2003) to the full IR SED of the Bird, from NIR NACO and 2MASS data, to the FIR IRS, MIPS, and IRAS data. Fig. 15 shows the data points and the SED model fit overplotted: the best-fitting model, a pure starburst, assumes an underlying exponentially decaying SFR with a burst in the last years. The SFR at the peak of the burst was about 400 or 188 when averaged over the last years.
Second, we utilize a newly calibrated relation between star formation rate and the PAH 6.2+11.2 m luminosities , based on correlations of these PAH features with total IR luminosity (Farrah et al., 2007):
where is the PAH 6.2+11.2 m luminosity in ergs s-1. From the IRS spectrum (Fig. 5) we calculate , i.e. we get a star formation rate of , in very good agreement with the SED modelling. For reference, we calculate a rate of from the traditional Kennicutt (1998) relation of using the total IR luminosity of the Bird.
4.4 Supernova rate
Assuming core-collapse SN progenitors between 8 and 50 M⊙ and a Salpeter initial mass function (IMF) with cut-offs at 0.1 and 125 M⊙ (see e.g. Mattila & Meikle, 2001), we can estimate the core-collapse SN rate of IRAS 19115-2124. Adopting the average SFR of 190 M⊙yr-1 as obtained above, yields a core-collapse SN rate of about 1.3 yr-1. Comparison of our NACO -band images separated by 153 days did not reveal any new sources within the galaxy nuclear regions (see Section 3.1.3) down to limiting magnitudes of . We compared these with template -band light curves of ordinary (based on 11 type II and Ib/c SNe) and slowly-declining core-collapse SNe (based on the type IIL SN 1979C and the type IIn SN 1998S) from Mattila & Meikle (2001). Assuming the Galactic extinction law (Rieke & Lebofski, 1985) we find that any slow decliner, suffering from an extinction of up to A, should have been detected if exploding between the epochs of the two images or less than a year before the first epoch image. However, in the case of ordinary core-collapse SNe and the same extinction, a detection would have been possible only near maximum light. If the extinction was considerably lower, AV 5, we would have detected also ordinary events anytime between the epochs of the two images or up to 5 months before the first epoch image.
Given the estimated core-collapse SN rate of 1.3 yr-1 we estimate a Poissonian probability of 16 per cent for a SN non-detection assuming that all the core-collapse SNe within the nuclear regions of the Bird were slowly-declining and suffered from extinctions of less than AV = 30. Recent observations of luminous radio SNe within nuclear regions of nearby (U)LIRGs (Colina et al., 2001; Lonsdale et al., 2006; Alberdi et al., 2006; Parra et al., 2007; Perez-Torres et al., 2007) show that these events have exploded within a dense circumstellar/interstellar environment. Therefore, a high rate of slowly-declining (in NIR) SNe might be expected in such environments. However, if most of the SNe within LIRGs behave similarly to SNe observed outside nuclear starburst regions, the fact that no SNe were detected is not surprising, since we were sensitive to ordinary core-collapse SNe with high extinctions only near the epoch of maximum light.
4.5 Evolution of the Bird as a merger
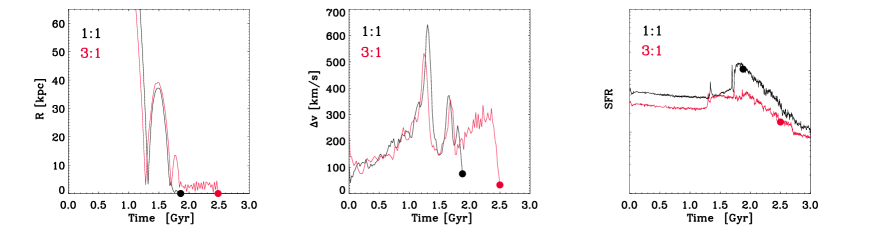
We next discuss possible evolutionary sequences of the Bird system aided by numerical merger simulations. Detailed dynamical modelling of a given observed galaxy merger is very time consuming as a large parameter-space of initial orientations and orbital configurations needs to be probed (e.g. Wahde & Donner, 2001; Naab & Burkert, 2003; Barnes, 2004; Naab, Jesseit & Burkert, 2006). Thus we here instead adopt an approach in which we model a typical 1:1 and a 3:1 galaxy merger in order to study the general predictions from merger simulations.
The initial galaxy models are Milky Way-like galaxies with a disk mass of and a 20 per cent initial gas fraction, the bulge mass fraction is set to a third of the disk mass fraction and the galaxy is embedded in a dark matter halo with total virial mass of (see Johansson et al. 2007 in prep, Springel, Di Matteo & Hernquist (2005) for details). For the 3:1 merger the corresponding masses for the minor component are a third smaller than the values given above. The galaxies merge on a parabolic orbit with an initial separation of and with a pericentric distance of . The mergers are simulated with the paralell TreeSPH-code GADGET-2 (Springel, 2005) and the simulations follow self-consistently the dark matter and gas dynamics, radiative gas cooling, star formation, as well black hole growth and the associated feedback processes (Johansson et al. 2007 in prep., Springel, Di Matteo & Hernquist, 2005). Fig. 16 shows the resulting nuclear separations, relative velocities and corresponding total relative star formation rates of the two mergers as a function of time.
Turning to our imaging data, the overall morphological appearance of the Bird, with multiple identifiable nuclei within a few kpc, and very obvious tidal tails, classifies it as a close ’pre-merger’, i.e. a system after first approach and contact (when the tidal tails typically are generated), but before a full merger, when nuclei are fully coalesced (see e.g. Veilleux et al, 2002). As for the individual nuclei, the NIR light in the inner regions of the Heart show a surprisingly intact structure with bulge and disk components, and regular appearing barred spiral arms extending from the inner 300 pc out to some 2 kpc. The tidal Wings beyond this region, however, break the regularity. Its rotation velocity vs. velocity dispersion ratio is in the range , i.e. a clear rotationally supported disk system. The nucleus of the Body, in contrast, shows a much more disturbed morphology, with a surface brightness profile intermediate to that of disk and spheroidal systems. There is clear evidence of disturbed spiral arm and/or bar structure within the central 1.3 kpc. It thus seems that the Body has thus far suffered more in the on-going merger, and looks to be already morphing towards a de Vaucouleurs stellar light distribution. The ratio is , which means that while it is a pressure supported system there is also significant rotational support involved. The ratio appears to be a typical value in (U)LIRG samples (e.g. Colina et al., 2005; Dasyra et al., 2006a), and the end result of the Bird merger will not be a slowly rotating massive elliptical, which are thought to be products of higher redshift galaxy formation (e.g. Naab et al., 2007).
The relative (radial) velocity between the Heart and the Body was found to be very small, of the order of 50 km s-1, while the Head has a large positive velocity offset 400 km s-1 from the other two. Since also the strongest star formation is from the Head (see next section), a possible scenario is raised in which the Head is a foreground object falling into, or just passing, the Body/Heart system. Comparing to Fig. 16 we see that relative velocities in excess of 400 km s-1 are possible for both 1:1 and 3:1 mergers; the Body/Heart:Head system would more closely resemble a 3:1 merger. The peak in the relative velocity is associated with the first passage of the galaxies, which also produces a clearly defined peak in the relative star formation rate at the same time of (we did not attempt to model the level of SFR here, merely the pattern as a function of time). It is thus possible that the star formation of the whole system is dominated by the first triggering of star formation in the Head component, while the other nuclei are further into the merger and in between starburst phases. The locations of the bright NIR star clusters within the very extincted regions of the Head, at the edge closest to the other components, might be an indication of just such infall of the component through the tidal ISM. One of the weak points of this scenario is the strikingly normal appearance of the Heart nucleus. However, given that the Head is lower in mass by at least a factor of three than the Heart, it is plausible that the Head is experiencing stronger tidal effects compared to the Heart, leaving it more or less undisturbed.
Using the masses for individual components from Section 3.4, the minimum mass for the end result, derived from dynamics, would correspond to a galaxy; total system mass from M/L relations is of the order . The end result masses are quite high, though not exceptional. Numerous studies (e.g. Genzel et al., 2001; Colina et al., 2005; Dasyra et al., 2006b; Hinz & Rieke, 2006) indicate the end products of gas-rich spiral mergers, seen as LIRGs and ULIRGs, will be intermediate mass sub- ellipticals. The IRAS 19115-2124 system is thus towards the high end of masses of local IR bright systems, but nevertheless still well below the classification of a giant elliptical .
Finally, there are numerous bright concentrations within the Bird, and we have not studied them in detail in this work. We note, however, that many of them might be candidates for being, or becoming, tidal dwarf galaxies. As an example the blue concentration within the Tail, 3.5 arcsec South of the Body, is compact, distant, and massive (from NIR light) enough to satisfy the survival criteria for tidal dwarfs (Monreal-Ibero et al., 2007; Wetzstein, Naab, & Burkert, 2007).
4.5.1 Evolution of the Bird as a LIRG
As far as the (U)LIRG phenomenon is concerned, the accummulated wisdom indicates that the source of the huge IR luminosity comes from either AGN or nuclear star formation, or both, and in the case of the Bird we have shown that the star formation ovewhelmingly dominates. For both cases the idea is that the central engine is fed by infalling gas from the gas-rich progenitor disks, and that this infall is greatly facilitated by bars (see e.g. Mihos & Hernquist, 1996; Di Matteo et al., 2007, and references).
Somewhat surprisingly, however, the majority of MIR output of the Bird system is not coming from either the major NIR bright galaxy nucleus (Body) with its embedded bar-like structure, or from the barred spiral nucleus (Heart). The IRAC and MIPS imaging clearly indicate that the Head is the source of the bulk of MIR flux, with secondary contribution from the Heart, while the contribution from the Body is negligible.
The reason for non-conspicuous star formation in the major nuclei is not the dearth of fuel for star formation; the CO observations clearly show that there is an ample reservoir of molecular hydrogen in all of the major components (Fig. 12). This would indicate that none of the nuclei have yet experienced the second, or later, star formation peaks expected from merging models (see Fig 16).
There are recent reports of major off-nuclear and disk (rather than centrally concentrated) star formation in interacting galaxies, (Lípari et al., 2000; Wang et al., 2004; Jarrett et al., 2006), and even cases of non-enhanced or very moderate star formation connected with interactions (e.g. Bergvall, Laurikainen & Aalto, 2003; Cullen et al., 2007). These studies highlight the fact that the triggering mechanism of star formation in interactions is still far from understood. All these cases are, however, in lower luminosity systems. The Bird is thus quite unique in the sense that it is so close to being classified as an ULIRG, and still is not dominated by a central starburst in the major components. Or, if the Head component were to be considered as a major nuclear location, the starburst is not associated with those gas-rich locations with bar structures.
That strong star formation is present in the Head need not, of course, be surprising in itself; as discussed above, we may be witnessing the Head interaction during its first passage by the two other nuclei that are further along their merging sequence. It is the timing which is more unique – ULIRGs are typically observed in later stages of interactions, and first passage starburst moments with associated large relative velocities are rarely seen (Murphy et al., 2001).
In summary, the existence of large gas reservoirs and connected bar structures in merging disk galaxies do not automatically imply a central star-burst in that location. On the other hand, general merger modelling does predict epochs of lower SFR in between more intense episodes. In the case of the Bird it seems that the more massive nuclei are in such a phase, while the least massive component is caught virtually in the act of first high-speed fly-by. It would be very interesting to investigate further what are the factors inhibiting the (U)LIRG phase in the Body nucleus, for example, or why exactly it has switched off.
5 Summary of results and conclusions
We have studied in detail the spectacular luminous infrared galaxy IRAS 19115-2124, which we have dubbed the Bird. Using near-diffraction limited adaptive optics imaging in the K-band (VLT/NACO), and matching space-based optical imaging (HST/ACS), combined with ground-based optical spectroscopy (SALT/RSS), we find the Bird to be a pre-merger of three components.
Two of the components have unambiguously identifiable galaxy nuclei. One has the quite regular composition of a barred spiral disk galaxy (Heart) while the other (Body) has a more disturbed nuclear region, with hints of both spiral/arm structure and a surface brightness profile intermediate to that of disks and ellipticals. The third component (Head) appears to be an irregular galaxy – our kinematical and dynamical data, however, strongly suggest that it is not merely a tidal dwarf borne out of the interaction of the other two, but rather a pre-existing less massive galaxy intimately involved in the interaction. The AO NIR imaging is crucial in classifying sources and nuclei due to the extremely clumpy nature of sources of this kind in the optical. In addition, we see strong tidal tails (the Wings) and numerous concentrated knots, some of which may be candidate TDGs, and find a bright luminosity function for candidate SSCs.
The combination of high-resolution imaging and spectroscopy has resulted in the refinement of the systemic velocity of this LIRG, km s-1, and we have listed the kinematics of all the components. We have also investigated the line ratios, equivalent widths, and profiles of the important emission lines and find them to show characteristics of an H II type galaxy.
We identify blueshifted Na I D absorption doublets mainly from the Heart, Head, and Body components. We interpret these to be due to gas outflows from the Bird, with velocities typically in the range km s-1, but possibly some flows ranging up to 600 km s-1. Consistently, we also identify elevated [N II]/H levels in blueshifted wings of emission lines from the nuclear components, suggesting shock-heating associated with outflows.
By utilizing Spitzer IRAC and MIPS imaging, we are able to pinpoint where the MIR flux and the non-stellar emission is originating from. The Heart and especially the Head components are the regions producing most of the MIR flux. There is a hotter dust component affecting the m bands at the location of the Head: Spitzer IRS spectroscopy is used to confirm the classification suggested by our optical spectroscopy, that this location, and the Bird system as a whole, is a star formation dominated system, with any AGN contribution below 5 per cent. The star formation is estimated to be , corresponding to a core-collapse supernova rate of 1.3 yr-1. We detected no supernovae brighter than in NIR images separated by 5 months.
We estimate averaged extinction over the system to be of the order A, while the extinction derived from MIR diagnostics of the deeply embedded nuclear system results in A. Gas masses inferred are up to a level of .
We have determined the component masses of the Bird system using rotational as well as central velocity dispersion information. We note that without the high-resolution NIR imaging it would have been very difficult to differentiate between velocity components related to nuclear bulges from those originating e.g. from H II regions in tidal regions or outflow components. Using conservative deblending of components we arrive at masses of 0.27 , 0.36 and 0.08 for the Body, Heart, and Head, respectively. Alternatively, using K-band light as a tracer, we find masses of 0.40 , 0.25 and 0.16 for the inner 1 kpc regions of the same three regions, and 2.1 for the total system.
In summary, most optical, NIR, MIR, and FIR emission characteristics, as well as kinematical and dynamical attributes place IRAS 19115-2124 among typical ULIRG samples, even though it is not technically quite a ULIRG with an IR luminosity of . The main differences are that it appears to be a three-component merger, and that its total dynamical mass is of the order of , or more, i.e. at the upper end of typical ULIRG merger remnants. Finally, we find the likely origin of the ULIRG phase engine to be the Head, the least massive of the three merger components, and the only one without signs of spiral arms and bars, which often are regarded as tell-tale signs of inflowing gas to central starburst regions. A possible sequence of events is such that the Heart and Body met first; the Body especially is already in the process of morphing into an elliptical like structure. The Head is observed during its first high-speed approach to the system, making it the strongest starburst at this time – the general characteristics of this scenario are consistent with numerical merger simulations.
Acknowledgments
SM acknowledges financial support from funds from the Participating Organisations of EURYI and the EC Sixth Framework Programme and from the Academy of Finland (project: 8120503). Some of the observations reported in this paper were obtained with the Southern African Large Telescope (SALT), a consortium consisting of the National Research Foundation of South Africa, Nicholas Copernicus Astronomical Center of the Polish Academy of Sciences, Hobby Eberly Telescope Founding Institutions, Rutgers University, Georg-August-Universität Göttingen, University of Wisconsin - Madison, Carnegie Mellon University, University of Canterbury, United Kingdom SALT Consortium, University of North Carolina - Chapel Hill, Dartmouth College, American Museum of Natural History and the Inter-University Centre for Astronomoy and Astrophysics, India. This work is based in part on observations with the NASA/ESA Hubble Space Telescope, obtained from the data archive at the Space Telescope Institute. STScI is operated by the association of Universities for Research in Astronomy, Inc. under the NASA contract NAS 5-26555, and based in part on archival data obtained with the Spitzer Space Telescope, which is operated by the Jet Propulsion Laboratory, California Institute of Technology under a contract with NASA. This research has made use of the NASA/ IPAC Infrared Science Archive, which is operated by the Jet Propulsion Laboratory, California Institute of Technology, under contract with the National Aeronautics and Space Administration, and made use of the NASA/IPAC Extragalactic Database (NED) which is operated by the Jet Propulsion Laboratory, California Institute of Technology, under contract with the National Aeronautics and Space Administration.
References
- Alberdi et al. (2006) Alberdi A., Colina L., Torrelles J.M., Panagia N., Wilson A.S., Garrington S.T., 2006, ApJ, 638, 938
- Anders et al. (2007) Anders P., Bissantz N., Boysen L., de Grijs R., Fritze-v.Alvensleben U., 2007, MNRAS, 377, 91
- Arribas et al. (2007) Arribas S., Colina L., Monreal-Ibero A., Alfonso J., García-Marín M., Alonso-Herrero A., 2007, A&A, arXiv:0710.2761
- Barnes (1990) Barnes J.E., 1990, Nat, 344, 379
- Barnes (2004) Barnes J.E., 2004, MNRAS, 350, 798
- Bell & De Jong (2001) Bell E.F., De Jong R.S., 2001, ApJ, 550, 212
- Bergvall, Laurikainen & Aalto (2003) Bergvall N., Laurikainen E., Aalto S., 2003, A&A, 405, 31
- Bertin & Arnouts (1996) Bertin E., Arnouts S., 1996, A&AS, 117, 393
- Bohlin, Savage & Drake (1978) Bohlin R.C., Savage B.D., Drake J.F., ApJ, 1978, 224, 132
- Borne et al. (2000) Borne K., Bushouse H., Lucas R.A., Colina, L., 2000, ApJ, 529, L77
- Bournaud et al. (2005) Bournaud F., Jog C.J., Combes F., 2005, A&A, 437, 69
- Brosch et al. (2007) Brosch N., et al., 2007, MNRAS, arXiv:0706.2150
- Buckley et al. (2006) Buckley D.A.H., Swart G.P., Meiring J.G., 2006, SPIE, 6267
- Burgh et al. (2003) Burgh E.B., et al., 2003, SPIE, 4841, 1463
- Bushouse et al. (2002) Bushouse H.A., et al., 2002, ApJS, 138, 1
- Chakrabarti et al. (2007) Chakrabarti S., Cox T.J., Hernquist L., Hopkins P.F., Robertson B., Di Matteo, T., 2007, ApJ, 658, 840
- Chapman et al. (2003) Chapman S.C., Windhorst R., Odewahn S., Yan H., Conselice, C., 2003, ApJ, 599, 92
- Choi et al. (2006) Choi P.I, et al., 2006, ApJ, 637, 227
- Cole et al. (2001) Cole S., Norberg P., Baugh C.M., 2001, MNRAS, 326, 255
- Colina et al. (2001) Colina L., Alberdi A., Torrelles J.M., Panagia N., Wilson A.S., 2001, ApJ, 553, L19
- Colina et al. (2005) Colina L., Arribas S., Monreal-Ibero A., 2005, ApJ, 621, 725
- Conselice et al. (2005) Conselice C., Bundy K., Ellis R.S., Brichmann J., Vogt, N.P., Phillips A.C., 2005, ApJ, 628, 160
- Coppin et al. (2006) Coppin K., et al. 2006, MNRAS, 372, 1621
- Cullen et al. (2007) Cullen H., Alexander P., Green D.A., Clemens M., Sheth K., 2007, MNRAS, 374, 1185
- Cui et al. (2001) Cui J., Xia X.-Y., Deng Z.-G., Mao S., Zou Z.-L., 2001, AJ, 122, 63
- Dasyra et al. (2006a) Dasyra K.M., et al., 2006, ApJ, 638, 745
- Dasyra et al. (2006b) Dasyra K.M., et al., 2006, ApJ, 651, 835
- Davoodi et al. (2006) Davoodi P., et al., 2006, AJ, 132, 1818
- Di Matteo et al. (2007) Di Matteo P., Combes F., Melchior A.-L., Semelin B., 2007, A&A, 468, 61
- Denicolo, Terlevich & Terlevich (2002) Denicoló G., Terlevich R., Terlevich E., 2002, MNRAS, 330, 69
- Elbaz et al. (2002) Elbaz D., Cesarsky C.J., Chanial P., Aussel H., Franceschini A., Fadda D., Chary R.R., 2002, A&A, 384, 848
- (32) Efstathiou A., Rowan-Robinson M., Siebenmorgen R., 2000, MNRAS, 313, 734
- (33) Efstathiou A., Rowan-Robinson M., 2003, MNRAS, 343, 322
- Farrah et al (2001) Farrah D., et al, 2001, MNRAS, 326, 1333
- Farrah et al. (2002a) Farrah D., Verma A., Oliver S., Rowan-Robinson M., McMahon R., 2002a, MNRAS, 329, 605
- Farrah et al. (2002b) Farrah D., Serjeant S., Efstathiou A., Rowan-Robinson M., Verma A., 2002b, MNRAS, 335, 1163
- Farrah et al. (2007) Farrah D., et al., 2007, ApJ, in press (astro-ph/0706.0513)
- Genzel et al. (2001) Genzel R., Tacconi L.J., Rigopoulou D., Lutz D., Tezca M., 2001, ApJ, 563, 527
- Giveon et al. (2002) Giveon U., Sternberg A., Lutz D., Feuchtgruber H., Pauldrach A.W.A., 2002, ApJ, 566, 880
- Heckman et al. (2000) Heckman T., Lehnert M., Strickland D., Armus L., 2000, ApJS, 129, 493
- Hinz & Rieke (2006) Hinz J.L., Rieke G.H., 2006, ApJ, 646, 872
- Houck et al. (1985) Houck J.R., Schneider D.P., Danielson G.E., Neugebauer G., Soifer B.T., Beichman C.A., Lonsdale, C.J., 1985, ApJ, 290, L5
- Hughes et al. (1998) Hughes D.H., et al, 1998, Nat, 394, 241
- James & Seigar (1999) James P.A., Seigar M.S., 1999, A&A, 350, 791
- Jarrett et al. (2006) Jarrett T.H., et al., 2006, AJ, 131, 281
- Kawakatu et al. (2006) Kawakatu N., Anabuki N., Nagao T., Umemura M., Nakagawa, T., 2006, ApJ, 637, 104
- Kennicutt (1998) Kennicutt, R.C Jr., 1998, ApJ, 49, 541
- Kim et al. (1995) Kim D.-C., Sanders D.B., Veilleux S., Mazzarella J.M., Soifer T., 1995, ApJS, 98, 129
- Kobulnicky et al. (2003) Kobulnicky H.A., et al., 2003, SPIE, 4841, 1634
- Levenson et al. (2007) Levenson N.A., Sirocky M.M., Spoon H.W.W., Marshall J.A., Elitzur M., Houck J.R., 2007, ApJ, 654, L45
- Lípari et al. (2000) Lípari S., Días R., Taniguchi Y., Terlevich R., Dottori H., Carranza G., 2000, AJ, 120, 645
- Lípari et al. (2005) Lípari S., Terlevich R., Zheng W., Garcia-Lorenzo B., Sanchez S.F., Bergmann, M., 2005, MNRAS, 360, 416
- Lonsdale et al. (2006) Lonsdale C., Diamond P.J., Thrall H., Smith H.E., Lonsdale C.J., 2006, ApJ, 647, 185
- Lonsdale et al. (2006) Lonsdale C. J., Farrah D., Smith H. E., ‘Ultraluminous Infrared Galaxies’, published in ”Astrophysics Update 2 - topical and timely reviews on astronomy and astrophysics”. Ed. John W. Mason. Springer/Praxis books. ISBN: 3-540-30312-X, (astro-ph/0603031)
- Martin (2005) Martin C. L., 2005, ApJ, 621, 227
- Mattila & Meikle (2001) Mattila S., Meikle W.P.S., 2001, MNRAS, 324, 325
- Mattila et al. (2007) Mattila S., et al., 2007, ApJ, 659, L9
- Mihos & Hernquist (1996) Mihos J.C., Hernquist L., 1996, ApJ, 464, 641
- Mirabel et al. (1990) Mirabel I.F., Booth R.S., Garay G., Johansson L.E.B., Sanders D.B., 1990, A&A, 236, 327
- Monreal-Ibero et al. (2006) Monreal-Ibero A., Arribas S., Colina L., 2007, ApJ, 637, 138
- Monreal-Ibero et al. (2007) Monreal-Ibero A., Colina L., Arribas S., García-Marín M., 2007, astro-ph/0706.1145
- Murphy et al. (1999) Murphy Jr.,T.W., Soifer B.T., Matthews K., Kiger J.R., Armus L., 1999, ApJ, 525, L85
- Murphy et al. (2001) Murphy Jr.,T.W., Soifer B.T., Matthews K., Armus L., Kiger J.R., 2001, AJ, 121, 97
- Naab & Burkert (2003) Naab T., Burkert A., 2003, ApJ, 597, 893
- Naab, Jesseit & Burkert (2006) Naab T., Jesseit R., Burkert A., 2006, MNRAS, 372, 839
- Naab et al. (2007) Naab T., Johansson P.H., Ostriker J.P., Efstathiou G., 2007, ApJ, 658, 710
- O’Donoghue et al. (2006) O’Donaghue, D., et al., 2006, MNRAS, 372, 151
- Pahre et al. (2004) Pahre M.A., Ashby M.L.N., Fazio G.G., Willner S.P., 2004, ApJS, 154, 229
- Parra et al. (2007) Parra R., Conway J.E., Diamond P.J., Thrall H., Lonsdale C., Lonsdale C.J., Smith H.E., 2007, ApJ, 659, 314
- Peng et al. (2002) Peng, C.Y., Ho L.C., Impey C.D., Rix H.-W., 2002, AJ, 124, 266
- Perez-Torres et al. (2007) Pérez-Torres M.A., et al., 2007, ApJL, in press (arXiv:0709.4272)
- Phillips (1993) Phillips A.C, 1993, AJ, 105, 486
- Rhoads (1998) Rhoads J.E., 1998, AJ, 115, 472
- Rieke & Low (1972) Rieke G.H., Low F.J., 1972, ApJ, 176, L95
- Rieke & Lebofski (1985) Rieke G.H., Lebofsky M.J., 1985, ApJ, 288, 618
- Robertson et al. (2006) Robertson B., Bullock J.S., Cox T.J., Di Matteo T., Hernquist L., Springel, V., Yoshida N., 2006, ApJ, 645, 986
- Rupke, Veilleux & Sanders (2002) Rupke D.S., Veilleux S., Sanders D.B., 2002, ApJ, 570, 588
- Sanders & Mirabel (1996) Sanders D.B., Mirabel I.F., 1996, ARAA, 34, 749
- Sanders et al. (2003) Sanders D.B., Mazzarella J.M., Kim D.-C., Surace J.A., Soifer B.T., 2003, AJ, 126, 1607
- Schwartz & Martin (2004) Schwartz C.M., Martin C.L., 2004, ApJ, 610, 201
- Sirianni et al. (2005) Sirianni M., et al., 2005, PASP, 117, 1049
- Smail et al. (2003) Smail I., Chapman S.C., Ivison R.J., Blain A.W., Takata T., Heckman T.M., Dunlop J.S., Sekiguchi K., 2003, MNRAS, 342, 1185
- Smith et al (2007) Smith B.J., Struck C., Hancock M., Appleton P.N., Charmandaris V., Reach W.T., 2007, AJ, 133, 791.
- Sparks, Carollo & Macchetto (1997) Sparks W.B., Carollo C.M., Macchetto F., 1997, ApJ, 486, 253
- Spoon et al. (2007) Spoon H.W.W., et al., 2007, ApJ, 654, L49
- Springel (2005) Springel V. 2005, MNRAS, 364, 1105
- Springel, Di Matteo & Hernquist (2005) Springel V., Di Matteo T., Hernquist L., 2005, MNRAS, 361, 776
- Strauss et al. (1992) Strauss M.A., Huchra J.P., Davis M., Yahil A., Fisher K.B., Tonry J., 1992, ApJS 83, 29
- Sturm et al. (2002) Sturm E., Lutz D., Verma A., Netzer A., Stermberg A., Moorwood A.F.M., Oliva E., Genzel R., 2002, A&A, 393, 821
- Takata et al. (2006) Takata T., Sekiguchi K., Smail I., Chapman S.C., Geach J.E., Swinbank A.M., Blain A., Ivison, R.J., 2006, ApJ, 651, 713
- Thronson & Greenhouse (1988) Thronson Jr, H.A., Greenhouse M.A., ApJ, 1988, 327, 671
- Väisänen & Johansson (2004) Väisänen P., Johansson P.H., 2004, A&A, 421, 821
- Valiante et al. (2007) Valiante E., Lutz D., Sturm E., Genzel R., Tacconi L.J., Lehnert M.D., Baker A.J., 2007, ApJ, 660, 1060
- Veilleux & Rupke (2002) Veilleux S., Rupke D.S., 2002, ApJ, 565, L63
- Veilleux et al. (1995) Veilleux S., Kim D.-C., Sanders D.B., Mazzarella J.M., Soifer B.T, 1995, ApJS, 98, 171
- Veilleux et al (2002) Veilleux S., Kim D.-C., Sanders D.B., 2002, ApJS, 143, 315
- Veilleux et al. (2003) Veilleux S., Shopbell P.L., Rupke D.S., Bland-Hawthorn J., Cecil G., 2003, AJ, 126, 2185
- Veilleux & Osterbrock (1987) Veilleux S., Osterbrock D.E., 1987, ApJS 63, 295
- Verma et al. (2003) Verma A., Lutz D., Sturm E., Sternberg A., Genzel R., Vacca W., 2003, A&A, 403, 829
- Wahde & Donner (2001) Wahde M., Donner K.J., 2001, A&A, 379, 115
- Wang et al. (2004) Wang Z., 2004, ApJS, 154, 193
- Wetzstein, Naab, & Burkert (2007) Wetzstein M., Naab T., Burkert A., 2007, MNRAS, 375, 805
- Zasov et al. (2000) Zasov A., Kniazev A.Y., Pustilnik, S.A., Pramsky A.G., Burenkov A.N., Ugryumov A.V., Martin J.-M., 2000, A&AS, 144, 429