Integral-Field Spectroscopy of the Post Red Supergiant IRC +10420: evidence for an axi-symmetric wind
Abstract
We present NAOMI/OASIS adaptive-optics assisted integral-field spectroscopy of the transitional massive hypergiant IRC +10420, an extreme mass-losing star apparently in the process of evolving from a Red Supergiant toward the Wolf-Rayet phase. To investigate the present-day mass-loss geometry of the star, we study the appearance of the line-emission from the inner wind as viewed when reflected off the surrounding nebula. We find that, contrary to previous work, there is strong evidence for wind axi-symmetry, based on the equivalent-width and velocity variations of H and Fe ii 6516. We attribute this behaviour to the appearance of the complex line-profiles when viewed from different angles. We also speculate that the Ti ii emission originates in the outer nebula in a region analogous to the Strontium Filament of Carinae, based on the morphology of the line-emission. Finally, we suggest that the present-day axisymmetric wind of IRC +10420, combined with its continued blueward evolution, is evidence that the star is evolving toward the B[e] supergiant phase.
1 Introduction
IRC +10420 (catalog ) (, J2000) is an extremely luminous star which inhabits the so-called ‘yellow-void’ on the HR diagram between the Red and Blue Supergiants (de Jager, 1998). There is considerable evidence that the star is evolving rapidly away from the RSG phase towards the Luminous Blue Variable (LBV) or Wolf-Rayet (WR) phases (see below). As such this object represents a potential link between the key post-MS mass-losing stages, and is therefore considered extremely important for the study of massive stellar evolution.
The star is surrounded by a dusty circumstellar nebula, responsible for its large IR-excess. This nebula is the result of an extreme mass-losing episode in the RSG phase, when the mass-loss reached 10-4⊙yr-1 (Oudmaijer et al., 1996, O96 hereafter). It is also an OH maser source, a phenomenon usually identified with much cooler stars (Giguere et al., 1976). This maser is thought to be a relic of an earlier M supergiant phase, from which the central star must have rapidly evolved on a timescale of years in order for the maser source to still survive (Mutel et al., 1979). Indeed, the star has been observed to gradually increase in temperature from 6000 K to 9200 K in the last 30 years (O96, Klochkova et al., 2002).
The material the star has recently ejected may be the precursor to a LBV/WR nebula. These nebulae are often axisymmetric, but it is unclear how these nebulae are formed. Hydrodynamical studies have shown that axisymmetric morphologies can arise from either an axisymmetric wind in the LBV/WR phase, or a spherically-symmetric wind ploughing into a slower axisymmetric wind ejected in the RSG phase (Frank et al., 1995; Dwarkadas & Owocki, 2002). As wind-axisymmetry may be linked to rotation, which itself plays an important role in the evolution of a massive star (see e.g. review of Maeder & Meynet, 2000), and as IRC +10420 appears to be somewhere between the LBV/WR and RSG phases, determining the true geometry of the star’s present-day wind may provide insight into the formation mechanism of the bipolar nebulae of massive stars. Further, it may also provide clues as to the role of rotation in its subsequent evolution and the connection to other classes of massive star.
The geometry of IRC +10420’s wind has been the topic of much discussion over the last 20 years, yet a common concensus remains elusive due to the weight of apparently contradictory evidence. The OH maser emission was spatially-resolved by Diamond et al. (1983), who suggested the masing emission originated in an equatorial outflow seen almost edge-on. In the mid 1980s, the star began to show H emission (Irvine & Herbig, 1986), high-resolution observations of which showed it to be doubly-peaked (Jones et al., 1993) – reminiscent of classical Be stars which are commonly thought to have outflowing disks (Porter & Rivinius, 2003). Additionally, Jones et al. argued that while the star has considerable IR-excess, there is only modest extinction towards the central star. This, they concluded, was due to the circumstellar material being located in an inclined disk, with the star itself relatively unobscurred. Also, their mid-IR imaging was elongated at a PA of 150°, which they suggested was the PA of the disk.
However, from near infra-red spectra, Oudmaijer et al. (1994) argued that the H i emission was inconsistent with a circumstellar disk, suggesting instead that the ionized material was located in a bipolar outflow oriented close to the line-of-sight. Humphreys et al. (1997) argued for bipolarity of the outer nebula, and that the morphology was analogous to that of the dusty homunculus nebula around Car oriented almost pole-on. They suggested the extended emission to the SW was due to the nearer lobe, whilst the receding lobe on the far-side to the NE was obscurred by equatorial material.
The confusion was apparently complete when Humphreys et al. (2002), using HST/STIS long-slit spectroscopy, utilized the star’s reflection nebula as a tool with which to view the H emission from different angles. With the slit aligned along the long-axis of the nebula, they showed that the velocities of the two peaks in their H profile were ‘surprisingly uniform’. This they argued was inconsistent with a circumstellar disk or a bipolar outflow, and concluded that the star showed no evidence of axisymmetry in the present-day wind.
However, Humphreys et al. only observed two slit positions, each roughly parallel to the long-axis of the nebula and separated by 0.5″. In this paper, their data is improved on with spatially-resolved spectroscopy across the whole of the inner nebula, with integral-field spectroscopy. We will show that, contrary to the conclusions of Humphreys et al., the emission-lines are variable when viewed from different angles. It is argued that this is due to the non-isotropic nature of the star’s wind, and that the line-emission is formed in an axi-symmetric structure in the inner wind.
2 Observations & Data-Reduction
2.1 Observations
Data was taken during 3-5 September 2005 at the WHT on La Palma, using OASIS in Tiger mode (Bacon et al., 1995) in conjuction with the NAOMI adaptive optics system (Myers et al., 2003). Observing conditions were good, with a small amount of extinction ( few tenths of 1 mag) due to Saharan dust. Seeing was 0.6-1.0″ throughout our programme.
The 22mm enlarger was used in conjunction with the HR667 filter, which gives a plate-scale of 0.97Å/pixel in the wavelength range 6490 - 6840Å and a lenslet size of 0.26″.
In addition to the usual calibrations of biases, dome-flats and neon arcs, the following extra calibration exposures must be taken for OASIS – undispersed micropupil frames, which record the positions of the micropupils focussed by the lenslet arrays onto the CCD; and continuum frames, which record the positions of the spectral ‘ridges’ on the CCD. These calibrations were done by illuminating the lenslets with a tungsten bulb.
For the science frames the observational strategy employed was that of exposures with increasing integration times, to gradually increase the signal-to-noise ratio (SNR) in the outer parts of the field-of-view whilst obtaining unsaturated data at the centre of the image. Exposures were dithered by 0.1″to identify and reject bad-pixels on the CCD. Overall, 6 hours of science exposures were obtained in 17 separate exposures.
In addition, a PSF standard star, HIP95166, was observed in order to accurately measure the PSF at the time of observations. The standard is separated from IRC +10420 by 1.3°, and has brightess 10.4 compared with 11.1 for IRC +10420.
In practice, even the longest exposure times of 30min only just saturated the H line in the central couple of pixels. However, the MITTL3 CCD is very susceptible to cosmic rays, and long exposure images were so decimated by cosmic hits that the spectral mask creation algorithm failed in the outer regions where the SNR is lower. Subsequently, some data had to be discarded. Therefore, for future observations using this setup, integration times of no longer than 15min are recommended.
2.2 Data reduction
All data-reduction was done with the instrument’s custom-written software xoasis111http://www.cfht.hawaii.edu/Instruments/Spectroscopy/OASIS/Reduc/, and following the steps outlined in the software documentation. Initially, a median-averaged bias frame was subtracted from all calibration and science frames. A spectral ’mask’ was created using the micropupil and continuum frames, which recorded the loci of each micropupil spectrum on the detector. This mask was used to extract each spectrum of a given exposure, which were arranged in a datacube with the spatial coordinates of the corresponding lenslet.
Each spectrum in a single-exposure datacube was flat-fielded with the corresponding spectrum in the master continuum-lamp datacube. Wavelength calibration was done by fitting a 2nd-degree polynomial to the five identified neon lines in the observed wavelength range. When identifying and rejecting cosmic rays, it was found that the xoasis algorithm was unable to deal with the high number of hits without attacking the H line centre. Instead, cosmics were rejected at the mosaicing stage.
To mosaic the 17 individual frames, each were first recentered about the brightness-centre of each exposure. The frames were weighted according to the mean number of counts per frame, and resampled onto a square spatial sampling grid using bicubic interpolation. The median spectrum was then found at each spatial point on the grid, thus eliminating cosmic ray hits. As the observations were dithered by 0.1″, we chose to spatially sample the individual frames onto a master grid of 0.13″per pixel, i.e. half the size of a lenslet.
2.3 Data analysis
The continuum of each spectrum was fitted with a 2nd-degree polynomial, using only those regions deemed to be featureless from the high-SNR integrated over the whole field. Thus, a datacube of the continuum at each spatial pixel was created.
The discrete features of the spectral lines – see e.g. Oudmaijer (1998) – are poorly resolved in these data, so spatial variations in line velocities were measured by fitting gaussian profiles to the lines in each spectrum of the datacube. In order to test the uniformity of the instrumental spectral resolution, this analysis was applied to the Neon arc frames. It was found that the spectral resolution was km s-1 over the whole chip.
Synthetic narrow-band images were created by first summing the spectra in the datacube over the width of the line. The corresponding continuum was found by summing over the same spectral region in the ‘continuum-cube’ (the continuum-fit to the datacube, see above). The ‘pure’ line-image was then found by subtracting the ‘continuum’ image from the ‘continuum+line’ image.
For PSF characterization and subtraction, the spatial PSF of the observations was assumed to be that of the standard star. As no spectral information was required of this object, the spectra of the standard were aggressively cleaned for cosmics and then median averaged in the spectral direction to produce a 2-D image. This was then resampled onto the same spatial grid as the target object. The FWHM of this image was found to be 0.5″. This corresponds to a Strehl ratio of 0.1, and an improvement of a factor of 2 on the seeing conditions. This is consistent with the expected performance of NAOMI at optical wavelengths. Qualitative PSF-subtraction was done by iteratively scaling the flux of the PSF standard with the flux of the science target, until cancellation effects at the centre of the image were minimized.

3 Results & Discussion
In this section, the results of the datacube analysis are presented and discussed. All spatial images shown are centred on 19h 26m 48.0s +11° 21 16.7 (J2000), with north at the top and east to the left. To aid the interpretation of the data, the images are overlayed with a contour map of a HST F451M image taken from the archive, with a spatial resolution of 0.1″. As the image was taken in the blue part of the spectrum, the reflection nebula is clearly seen.
3.1 Mean spectrum of IRC +10420
| (Å) | Ident. | (Å) | FWHM | |
|---|---|---|---|---|
| ( km s-1) | ( km s-1) | |||
| 6508.08 | 1 | +0.16 | - | 198 |
| 6517.39 | Fe ii | -1.0 | +62 | 151 |
| 6564.57 | H | -50.2 | +80 | 372 |
| 6594.90 | [Ti ii] ? | -0.04 | +90 | 109 |
| 6607.07 | 2 | -0.28 | - | 193 |
| 6613.53 | DIB | +0.23 | +1 | 117 |
| 6618.64 | 3 | -0.15 | - | 199 |
| 6627.51 | 3 | -0.12 | - | 195 |
| 6660.59 | DIB | +0.09 | -2 | 108 |
| 6668.08 | 4 | -0.08 | - | 167 |
| 6680.82 | Ti ii5 | -0.30 | +25 | 249 |
| 6699.61 | DIB | +0.05 | +17 | 147 |
| 6719.02 | Ti ii | -0.14 | +50 | 171 |
1Unidentified line, Ne i?
2Resolved
in O98 as four discrete components, and in Chentsov et al. (1999) as
two. Identified by the latter as a blend of Sc ii and Ti ii.
3Unidentified lines, may be split components of the same
line – see Sect. 3.5.
4Unidentified line, possibly a blend
of Fe i and/or [Ni ii]?
5Possible unresolved blend of Ti
ii and He i 6678
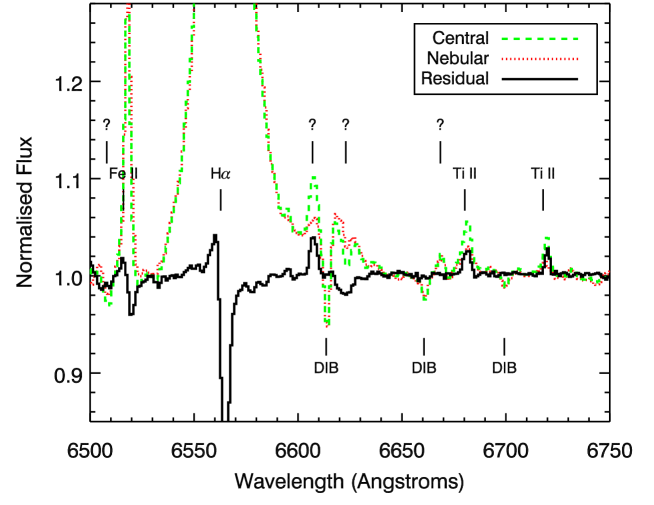
The spectrum over the full wavelength range observed and integrated over the whole image is shown in Fig. 1. The individual spectra were flux-weighted before adding, and continuum-flattened later. In addition to the strong H line, the permitted lines of Fe ii 6516 and Ti ii 6680, 6717 are identified. Also, there are several unidentified features. The emission bump on the blue side of the DIB at is identified by Chentsov et al. (1999) as a blend of Sc ii and Ti ii. The other unidentified spectral features are not present in Oudmaijer’s 1994 spectrum. The properties of observed spectral features of the central region (region (e) in Fig. 2) are listed in Table 1.
The spectral features identified in Table 1 do not all exhibit the same behaviour across the field. Below, we emphasize this by showing the residual spectrum between the central star and the surrounding nebula. This is followed by a discussion of the behaviour of individual lines. As the signal-to-noise (S/N) of the lines falls-off with distance from the star, this analysis is limited to those with the highest S/N, in order to assess the spatial variations over as large a field as possible. These features are the H, Fe ii and Ti ii emission lines, as well as the unidentified blend at Å and the diffuse interstellar bands (DIBs).
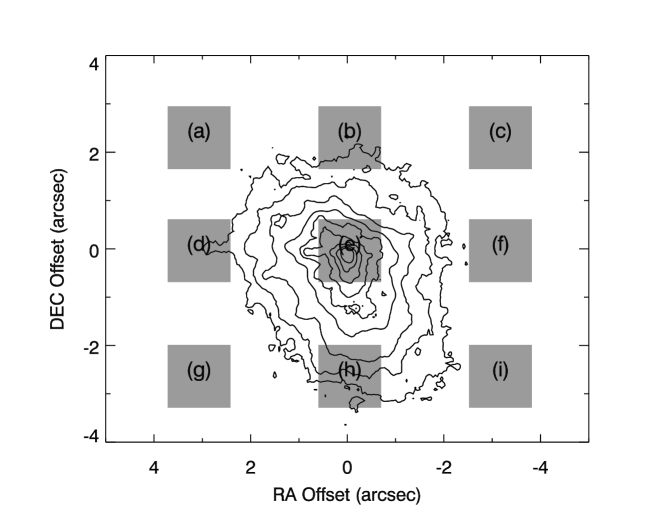
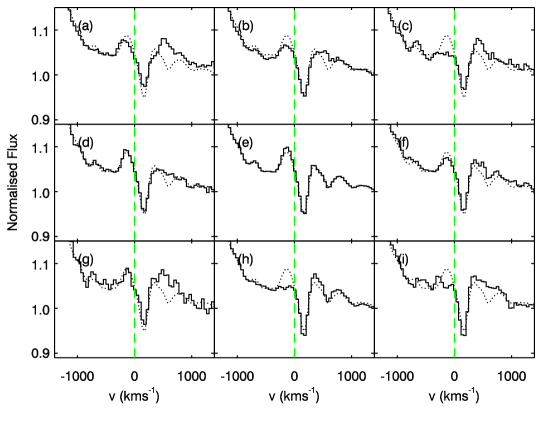
3.1.1 Residual spectrum of central object
In order to find the differences between the spectra of the central object and the surrounding nebula, we divide the field up into nine spatial regions: a central (star+nebula) region, surrounded by eight nebula regions (illustrated in Fig. 2). The spectra of the outer regions were added together and normalised by the mean continuum spectrum of the same regions, to ensure that the total ‘nebular’ spectrum is weighted towards the higher S/N regions. The normalised spectrum of the central region (region () in Fig. 2) was then divided by the total nebular spectrum.
The resulting spectrum is shown in Fig. 3. While the DIBs are seen to vanish, the Ti ii lines remain, as does the unidentified line at 6607Å. The features around the H and Fe ii lines result from the ratio of lines of different width and velocities. In the following sections, the lines are individually discussed in more detail.
3.2 Diffuse interstellar bands
There are three DIBs in the spectral region covered – one in the red-wing of H at 6614Å and two in the region of the Ti ii lines at 6661Å and 6700Å. Figure 3 shows that these lines all cancel-out perfectly in the residual spectrum between the star and the surrounding nebula. Analysis of the DIB at 6700Å, the only DIB which appears not to be blended with other spectral features, shows that the equivalent width of the line is constant over the field to within the errors. However, the S/N in the outer regions is low, and for this reason it is not illustrated here.
The cancellation of the DIBs in the residual spectrum is an important result. These features are indicative of the interstellar extinction toward IRC +10420 (Oudmaijer, 1998), and appear to be equally strong towards the central star and the outer nebula. This supports the conclusions of Jones et al. (1993) who found that, whilst the star has significant IR-excess, there is only a relatively small amount of circumstellar extinction in the line-of-sight to the central star. In addition, this result strongly suggests that any variations observed in other spectral features are real.
3.3 The H and Fe ii 6516 emission
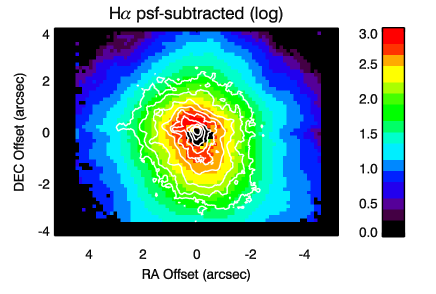
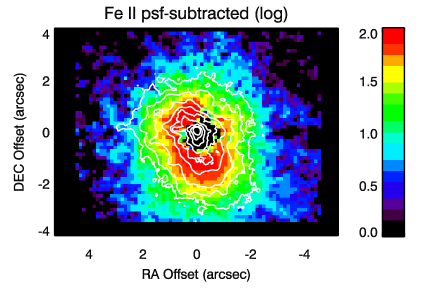
The H and Fe ii emission, as traced by the continuum-subtracted, PSF-subtracted images, closely follow the morphology of the reflection nebula as shown in the continuum -band HST image (see Fig. 4). A star with K is unlikely to emit enough flux shortward of 912Å to ionize the circumstellar material out to these distances (0.1pc if = 6 kpc is assumed). It is therefore more likely that the line-emission forms close to the star, and the light seen from the nebula is reflected. Further, it can be argued that the line-emission is unresolved by the nebula: from modelling of speckle interferometry observations, Blöcker et al. (1999) found an inner dust radius of 70, meaning that the star has an apparent radius of 50′ when viewed from the inner dust wall. If all line-emission forms within a few stellar radii, it is reasonable to assume that the line-formation regions are spatially-unresolved when viewed at the distance of the circumstellar dust.
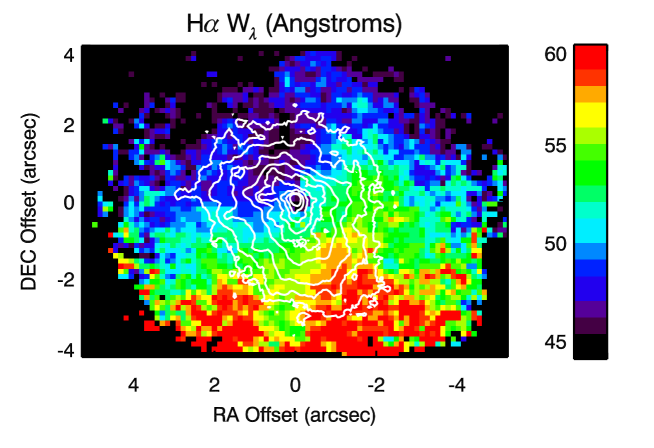
3.3.1 Variations in line-strength
With this in mind, we analyse the equivalent-width () variations of the two lines. We note that the spectral resolution of this data (60 km s-1) is not sufficient to resolve the double-peaked profile in H observed by Humphreys et al. (2002). However, the spectral resolution does not affect the equivalent width . Therefore any variation in cannot be an artifact of unresolved features but instead must be due to a genuine change in line-profile or line-strength across the field of view. The stark uniformity observed in the DIBs (see Sect. 3.2) would suggest that any observed variations are real.
A map of (H), shown in Fig. 5, illustrates that there is a marked decrease of 15Å (25%) along the long axis of the nebula from SW to NE. We note that the same behaviour is observed in the Fe ii line, but at poorer signal-to-noise (not shown). This is clear evidence of a degree of axisymmetry to IRC +10 420’s present-day wind.
This result is in direct contradiction to the conclusions of Humphreys et al. (2002). In their long-slit spectra, they observed that the velocities of the two peaks of the H profile were roughly consistent at several slit positions along the axis of the nebula. However, their slit positions happened to be oriented more-or-less along regions of the nebula where the H is constant to within 5Å. They therefore may have discounted any observed trend in as being too small to draw any conclusions from.
3.3.2 Variations in velocity centroid
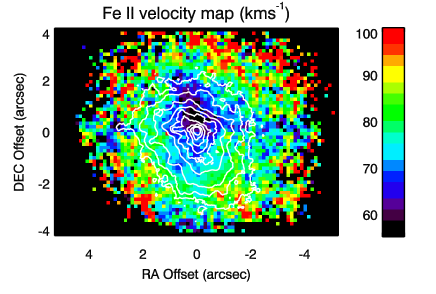
As argued above, it is a valid assumption that formation regions of the H and Fe ii lines in the stellar wind are point-sources when viewed by the nebula. As the discrete components of the line-profiles are unresolved in our data, at first-thought one could assume that any shifts in the velocity centroids of the lines may trace the nebular dynamics. If true, then the same behaviour would be observed in both lines.
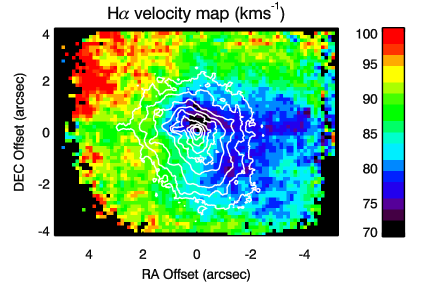
Figure 6 shows the spatial variations of the centroids of the Fe ii and H lines, as determined by fitting gaussian profiles to the lines at each spatial point in the data-cube. The kinematic morphology as traced by the Fe ii line appears to be slightly elongated, with the lowest velocities reached 1″ NE of the centre of the field. The velocities range from 60 km s-1 to 95 km s-1 at the edge of the field.
However, contrary to the basic assumptions above, the picture is different however in the H velocity map. The kinematic morphology of this line is somewhat axisymmetric, with regions reaching from the centre to the SW displaying velocities of 75 km s-1, and regions in the NE of 100 km s-1. We point out that this is consistent with the velocities measured by Humphreys et al. (2002), whose slit was aligned more-or-less NE-SW.
3.3.3 Anisotropic emission?
While asymmetry in the dynamics of the reflection nebula alone could explain the variations in line-centroid, it cannot explain the variations in line-strength. Further, if the H and Fe ii emission regions are roughly coincident (i.e. unresolved by the reflection nebula), the ‘moving mirror’ could not explain why different velocity trends are observed in the two lines.
If the line-emission seen by the dust is spatially unresolved, but the line-profile had a different appearance depending on the viewing angle to the star, this would influence the observed velocity of the line when reflected off different regions of the nebula. The velocity maps shown above were created by fitting gaussian profiles to the emission lines. This is a valid assumption as the line-structure seen in high-resolution spectra is not resolved in this data. However, if the line-profiles are complex and anisotropic, the unresolved line-profile may seem to be velocity-shifted when observed from different viewing angles due to changes in the contributions from the different components. An example of this is discribed below.
Oudmaijer (1998) showed in his 1994 spectrum that various Fe ii lines showed inverse P Cygni profiles, which he attributed to infalling material. In some line profiles, the absorption component was as strong as the emission component. The separation of the components was 60 km s-1, and so would not necessarily be resolvable in the data presented here. If the absorption component varied in strength depending on the viewing angle, for example due to an increased column-density of infalling material, it may cause the peak of the total line-profile to shift. An increase in red-shifted absorption would cause the peak to shift to the blue, as well as producing an overall drop in equivalent width.
Similarly, the H emission is known to be doubly-peaked, with the blue peak typically stronger than the red (e.g. Oudmaijer, 1998; Humphreys et al., 2002). If the ratio of the two peaks, or the depth of the central absorption, were to depend on viewing angle, this could also cause an observed velocity trend in the unresolved emission line, as well as a change in total line-emission.
The spectral resolution of our observations is not sufficient to provide a detailed view of how the line-profiles change when viewed from different angles; however from the unambiguous changes in line-emission as probed by the map, and the differing velocity trends of the H and Fe ii lines, we can say that strong evidence exists that the wind has an axisymmetric appearance when viewed from the surrounding reflection nebula.
Now the angle of axisymmetry has been better constrained, at least in terms of the H emission, it would be interesting to follow-up this study with high spectral-resolution data similar to that presented in Humphreys et al. (2002), but with the slit position adjusted. Such a study would allow more quantitative arguments to be made regarding the latitudinal dependence of the star’s wind structure. Indeed, in a similar study of Car, Smith et al. (2003) were able to show evidence for an apparent increase in mass-flux towards the poles.
3.4 The Ti ii 6680, 6718 emission
Although weak, it is clear that the behaviour of these lines differs from H and Fe ii 6516. Figure 7 shows the continuum-subtracted, PSF-subtracted line-image when the light of the two lines is combined. The behaviour of each of the lines is similar, therefore we combined the two to increase S/N.
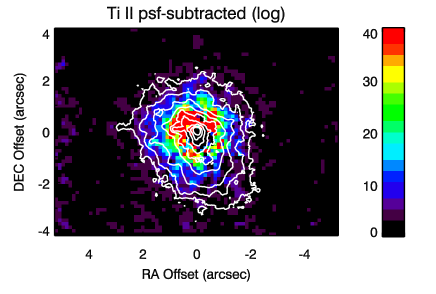
Unlike the H and Fe ii lines, the morphology of the reflection nebula is not reproduced by the Ti ii line images. This is not due to low S/N, as it can be seen in both the H and Fe ii images that the S/N follows the contours of the nebula in the HST image (Fig. 4). This would seem to suggest that the emission zone of these lines is very different to that of the other lines studied, as discussed below.
3.4.1 The origin of the Ti ii emission
If the reflection-nebula paradigm is to hold, then the only reason that the Ti ii emission is not reflected off the nebula is if the line forms within or outside the nebula, in a localised region along our line-of-sight but a large distance from the central star. This would also explain the radial velocities being blueshifted by 25 km s-1 compared to the systemic velocity. If correct, this would mean that the Ti ii emission originates at a distance pc ( kpc) from the star.
It may be that the Ti ii emission comes from a region analagous to the Strontium filament in the nebula of Car (catalog ) (Zethson et al., 2001). This is a localised region located in the equatorial ‘skirt’ of Car’s homunculus nebula, which shows very unusual spectral features of singly-ionized Sr, Ti and V amongst others, whilst showing no detectable H or He emission and only very weak Fe ii emission (Hartman et al., 2004). It also a source of NH3 emission, but no H2 emission is observed (Smith et al., 2006).
The proposed explanation for the presence of Car’s Strontium filament is that the emission region must be bathed in photons with (the ionization potentials of Sr and Ti are 5.7 eV and 6.8 eV respectively), but is shielded from the intense radiation shortward of 1500Å by H and Fe ii in the inner wind. This allows species with low ionization potentials such as Sr ii and Ti ii, to exist over an extended region without becoming doubly-ionized. Further, the region must be very dense in order to produce significant Sr emission, due to its low cosmic abundance (a factor of lower than Fe) (Bautista et al., 2002).
Such a situation may exist in IRC +10420. The Ti ii emission may originate in a region located within the nebula at a distance of 0.01 pc () along our line-of-sight, shielded by the H and Fe in the inner wind. This would explain why the H and Fe line-images trace the reflection nebula, while the Ti emission, which originates from the near side of the nebula, is essentially unseen by the rest of the nebula.
We note that this phenomenon may be less unusual in the case of IRC +10420. The star emits less radiation in the UV than Car, and so less shielding is required for the partially-ionzed zone to survive. Also, we have no geometry information on the other characteristic Sr filament lines of Sr ii V ii, and Fe i emission, which are present in IRC +10420’s spectrum (Oudmaijer, 1998). It would be interesting to compare the data presented here with similar data which could explore the emission regions of these lines, to confirm that they originate in the outer nebula.
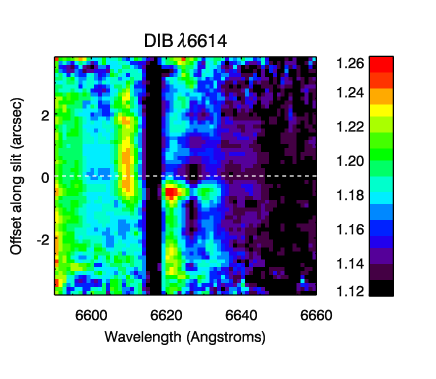
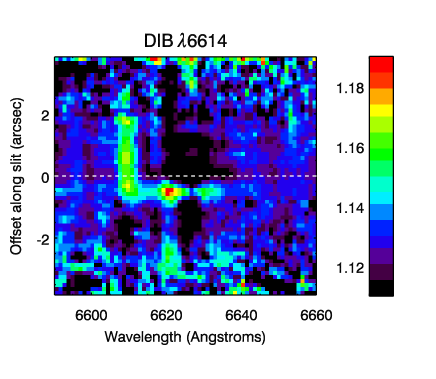
3.5 On the unidentified blend around the DIB at 6614Å
The bump of emission blueward of the DIB at 6614Å is resolved in Oudmaijer (1998) as four separate emission peaks (see his Fig. 5). This is suggested by Oudmaijer to be a blend of Fe i, although Humphreys et al. (2002) suggests one line may be that of Sc ii. The feature is resolved as two peaks of similar strength in the 1998 spectrum of Chentsov et al. (1999), who suggest line identifications of Sc ii 6605 and Ti ii 6607.
By taking a slice across the data-cube at a PA of 33° i.e. aligned with the symmetry identified from the H map, a synthetic long-slit spectrogram of this feature was created (see Fig. 9). The figure shows the feature on the blue side of the DIB apparently behaving identically to the Ti ii lines, i.e. concentrated in the centre of the field. This is strong evidence that this feature is in part due to Ti ii emission, as suggested by Chentsov et al. (1999). This feature completely vanishes to the south, implying that all the unidentified, unresolved emission components which make up this feature behave in the same way.
The spectrogram of this region also reveals the behaviour of the unidentified feature on the red side of the DIB. This feature is strongest 0.5″ below the centre, disappears, then reappears further south. The fact that it is apparently absent elsewhere in the field may explain why this feature has never been previously identified, as it is swamped by the rest of the emission when integrated over a large region.
There is a possibility that must be discussed, that the features on the red and blue side of the DIB are velocity-shifted components of the same transition, formed in, for example, a bi-polar flow viewed pole-on (c.f. conclusions of Oudmaijer, 1998). The velocity separation of the two lines, which in this case is 450 km s-1, would be centred on the systemic velocity of 75 km s-1 (Oudmaijer, 1998), and implies an outflow velocity of 225 km s-1. This means the rest-frame wavelength of the transistion would be Å, neglecting any uncertainty in the systemic velocity.
As such behaviour is not observed in H nor the singly-ionised metallic lines of Fe and Ti, and as one may expect greatly different physical conditions within the bi-polar flow to the rest of the wind, one would expect this transition to be from a high ionization species. The only such line in this narrow region is Ti iii 6611.38. The presence of Ti iii emission is not noted anywhere in the high-resolution spectra of (Oudmaijer, 1998) and Chentsov et al. (1999). This line-identification is therefore unlikely. Further study of this feature with high SNR, high spectral-resolution data is warranted to investigate the ’jet’ nature of this feature.
3.6 The significance of wind-axisymmetry in IRC +10420
A wealth of evidence now exists for axisymmetry in the wind of IRC +10420 on several scales: from the outer reflection nebula seen in HST images (PA33°), high-resolution IR images on scales of 1-2″ (58°, Humphreys et al., 1997), to the scales of a few stellar radii probed by spectropolarimetry (150°, Patel et al. in prep). The axes of symmetry of these observations are all either aligned or perpendicular to 4515°.
The data presented in this paper are consistent with this story. The quality of our data is such that we cannot resolve the changes in line-profile when viewed from different angles, and so cannot draw any conclusions as to the geometry of the wind (e.g. disk or bi-polar ouflow) or density constrasts between equator and pole. However, the and velocity variations of the H and Fe ii lines provide clear evidence for wind-axisymmetry, independent of the geometry of the reflection nebula. The position-angle of this axisymmetry is consistent with the long-axis of the nebula (33°).
The axisymmetric wind of the star is strong evidence that rotation has played a significant role in its evolution, whereby a latitude-dependent effective gravity leads to very different mass-loss behaviour between the equator and poles. This rotation could be due either to the presence of a companion, or merely fast initial rotation of the star. A rotating star which is losing mass is also losing angular momentum, and hence the equatorial surface gravity should steadily increase over time as mass is lost and the star spins down. This may cause the mass-loss rate to decrease as a function of age.
Studies of the star’s dust emission by O96 and Blöcker et al. (1999) have concluded that the mass-loss rate has decreased over time by factors of 15 to 40; while Lipman et al. (2000) also found a density gradient consistent with a falling mass-loss rate. In addition, Smith et al. (2004) suggest that the gradual increase of the star’s effective temperature over the last 20 years or so (O96, Oudmaijer, 1998; Klochkova et al., 2002) may be in fact due to a further decrease in mass-loss. Here, the dense wind forms a pseudo-photosphere, making the star appear cooler. As the mass-loss rate falls and the wind density decreases, we are able to see deeper into the wind, making the star’s effective temperature appear to increase.
Were the star’s mass-loss rate to decrease further, the star would continue to evolve blueward at constant bolometric luminosity. It is then logical to connect IRC +10420 with the B[e] supergiants (sgB[e]), which occupy the same luminosity range on the HR diagram and whose hybrid spectral characteristics are understood to result from highly-axisymmetric outflows (Zickgraf et al., 1986). These stars are often thought of as preceding the RSG phase (e.g. Smith et al., 2004), a reasonable hypothesis given their large H abundances (inferred from their strong Balmer-line emission), presumably-high rotation-rates (inferred from their wind-axisymmetry) and lack of circumstellar nebulae. Such stars could potentially shed their angular momentum and spin-down upon passing through the violent mass-losing RSG/YHG phases, leading the wind-geometry to approach spherical symmetry. However, the data we present here shows that IRC +10420 still has significant residual wind-axisymmetry even after its recent outbursts. Combined with its continued blueward evolution, it cannot now be discounted that IRC +10420 is evolving toward a sgB[e]-like phase.
4 Summary and conclusions
This paper presents the first IFU spectroscopy of the nebula around the transitional massive star IRC +10420. The key observational results of this work can be summarized as follows:
- •
-
•
The continuum subtracted, PSF-subtracted images of H and Fe ii both trace the extended morphology of the reflection nebula as shown in the -band HST image. This supports the reflection-nebula paradigm of this object, as the star is unlikely to produce enough Lyman photons to ionize material out to the distances of the outer nebula.
-
•
The H and Fe ii lines both show a trend of decreasing equivalent width from SW to NE of about 25%, following the long-axis of the slightly flattened reflection nebula. This is in contradiction to previous observations of this star by Humphreys et al. (2002). That the behaviour of the DIBs is so uniform is strong evidence that the behaviour of H and Fe ii is real.
-
•
The velocity maps of the H and Fe ii lines appear very different, although both have an axi-symmetric geometry aligned roughly with the long-axis of the nebula.
-
•
The images in the light of the Ti ii emission do not trace the nebula morphology, in contrast to the corresponding H and Fe ii images. Indeed, the emission is apparently very close to being unresolved. This is inconsistent with the line-emission reflecting off the surrounding nebula. The line at 6680Å is broader than the one at 6718Å, possibly due to a blend with He i 6678.
We conclude that the behaviour of the H and Fe ii lines is evidence for an axi-symmetric wind geometry in IRC +10420; and that the centroid-shifts of these lines across the field are due to complex line-profiles (due to e.g. anisotropic infall or B/R variations) which appear different when viewed from different angles by the surrounding nebula. That this behaviour was missed by Humphreys et al. (2002) is likely due to the unfortunate orientation of their slit.
The Ti ii emission does not show the same behaviour as the H and Fe ii lines, in that the line-image does not trace the morphology of the reflection nebula. It is speculated that this emission may originate at the edge of the nebula, in an analogue of Car’s strontium filament, which also displays enhanced Ti ii emission. It is noted that high-resolution spectra of IRC +10420 also show the other trademark Sr filament lines of Fe i, V ii and Sr ii.
Finally, we speculate that the present-day axisymmetry we observe in IRC +10420, combined with its continued blueward evolution at constant bolometric luminosity, is evidence that the star is evolving toward the B[e] supergiant phase.
References
- Bacon et al. (1995) Bacon, R., Adam, G., Baranne, A., Courtes, G., Dubet, D., Dubois, J. P., Emsellem, E., Ferruit, P., Georgelin, Y., Monnet, G., Pecontal, E., Rousset, A., & Say, F. 1995, A&AS, 113, 347
- Bautista et al. (2002) Bautista, M. A., Gull, T. R., Ishibashi, K., Hartman, H., & Davidson, K. 2002, MNRAS, 331, 875
- Blöcker et al. (1999) Blöcker, T., Balega, Y., Hofmann, K.-H., Lichtenthäler, J., Osterbart, R., & Weigelt, G. 1999, A&A, 348, 805
- Chentsov et al. (1999) Chentsov, E. L., Klochkova, V. G., & Tavolganskaya, N. S. 1999, Bull. Special Astrophys. Obs., 48, 25
- de Jager (1998) de Jager, C. 1998, A&A Rev., 8, 145
- Diamond et al. (1983) Diamond, P. J., Norris, R. P., & Booth, R. S. 1983, A&A, 124, L4
- Dwarkadas & Owocki (2002) Dwarkadas, V. V. & Owocki, S. P. 2002, ApJ, 581, 1337
- Frank et al. (1995) Frank, A., Balick, B., & Davidson, K. 1995, ApJ, 441, L77
- Giguere et al. (1976) Giguere, P. T., Woolf, N. J., & Webber, J. C. 1976, ApJ, 207, L195
- Hartman et al. (2004) Hartman, H., Gull, T., Johansson, S., Smith, N., & HST Eta Carinae Treasury Project Team. 2004, A&A, 419, 215
- Humphreys et al. (2002) Humphreys, R. M., Davidson, K., & Smith, N. 2002, AJ, 124, 1026
- Humphreys et al. (1997) Humphreys, R. M., Smith, N., Davidson, K., Jones, T. J., Gehrz, R. T., Mason, C. G., Hayward, T. L., Houck, J. R., & Krautter, J. 1997, AJ, 114, 2778
- Irvine & Herbig (1986) Irvine, C. E. & Herbig, G. H. 1986, IAU Circ., 4286, 1
- Jones et al. (1993) Jones, T. J., Humphreys, R. M., Gehrz, R. D., Lawrence, G. F., Zickgraf, F.-J., Moseley, H., Casey, S., Glaccum, W. J., Koch, C. J., Pina, R., Jones, B., Venn, K., Stahl, O., & Starrfield, S. G. 1993, ApJ, 411, 323
- Klochkova et al. (2002) Klochkova, V. G., Yushkin, M. V., Chentsov, E. L., & Panchuk, V. E. 2002, Astronomy Reports, 46, 139
- Lipman et al. (2000) Lipman, E. A., Hale, D. D. S., Monnier, J. D., Tuthill, P. G., Danchi, W. C., & Townes, C. H. 2000, ApJ, 532, 467
- Maeder & Meynet (2000) Maeder, A. & Meynet, G. 2000, A&A, 361, 159
- Mutel et al. (1979) Mutel, R. L., Fix, J. D., Benson, J. M., & Webber, J. C. 1979, ApJ, 228, 771
- Myers et al. (2003) Myers, R. M., Longmore, A. J., Benn, C. R., Buscher, D. F., Clark, P., Dipper, N. A., Doble, N., Doel, A. P., Dunlop, C. N., Gao, X., Gregory, T., Humphreys, R. A., Ives, D. J., & Øestensen. 2003, in Presented at the Society of Photo-Optical Instrumentation Engineers (SPIE) Conference, Vol. 4839, Adaptive Optical System Technologies II. Edited by Wizinowich, Peter L.; Bonaccini, Domenico. Proceedings of the SPIE, Volume 4839, pp. 647-658 (2003)., ed. P. L. Wizinowich & D. Bonaccini, 647–658
- Oudmaijer (1998) Oudmaijer, R. D. 1998, A&AS, 129, 541
- Oudmaijer et al. (1994) Oudmaijer, R. D., Geballe, T. R., Waters, L. B. F. M., & Sahu, K. C. 1994, A&A, 281, L33
- Oudmaijer et al. (1996) Oudmaijer, R. D., Groenewegen, M. A. T., Matthews, H. E., Blommaert, J. A. D. L., & Sahu, K. C. 1996, MNRAS, 280, 1062
- Porter & Rivinius (2003) Porter, J. M. & Rivinius, T. 2003, PASP, 115, 1153
- Smith et al. (2006) Smith, N., Brooks, K. J., Koribalski, B. S., & Bally, J. 2006, ApJ, 645, L41
- Smith et al. (2003) Smith, N., Davidson, K., Gull, T. R., Ishibashi, K., & Hillier, D. J. 2003, ApJ, 586, 432
- Smith et al. (2004) Smith, N., Vink, J. S., & de Koter, A. 2004, ApJ, 615, 475
- Zethson et al. (2001) Zethson, T., Gull, T. R., Hartman, H., Johansson, S., Davidson, K., & Ishibashi, K. 2001, AJ, 122, 322
- Zickgraf et al. (1986) Zickgraf, F.-J., Wolf, B., Leitherer, C., Appenzeller, I., & Stahl, O. 1986, A&A, 163, 119