1–10
Mapping the distribution of luminous and dark matter in strong lensing galaxies
Abstract
We present the distribution of luminous and dark matter in a set of strong lensing (early-type) galaxies. By combining two independent techniques – stellar population synthesis and gravitational lensing – we can compare the baryonic and dark matter content in these galaxies within the regions that can be probed using the images of the lensed background source. Two samples were studied, extracted from the CASTLES and SLACS surveys. The former probes a wider range of redshifts and allows us to explore the mass distribution out to . The high resolution optical images of the latter (using HST/ACS) are used to show a pixellated map of the ratio between total and baryonic matter. We find dark matter to be absent in the cores of these galaxies, with an increasing contribution at projected radii . The slopes are roughly compatible with an isothermal slope (better interpreted as an adiabatically contracted NFW profile), but a large scatter in the slope exists among galaxies. There is a trend suggesting most massive galaxies have a higher content of dark matter in the regions probed by this analysis.
keywords:
gravitational lensing; galaxies: elliptical and lenticular, cD; galaxies: halos; galaxies: stellar content; cosmology: dark matter1 Introduction
The standard paradigm of galaxy formation rests on the concept of the dark matter halo as the building block of structure. This dark matter halo dominates the mass content – with the cosmological ratio between baryonic and dark matter around 1/6 ([Spergel et al. (2007), Spergel et al. 2006]) – although this primordial ratio will change because of the “baryon” physics that can drive infall or outflows of baryons towards/away from the central regions.
The presence of dark matter on galaxy scales is best shown by the rotation curves of disk galaxies. These galaxies feature a coherent rotational motion (i.e. dynamically “cold” systems) with a prominent flat portion in the outer regions away from where most of the baryons live (see e.g. [Sofue & Rubin (2001), Sofue & Rubin 2001]).
On the other hand, the halos of elliptical galaxies are harder to study as the dynamics of these systems is “hot”, i.e. mainly supported by velocity dispersion. The dynamics of elliptical galaxies suggests a formation process from major mergers which erases the coherent motion from disk-like progenitors, creating a smooth, concentrated distribution of stars supported by pressure. In a cold dark matter scenario, the most massive elliptical galaxies should assemble at late times, in stark contrast with the overall coeval, homogeneously old and metal rich stellar populations found throughout early-type galaxies (see e.g. [Trager et al. (2000), Trager et al. 2000]). Furthermore, element-to-Fe abundance ratio studies suggest the high metallicity stellar populations are not only formed at early times but over a very short period, comparable with the dynamical timescale for the collapse of a mass corresponding to a giant elliptical galaxy. Simple back-of-the-envelope estimates applied to recent datasets ([Lintott, Ferreras & Lahav (2006), Lintott et al. 2006]) still support the old idea of early collapse of [Larson (1975)].
Detailed kinematic analyses such as those from the SAURON collaboration have shown interesting features such as kinematically decoupled cores – which would suggest a recent merger – in galaxies otherwise populated by an old and very homogeneous stellar population – which would suggest no star formation ([Davies et al. (2001), Davies et al. 2001]). The complexity of the “baryon physics” controlling galaxy formation prevents us from getting an accurate picture using ab initio modelling. It is therefore of paramount importance to understand the structure of the halos of early-type galaxies. In this paper we present ongoing research on the resolved structure of the dark matter halos of early-type systems using a combination of gravitational lensing and stellar population synthesis.
2 Measuring total masses in elliptical galaxies
2.1 Stellar kinematics
The spectral absorption features of the stellar populations can be used to determine the line-of-sight velocity dispersion (). The first-order result one can get is a luminosity-weighted measure () which leads to a rough estimate of the total mass, namely: that happens to give a good approximation to more sophisticated modelling ([Cappellari et al. (2006), Cappellari et al. 2006]).
A proper comparison with dynamical models require knowledge of the radial profile . The observations are compared with models that parametrise the galaxy as a halo density distribution (commonly a NFW profile) and a baryonic density distribution (a Hernquist profile for early-type galaxies). This distribution is used to solve for the profile of the velocity dispersion using Jeans’ equation, with assumptions made about the anisotropy of the velocity dispersion tensor – see [Mamon & Lokas (2005)] for a detailed analysis.
2.2 Planetary Nebulæ
Planetary nebulae (PNe) in the outer regions of galaxies can be used as dynamical tracers of the gravitational potential well. Given that PNe are just evolved stars, one can consider them as unbiased tracers. The characteristic emission lines of PNe can be used to select these stars in the outskirts of galaxies. The kinematics can be obtained directly from the Doppler shifted lines. The Planetary Nebula Spectrograph (PN.S; [Douglas et al. (2002)]) has exploited this feature to target several nearby early-type galaxies. The first results ([Romanowsky et al. (2003), Romanowsky et al. 2003]) have revealed decreasing velocity dispersion profiles. The inferred mass-to-light ratios out to are low enough to be explained only by the stellar mass content.
This claim has been challenged by [Dekel et al. (2005)], who claim that the PNe observed in the outskirts are biased tracers of the halo and preferentially lie on orbits with higher anisotropy. However, non-isotropic orbits can still be accommodated within a model with little dark matter within (e.g. [Douglas et al. (2007), Douglas et al. 2007]) In this symposium, the contribution by Napolitano has presented the latest work done by the PN.S team.
2.3 X-rays
Elliptical galaxies are surrounded by a tenuous hot gas which makes the galaxy bright in X-rays from bremsstrahlung. This has been traditionally the observable used to probe the mass in elliptical galaxies out to distances well away from the optical size. X-ray observations give the projected radial profile in density and temperature of this hot gas. Hydrostatic equilibrium and spherical symmetry are invoked in order to determine the total mass of the galaxy. This method is of course biased towards galaxies bright enough in X-rays to have an accurate measure of the radial profiles. Masses determined this way result in mass-to-light ratios (see e.g. [O’Sullivan & Ponman, O’Sullivan & Ponman 2004]; [Loewenstein & Mushotzky (2003), Loewenstein & Mushotzky 2003]) which require a dominant contribution from dark matter.
The X-ray measurements are in remarkable contrast with the PNe estimates discussed above – which are extended out to similar distances, i.e. . Systematic effects could be related either to the method employed in translating the observations into actual masses, or to the way the sample is selected. For the method based on PNe, one needs to select targets close enough for the PN.S instrument. On the other hand, X-ray measurements must target X-ray bright galaxies, which will bias the sample towards massive systems.
2.4 Globular Clusters
Another method currently used to determine the masses of early-type galaxies consists of a kinematic analysis of their globular cluster system. This method is complementary to the PNe studies but one must consider whether globular clusters are indeed unbiased tracers of the gravitational potential (cf. [Prieto & Gnedin (2006), Prieto & Gnedin 2006]).
Recent estimates of the mass of NGC4636 ([Schuberth et al. (2006), Schuberth et al. 2006]) give values of compared to a factor of two higher values using X-rays ([Loewenstein & Mushotzky (2003), Loewenstein & Mushotzky 2003]). However, from galaxy to galaxy the radial profile of velocity dispersion of GCs show a wide scatter, with some galaxies presenting a decreasing trend with radius, analogous to PNe studies ([Romanowsky (2006), Romanowsky 2006]).
2.5 Strong gravitational lensing
Gravitational lensing relies on a very different physical effect from the above, which is the deflection of light from a background source by radians, where is the projected mass enclosed within projected radius . By a happy coincidence, for galaxies at , the deflection is about right to produce multiple images of sources that are directly behind. Notice that while strong lensing depends on projected quantities, the deflection angle (and hence the image separations) scale in the same way as the velocity variance. As a result lensing as a mass tracer is not dissimilar to stellar kinematics.
There is a large literature on detailed modelling of lenses. One strategy is to fit to a parametrized model based on stellar dynamics. This technique goes back to the very first lens-modelling paper ([Young et al. (1981), Young et al. 1981]) but in recent years has seen progressively more complex parametric forms ([Bernstein & Fischer (1999), e.g., Bernstein & Fischer 1999]). The most commonly used parametric model families are described in [Keeton (2001)], with fitting implemented in the associated GRAVLENS software. Other techniques are multipole expansions ([Trotter et al. (2000), Trotter et al. 2000]) or free-form – non-parametric – models ([Saha & Williams (1997), Saha & Williams 1997]). The latter have seen increased popularity in recent years (e.g. [Diego et al. (2005), Diego et al. 2005]; [Koopmans (2005), Koopmans 2005]; [Suyu & Blandford (2006), Suyu & Blandford 2006]).
The main difficulty in lens modelling is that the models are highly non-unique. The enclosed mass within the region of the images is usually very well-constrained, and likewise the direction of the ellipticity, but the steepness of the radial profile is extremely model-dependent. This was first noted by [Kochanek (1991)], and has been increasingly reinforced by later modelling work, and why this kind of model-dependence should arise can be understood by considering qualitative aspects of lensing theory ([Saha & Williams (2003), Saha & Williams 2003]). The problem of model degeneracies has led to techniques involving large ensembles of models to explore those degeneracies. Of these techniques, the method of pixelated model ensembles introduced by [Williams & Saha (2000)] and subsequently made available in the PixeLens software ([Saha & Williams (2004), Saha & Williams 2004]) is the one used in the present work. Similar ideas using parametric models have also been developed ([Keeton & Winn (2003), Keeton & Winn 2003]).
3 Non-parametric lensing estimates
Our analysis of the surface mass density is done using a well-developed and tested non-parametric method that uses the image positions of the background source and their time delays – whether available – to generate an ensemble of pixellated mass maps of the lensing galaxy. A few – very mild – constraints are further imposed on the generated models, namely:
-
•
The gradient of the surface mass density should point within 45o towards the centre.
-
•
No pixel shall have more than twice the surface density of its neighbours (except for the central pixel, which is unconstrained).
-
•
The radial density gradient must be steeper than .
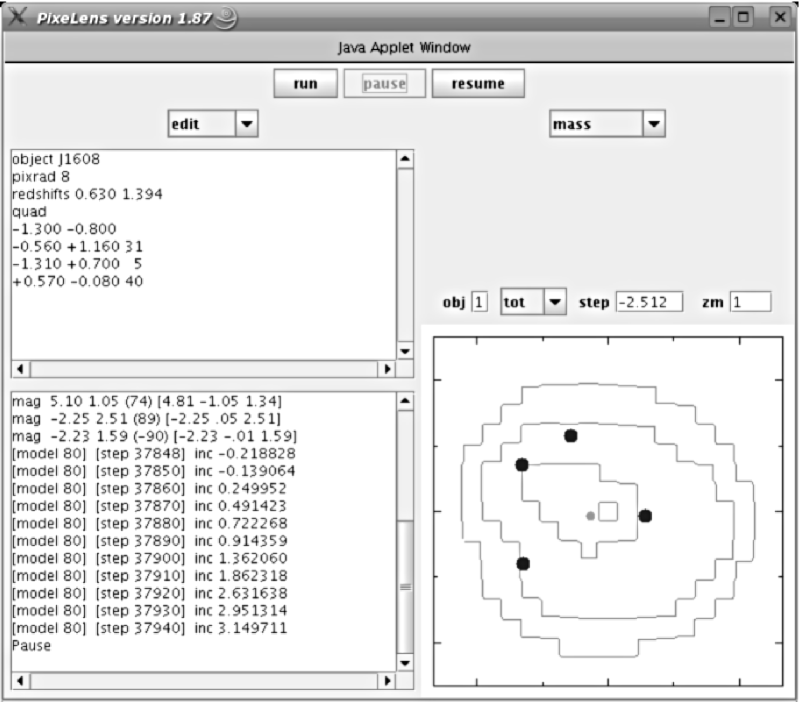
The ensemble is used to determine the probability distribution function of the pixellated surface mass density. We refer the reader to [Saha & Williams (2004)] for a detailed analysis of this method. We emphasize that only the positions and time delays are used to constrain the surface mass density. We assume the background source to be a point-like object and we do not explore the issue of flux ratios between the images.
This method has been written as a Java-based application – PixeLens – with a user friendly interface. PixeLens can be run as an applet from a web browser (see figure 1).
4 Measuring stellar masses
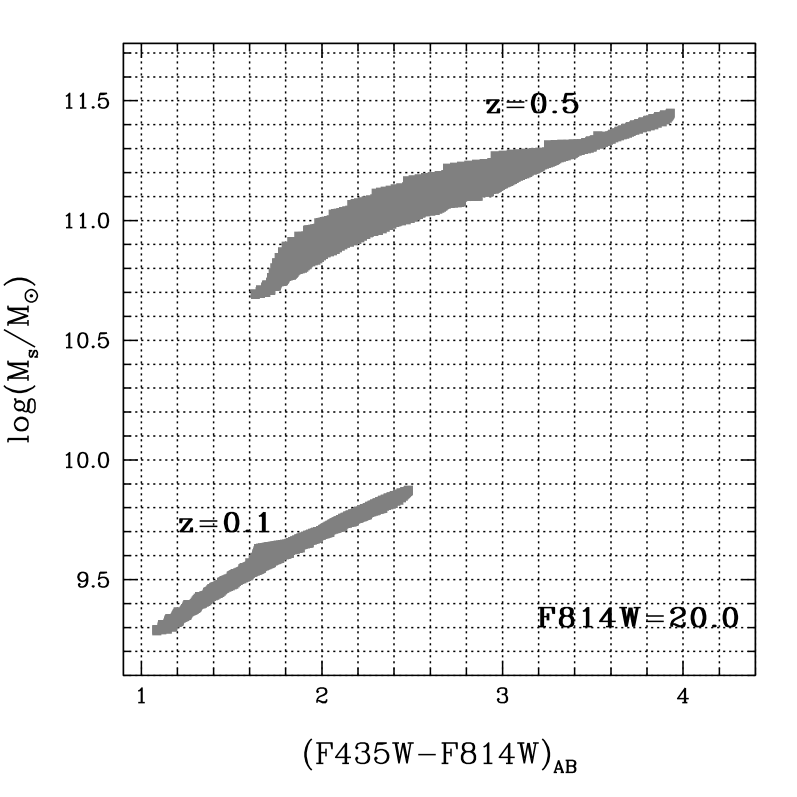
Stellar masses are calculated from the (optical and/or NIR) photometry of the lenses. In both samples high resolution followup imaging is available from the Hubble Space Telescope. The lenses were observed in at least two filters, which allows us to determine the mass-to-light ratio of the underlying stellar populations. Figure 2 shows our methodology for stellar mass estimates. The grey areas span the allowed regions in a colour-stellar mass diagram for a wide range of models (exponentially decaying star formation history). The composite populations are obtained from the stellar population synthesis models of [Bruzual & Charlot (2003)], taking a [Chabrier (2003)] IMF. A wide range of ages and metallicities are considered (see [Ferreras, Saha & Williams (2005), Ferreras et al. 2005] for details). Even though the inherent degeneracies with broadband photometry prevent us from extracting ages and metallicities, we can nevertheless determine the M/L ratio with acceptable uncertainty. Figure 2 corresponds to a F814W=20 galaxy at redshifts z=0.1 (bottom region) or z=0.5. The stellar masses are determined with a 0.2–0.3 dex uncertainty.
5 The sample
The lensing galaxies presented here were extracted from CASTLES111CASTLES webpage: http://cfa-www.harvard.edu/castles (CfA-Arizona Space Telescope Lens Survey; [Rusin et al. (2003)), Rusin et al. 2003]) and from SLACS222SLACS webpage: http://www.slacs.org (Sloan Lens ACs Survey; [Bolton et al. (2006), Bolton et al. 2006]). The former targeted a sample of known lensing system with the Hubble Space Telescope both in the optical and NIR. SLACS used the Sloan Digital Sky Survey to systematically look for nebular emission lines at higher redshift than the targeted galaxies, which were selected based on the redshift dependence of the cross section to strong lensing. The candidates were subsequently imaged with HST/ACS. The CASTLES dataset spans a wider range of redshifts and the lensing galaxies can be explored out to larger radii, in some cases out to . Our analysis of a subset of 18 CASTLES lenses can be found in [Ferreras, Saha & Williams (2005)] whereas the detailed analysis of 9 SLACS will be published soon (Ferreras, Saha & Burles, submitted).
6 Dark Matter vs. Baryonic Matter in elliptical galaxies
For the sample of lensing galaxies described above we compute the total surface mass density with PixeLens using a reasonable pixel size (typically pixels for the region over which masses can be reliably determined). The optical and NIR (if available) images are then used to determine the surface brightness and colors within a given PixeLens pixel. The colours are compared with a large grid of models as explained above, spanning a range of formation epochs (), star formation timescales (Gyr) and metallicities (). We refer the interested reader to [Ferreras, Saha & Williams (2005)] and references therein for details of the process. The total and stellar mass maps are subsequently registered and compared.
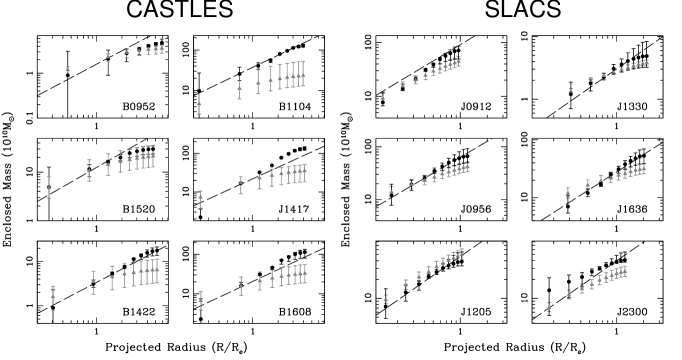
Figure 3 shows the radially averaged cumulative profiles in stellar (grey triangles) and total mass (black dots). The error bars are shown at the 90% confidence level. The radial distance is expressed as a ratio with the effective radius. The dashed line in all panels correspond to an isothermal profile, i.e. the projection of a spherically symmetric distribution with density . The slopes – which can be interpreted as an adiabatically contracted NFW profile from the effect of the collapse of the baryons – are in agreement with previous work using parametric methods (e.g. [Rusin et al. (2003)), Rusin et al. 2003];[Koopmans et al.(2006), Koopmans et al. 2006]). Our method takes the uncertainties fully into account, showing that such lens systems cannot be used to robustly infer the slope of the density profile. Having sources at multiple redshifts can break the degeneracies and constrain the profiles extremely well ([Saha et al. (2006), Saha et al. 2006]), but this is a luxury available in a very few rich clusters, and no known galaxies so far.
The CASTLES galaxies shown in the figure are subdivided into low-mass (leftmost panels) and high-mass systems. Notice the significant difference between the profiles in these two subsets. The dark matter contribution in the halos of massive galaxies is larger than in lower mass galaxies. This point will be discussed below.
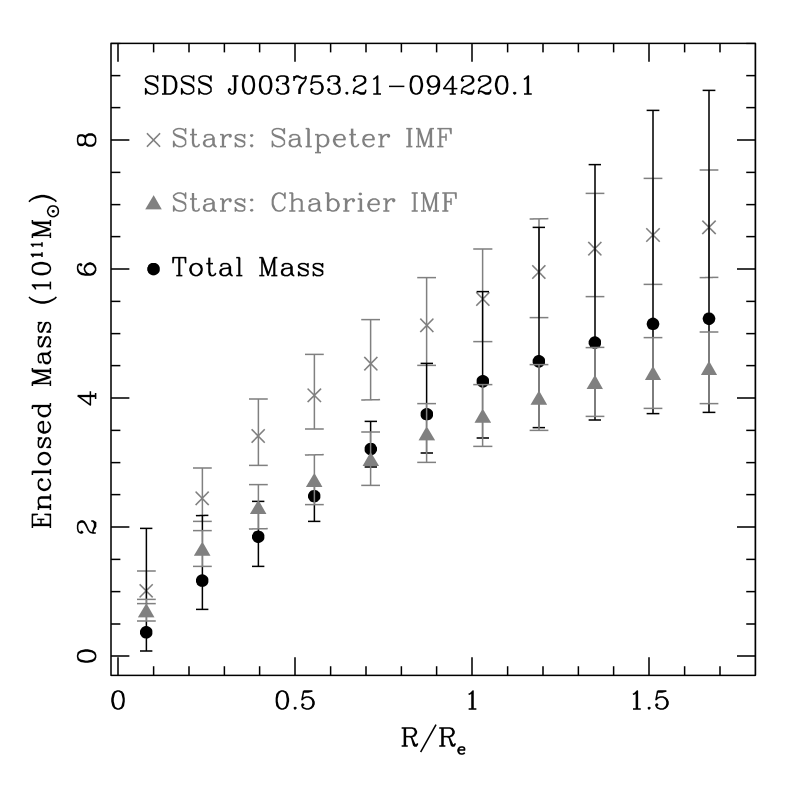
Figure 4 compares the stellar masses predicted by a different initial mass function (IMF). By default, we use the [Chabrier (2003)] IMF which is a realistic approximation both at the low- and the high-mass ends. A [Salpeter (1955)] IMF describes the mass function by a single power law across the full 0.1-100 stellar mass range. This approximation has been widely used in studies of stellar populations. A single power law is a valid approximation when exploring stars at the high-mass end. Low mass stars contribute very little to the total luminosity of the population but they can contribute very significantly to the total stellar mass when assuming an extrapolation of the Salpeter power law down to the threshold of hydrogen core burning (). Hence, photo-spectroscopic data from unresolved populations cannot reliably constrain the slope at low masses.
Observations of the local stellar census suggest a turnoff from a power law at masses above to a lognormal distribution below ([Chabrier (2003), Chabrier 2003]). Furthermore, theoretical arguments ([Larson (2006), Larson 2006]) also hint at a characteristic mass scale in the IMF which depends on the physics of the collapse. At the high mass end, a power law can be justified if massive stars form by scale-free accretion in dense environments. Our comparison of stellar and total mass rules out a Salpeter IMF as illustrated in figure 4. This result is in agreement with recent work by the SAURON group ([Cappellari et al. (2006), Cappellari et al. 2006]). We emphasize that the total mass (lensing) and the stellar mass content are calculated from independent observables. The former ONLY uses the image positions and time delays and the latter uses the photometry of the lensing galaxy. The fact that we can tackle the issue of the stellar IMF illustrates that the systematic uncertainties of the combination of lensing and stellar mass estimates must be small.
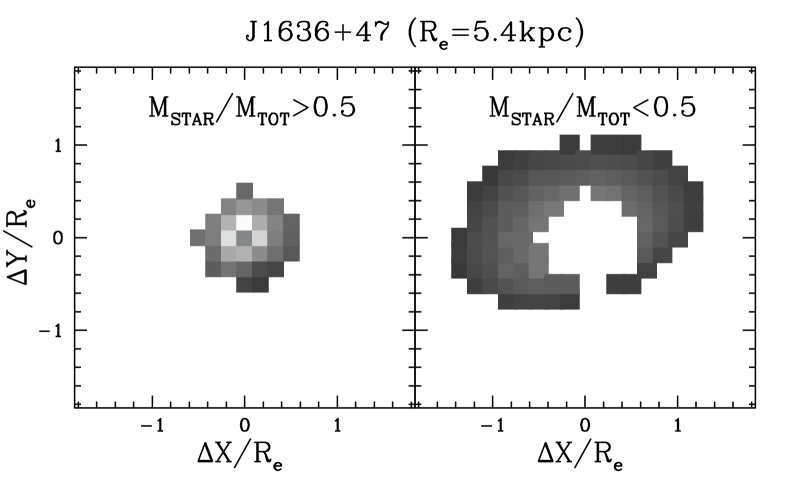
Our lensing analysis of the SLACS galaxies do not extend further than –. However, the lower redshift of these galaxies allows us to perform a detailed 2D map of the contribution of dark matter. In an upcoming paper (Ferreras, Saha & Burles, submitted) we present false colour maps of the nine galaxies studied from SLACS. Figure 5 shows in greyscale the mass map of lens J1636+47 (z=0.23). The greyscale corresponds to the total surface mass density, and the projected scale is given as a fraction of the effective radius (kpc). We divide the map into two regions. The panel on the left shows the region where i.e. mostly dominated by baryons, whereas the panel on the right shows the region dominated by dark matter. As expected, the core is dominated by baryons – as seen in the radial profiles of figure 3 – and the transition takes place at around . In Ferreras, Saha & Burles we perform an analysis of the mass distribution of the SLACS lenses and find that in all galaxies the ellipticity of the baryonic and total surface mass density distributions do not differ significantly.
7 Conclusions
Strong gravitational lensing works as a very powerful – albeit restricted – “dark matter” telescope which can give us very valuable clues about the process of galaxy formation within halos. Unfortunately one cannot apply for “dark matter telescope time” to observe a specific sample, and one can only take what Nature gives: galaxies that happen to lie along the line of sight towards bright background sources. Nevertheless, the growing number of strong lenses observed in detail by HST has allowed us to determine in some detail the dark matter distribution in massive early-type galaxies.
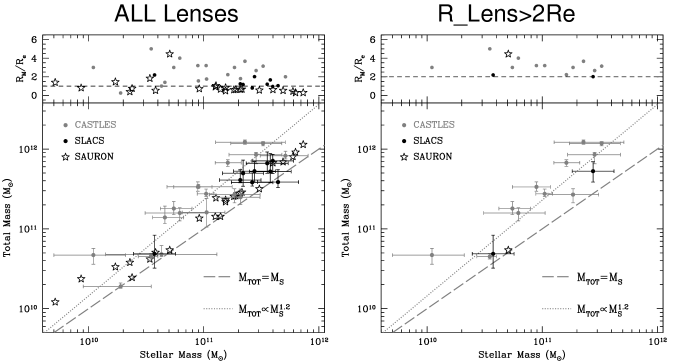
Figure 6 shows the stellar vs. total mass measured within our lensing radius (). This lensing radius is the extent over which the surface mass density can be reliably measured using the positions of the images of the background source. The top panel shows with respect to the effective radius. Our CASTLES and SLACS samples are shown along with the recent estimates from the SAURON group ([Cappellari et al. (2006), Cappellari et al. 2006]). The dashed line is a 1:1 mapping between total and stellar mass (i.e. no dark matter required). The dashed line is NOT a fit, but the trend that could explain the tilt of the Fundamental Plane (see e.g. [Ferreras & Silk (2000), Ferreras & Silk 2000]). This tilt cannot be accounted for simply by stellar populations and in our case a variation of the dark matter contribution would be invoked. The panel on the left shows what a “mixed bag” the sample is. The SAURON data mostly probe the inner regions, seldom extending out of . Similarly, our lower-redshift sample (from SLACS) also probes the inner parts of galaxies. On the right hand panel, we only show those galaxies for which the analysis extends at least out to . One can see that the trend suggested by the dotted line could be a reasonable fit to the data points (undoubtedly with a large scatter). We conclude this paper by suggesting that this is a trend that can explain the apparent mismatch between the mass estimates gathered using either PNe or X-ray light. A selection of galaxies using the latter technique will bias the sample in favour of massive systems, which we claim to be more dominated by dark matter. On the other hand, lower mass galaxies – more likely to be observed by the PNe studies which can only target nearby systems – will have a smaller contribution from dark matter in the inner regions. Recent work by Napolitano and collaborators (see contribution in these proceedings) targeting more massive galaxies with the PNe method seem to favour this point.
References
- [Bernstein & Fischer (1999)] Bernstein, G. & Fischer, P. 1999, AJ 118, 14
- [Bolton et al. (2006)] Bolton, A., et al. 2006, ApJ 638, 703
- [Bruzual & Charlot (2003)] Bruzual, G. & Charlot, S. 2003, MNRAS 344, 1000
- [Cappellari et al. (2006)] Cappellari, M., et al. 2006, MNRAS 366, 1126
- [Chabrier (2003)] Chabrier, G. 2003 PASP 115, 763
- [Davies et al. (2001)] Davies, R.L. et al. 2001 Ap.J.Lett. 548, L33
- [Dekel et al. (2005)] Dekel, A. et al. 2005, Nature 437, 707
- [Diego et al. (2005)] Diego, J. M. et al. 2005, MNRAS 362, 1247
- [Douglas et al. (2002)] Douglas, N. G. et al. 2002, PASP, 114, 1234
- [Douglas et al. (2007)] Douglas, N. G. et al. 2007, ApJ, 664, 257
- [Ferreras & Silk (2000)] Ferreras, I. & Silk, J. 2000, MNRAS, 316, 786
- [Ferreras, Saha & Williams (2005)] Ferreras, I., Saha, P. & Williams, L.L.R. 2005, Ap.J.Lett. 623, L5
- [Keeton (2001)] Keeton, C. R. 2001, arXiv astro-ph/0102341
- [Keeton & Winn (2003)] Keeton, C. R. & Winn, J. N. 2003, ApJ 590, 39
- [Kochanek (1991)] Kochanek, C. S. 1991, ApJ 373, 354
- [Koopmans (2005)] Koopmans, L. V. E. 2005, MNRAS 363, 1136
- [Koopmans et al.(2006)] Koopmans, L. V. E., et al. 2006, ApJ 649, 599
- [Larson (1975)] Larson, R. B. 1975, MNRAS 173, 671
- [Larson (2006)] Larson, R. B. 2006, Rev.Mex.AA. 26, 55
- [Lintott, Ferreras & Lahav (2006)] Lintott, C.J., Ferreras, I. & Lahav, O. 2007, Ap.J. 648, 826
- [Loewenstein & Mushotzky (2003)] Loewenstein, M. & Mushotzky, R. 2003, Nuc.Phys.S. 124, 91
- [Mamon & Lokas (2005)] Mamon, G. A. & Lokas, E. L. 2005, MNRAS 363, 705
- [O’Sullivan & Ponman] O’Sullivan, E. & Ponman, T. 2004, MNRAS 354, 935
- [Prieto & Gnedin (2006)] Prieto, J. L. & Gnedin, O. Y. 2006, arXiv astro-ph/0608069
- [Romanowsky et al. (2003)] Romanowsky, A. J. et al. 2003, Science 301, 1696
- [Romanowsky (2006)] Romanowsky, A. J. 2006, arXiv astro-ph/0609251
- [Rusin et al. (2003))] Rusin, D. et al. 2003, ApJ 587, 143
- [Saha & Williams (1997)] Saha, P. & Williams L. L. R. 1997, MNRAS 292, 148
- [Saha & Williams (2003)] Saha, P. & Williams L. L. R. 2003, AJ 125, 2769
- [Saha & Williams (2004)] Saha, P. & Williams L. L. R. 2004, AJ 127, 2604
- [Saha et al. (2006)] Saha, P., Read, J. I. & Williams, L. L. R. 2006, ApJLett 652, L5
- [Salpeter (1955)] Salpeter, E. E. 1955, ApJ 121, 161
- [Schuberth et al. (2006)] Schuberth, Y. et al. 2006, A&A 459, 391
- [Sofue & Rubin (2001)] Sofue, Y. & Rubin, V. 2001, ARA&A 39, 137
- [Spergel et al. (2007)] Spergel, D. et al. 2007, Ap.J.Suppl. 170, 377
- [Suyu & Blandford (2006)] Suyu, S. H. & Blandford, R. D. 2006, MNRAS 366, 39
- [Trager et al. (2000)] Trager, S. C. et al. 2000, AJ 120, 165
- [Trotter et al. (2000)] Trotter, C. S., Winn, J. N. & Hewitt, J. N. 2000, ApJ 535, 671
- [Williams & Saha (2000)] Williams, L. L. R. & Saha, P. 2000, AJ 119, 439
- [Young et al. (1981)] Young, P. et al. 1981, ApJ 244, 736