Galaxy growth in the concordance CDM cosmology
Abstract
We use galaxy and dark halo data from the public database for the Millennium Simulation to study the growth of galaxies in the De Lucia et al. (2006) model for galaxy formation. Previous work has shown this model to reproduce many aspects of the systematic properties and the clustering of real galaxies, both in the nearby universe and at high redshift. It assumes the stellar masses of galaxies to increase through three processes, major mergers, the accretion of smaller satellite systems, and star formation. We show the relative importance of these three modes to be a strong function of stellar mass and of redshift. Galaxy growth through major mergers depends strongly on stellar mass, but only weakly on redshift. Except for massive systems, minor mergers contribute more to galaxy growth than major mergers at all redshifts and at all stellar masses. For galaxies significantly less massive than the Milky Way, star formation dominates the growth at all epochs. For galaxies significantly more massive than the Milky Way, growth through mergers is the dominant process at all epochs. At a stellar mass of , star formation dominates at and mergers at later times. At every stellar mass, the growth rates through star formation increase rapidly with increasing redshift. Specific star formation rates are a decreasing function of stellar mass not only at but also at all higher redshifts. For comparison, we carry out a similar analysis of the growth of dark matter halos. In contrast to the galaxies, growth rates depend strongly on redshift, but only weakly on mass. They agree qualitatively with analytic predictions for halo growth.
keywords:
galaxies: merger rate – galaxies: mass accretion rate – galaxies: star formation – cosmology: dark matter – cosmology: large-scale structure1 Introduction
Galaxy mergers play an important role in galaxy formation and evolution. They add new gas and stars. They drive gas motions which feed starbursts and central supermassive black holes, and, for comparably massive systems, they entirely restructure both galaxies. Toomre (1976) was the first to stress that the abundance of tidally distorted spirals in the nearby universe suggests that “star piles” produced by past interactions might account for the majority of observed elliptical galaxies. White (1978) carried out the first dynamically consistent 3-dimensional simulations showing that mergers do indeed produce remnants with a structure similar to that of ellipticals, a conclusion which has been reinforced by increasingly realistic simulations of purely stellar systems (Farouki & Shapiro, 1982; Barnes, 1988; Naab & Burkert, 2003). Inclusion of the gas component showed that a substantial fraction of the interstellar medium should be driven to the centre in major mergers (Negroponte & White, 1983; Barnes & Hernquist, 1991; Mihos & Hernquist, 1996). This work supported the identification of ultraluminous infrared galaxies as merging systems (Sanders et al., 1988) but led to remnant galaxies with cores which are denser than observed ellipticals. Recent work suggests that this contradiction may be resolved by strong AGN- or starburst-generated winds which expel a large fraction of the gas from the galaxy (Springel et al., 2005a; Di Matteo et al., 2005). Work on mergers of unequal galaxies suggests that while such mergers may not greatly alter the structure of the larger system (Velazquez & White, 1999; Abadi et al., 2003) they can nevertheless stimulate substantial rearrangements of its gas with associated star formation and AGN activity (Mihos & Hernquist, 1994).
In the standard CDM cosmology structure forms hierarchically. Small dark matter halos form first and then aggregate into progressively larger systems. At any given time cosmic matter is distributed over nonlinear objects spanning many decades in mass, and growth is driven by merging with similar halos, by accretion of much smaller halos and of diffuse material, and by destruction by infall onto larger halos (e.g. Lacey & Cole, 1993). The situation is made more complex by the fact that the inner cores of halos often survive as long-lived substructure within the larger objects by which they are accreted (Ghigna et al., 1998; Moore et al., 1999; Gao et al., 2004). Galaxies form at the centres of halos in the way suggested by White & Rees (1978) and are swept along with the growth of dark matter structure. They gain stars through formation from their interstellar medium, which may be replenished by infall from their surroundings, and by incorporating the stars of galaxies which merge with them. The interaction between these processes drives the overall evolution of the population and cannot be followed without treating the associated baryonic astrophysics (gas condensation, formation and evolution of stars and black holes, feedback from supernovae and AGN, chemical enrichment, production of observable radiation etc.).
Early studies of the evolution of the galaxy population embedded simplifed treatments of this baryonic physics in Monte Carlo realisations of the merger trees associated with the formation of individual dark halos (Kauffmann et al., 1993; Cole et al., 1994; Cole et al., 2000; Somerville & Primack, 1999). The spatial distribution of galaxies could then be studied using the halo distribution from an N-body simulation of structure formation (Kauffmann et al., 1997; Benson et al., 2000). Improvements on this scheme have used higher resolution N-body simulations so that the merging trees can taken directly from the simulation itself, thereby allowing the evolution of the galaxy population to be followed in a single consistent simulation (Kauffmann et al., 1999; Springel et al., 2001; Helly et al., 2003; Hatton et al., 2003; Springel et al., 2005b; Kang et al., 2005). A parallel approach has followed the dynamics of diffuse gas (in particular, aspects of the gas condensation and galactic wind processes) by adding a hydrodynamic scheme to the N-body treatment of dark matter while continuing to treat star formation and evolution by semi-analytic means (Cen & Ostriker, 1992; Navarro & White, 1994; Katz et al., 1996). The development path here has involved continual improvement of the simulation schemes to increase resolution and to treat the accessible physics more realistically (e.g. Cen & Ostriker, 2000; Springel & Hernquist, 2003; Pfrommer et al., 2006). Recent work in both approaches has focussed on how feedback from AGN may regulate the formation and evolution of their host galaxies (Springel et al., 2005a; Di Matteo et al., 2005; Croton et al., 2006; Bower et al., 2006).
This body of work has demonstrated that while galaxy mergers are an important aspect of the evolution of the galaxy population, they do not simply parallel the mergers of dark halos. As White & Rees (1978) stressed, galaxies must remain distinct after the merger of their halos if we are to understand the formation of galaxy clusters. Fall (1979) noted that late-type giant galaxies cannot have undergone recent major mergers since these would destroy their stellar disks. While many more recent studies have followed Toomre (1976) in arguing that massive elliptical galaxies assembled relatively recently through mergers (e.g. Kauffmann & Charlot, 1998; van Dokkum, 2005; De Lucia et al., 2006) other authors have used the age and uniformity of their stellar populations and their apparently undiminished abundance at high redshift to argue against such late assembly (e.g. Cimatti et al., 2006). Observational estimates of merging rates, based primarily on counts of very close pairs of galaxies, or of morphological evidence for recent merging, have varied widely due to uncertainties in the associated timescales (Le Fèvre et al., 2000; Lin et al., 2004). In addition, attempts to measure the evolution of the merger rate, usually parametrised as proportional to have obtained values for the exponent ranging from 0 to 6. (Bell et al., 2006; Carlberg et al., 2000; Patton et al., 2002; Conselice et al., 2003; Bundy et al., 2004; Lin et al., 2004).
In the present paper we analyse the build-up of the galaxy population in the galaxy formation model of De Lucia & Blaizot (2007) which is implemented on the very large Millennium Simulation (Springel et al., 2005b). This model updates that of (Croton et al., 2006) and is a reasonable match to the clustering and to many of the systematic properties of the local galaxy population. It is also consistent with most available data at high-redshift (Kitzbichler & White, 2007). For our purposes, this provides a physically consistent and observationally plausible implementation of galaxy formation within the dynamical framework of CDM. It can therefore be used to explore the differences between galaxy growth and dark halo growth in this structure formation model. We use the public database containing the properties of the dark halos and the galaxies111http://www.mpa-garching.mpg.de/millennium to construct mean growth rates for galaxies through major mergers, through minor mergers and through star-formation, each as a function of galaxy mass and of redshift, and we compare these with analogously defined growth rates for dark halos.
Our paper is organized as follows. In Sec. 2 we introduce the Millennium Run and the prescriptions used to simulate galaxy formation using merger trees built from it. Sec. 3 presents our analysis of the mass and redshift dependence both of the major merger rate and of growth rates through major and minor mergers as well as through star formation. In Sec. 4, we discuss the corresponding properties of dark halos (defined here as FOF groups) and contrast them with our results for galaxies. Conclusions and discussions are presented in Sec. 5.
2 The simulation and the galaxy formation model
The galaxy catalogue used in this paper was produced using a “hybrid ” technique: a large N-body simulation was first carried out to define the evolution of the dark matter distribution, and then a suite of semi-analytic prescriptions was implemented in order to simulate the formation and evolution of galaxies within a stored “forest” of (sub)halo merging trees constructed from the original simulation. A detailed description of the Millennium Simulation and of the galaxy formation model can be found in (Springel et al., 2005b; Croton et al., 2006; De Lucia & Blaizot, 2007). Here we summarize the main simulation characteristics and the way the halo merger trees were constructed, as well as those aspects of the galaxy formation modelling that are relevant to our study of galaxy growth.
2.1 The simulation
The Millennium Simulation (Springel et al., 2005b) used in this study is the largest simulation of cosmic structure formation so far carried out. It adopts the concordance CDM cosmology and follows particles from redshift to in a comoving box of side-length Mpc. This volume is large enough to investigate rare objects such as quasars and rich clusters of galaxies, yet, with particles, has a dark matter particle mass of only , allowing the galaxy formation model to follow the formation of all galaxies more massive than the Small Magellanic Cloud. The assumed cosmological parameters are , , , , , and , where the Hubble constant is parameterized as usual as . These parameters are consistent with a combined analysis of the 2dFGRS (Colless et al., 2001) and the first-year WMAP data (Spergel et al., 2003).
During the simulation, the full particle data were stored at 64 output times approximately logarithmically spaced from until and at approximately 200 Myr intervals thereafter. At each time, the simulation code produced a friends-of-friends group catalogue on the fly by linking together particles separated by less than 0.2 of the average interparticle separation (Davis et al., 1985). Subsequently, the SUBFIND algorithm (Springel et al., 2001) was used to divide each FOF group into a disjoint set of self-bound subhalos. These subhalos are the basis for the merger trees, which are defined by linking each subhalo from a given output time to one and only one descendent at the following output time. When studying the growth of dark halos in Sec. 4, we define a halo as an FOF group and we estimate its mass as the sum of the masses of all its subhalos. This typically loses a small amount of “diffuse” material which was bound to none of the subhalos. This is not significant for our purpose here, and this definition was convenient, since the original FOF halo mass was not stored in the (sub)halo database when we carried out this project. More importantly, this mass definition allows us to deal in a straightforward way with the problem that simulated halos, unlike our simulated galaxies or the halos considered in simplified models for halo growth, not only merge but can also fragment. Mass from a single FOF halo can thus contribute to several FOF halos at some later time.
2.2 Merger rates
In the galaxy formation models implemented on the Millennium Simulation, a galaxy begins to condense at the centre of a halo as soon as it is identified as a persistent object with more than 20 dark matter particles. As the halo grows, so does the galaxy at its centre, forming stars at a rate governed by its cold gas content and by empirically determined star formation “laws”. The halo may merge into a larger system, becoming an independent subhalo orbiting within the FOF group. The galaxy is now considered a satellite, losing its supply of fresh gas, and perhaps ceasing to form stars if it uses up its available interstellar medium. Dynamical friction effects bring the orbit of the subhalo ever closer to the centre of its parent, and tidal effects strip away its outer regions until eventually it may be disrupted entirely (or at least drop below the resolution limit of the simulation). At this point the galaxy is associated to the most-bound particle of the subhalo at the last time it was identified and is marked as a candidate for merging with the central galaxy of the parent halo. The merger takes place one estimated dynamical friction time later.
Galaxy mergers may trigger strong star formation. In the galaxy formation model of Croton et al. (2006) and De Lucia & Blaizot (2007) which we analyse here, a recipe similar to that of Somerville et al. (2001) is adopted to describe starbursts during minor mergers. In this model, a fraction of the cold gas of final galaxy is converted into stars, where
A major merger is assumed to occur whenever the two galaxies differ by a factor of less than 3 in baryonic mass. In such a merger the starburst is assumed to convert a large fraction of the cold gas into stars and to eject the rest from the galaxy. The remnant of such a merger is assumed to be an elliptical galaxy. It may, however, grow a new disk if gas is able to cool from the surrounding halo, and in this case the merged system becomes the bulge of a larger spiral galaxy.
In this galaxy formation model, central galaxies are treated differently than satellites. Only central galaxies are fed new material by cooling from the hot atmosphere of their halo, by direct infall of cold gas, or by merging of satellites. No new material accretes onto satellite galaxies, so that their star formation terminates when their cold gas is used up. Gas accretion processes depend strongly on time and on galaxy mass. At early times and in low-mass galaxies gas cools substantially more efficiently than in high-mass systems and at late times. In addition, an important innovation in the model of Croton et al. (2006) (and included here) is a treatment of “radio mode” feedback. This assumes that if the central galaxy has a supermassive black hole and sits at the centre of a static hot atmosphere, then radio activity will prevent further cooling of hot gas. This resolves the long-standing “cooling flow problem” and ensures that a massive elliptical at the centre of a group or cluster does not grow a new disk and so remains “red and dead”. As a result the only significant growth mode for high mass galaxies is through merging.
In this study, we consider all galaxies in the Millennium/DeLucia database with stellar mass between and . Although the galaxy catalogues are nearly complete to a mass at least 5 times lower than this, we want to be able to resolve the recent merging history of each system and so we adopt this more conservative limit. This choice leaves us with a total 81896686 galaxies (summed over all redshifts). To investigate the mass dependence of galaxy growth, we divide this sample into seven mass bins, each a factor of 2 wide. The highest mass bin contains the smallest number of galaxies, a total of 22827 systems.
3 Galaxy growth rates
Growth in the stellar mass of galaxies occurs through two processes: conversion of gas into stars (either quiescently or in a starburst) and the addition of stars through mergers. In this section we mine the publicly available database to study the interplay between these processes. We begin by studying how the rate of major mergers depends on the mass of the product galaxy and on redshift. We then compare mean galaxy growth rates due to this process to mean growth rates due to all mergers (major and minor) and to star formation. For each galaxy in the database at each time, we define the main progenitor at the previous stored time to be the progenitor with the largest stellar mass. If a galaxy has more than one progenitor at the earlier time, then it has undergone a merger between the two times. If of the other progenitors differ from the main progenitor by less than a factor of 3 in stellar mass, then the galaxy is assumed to have had major mergers in this time interval.
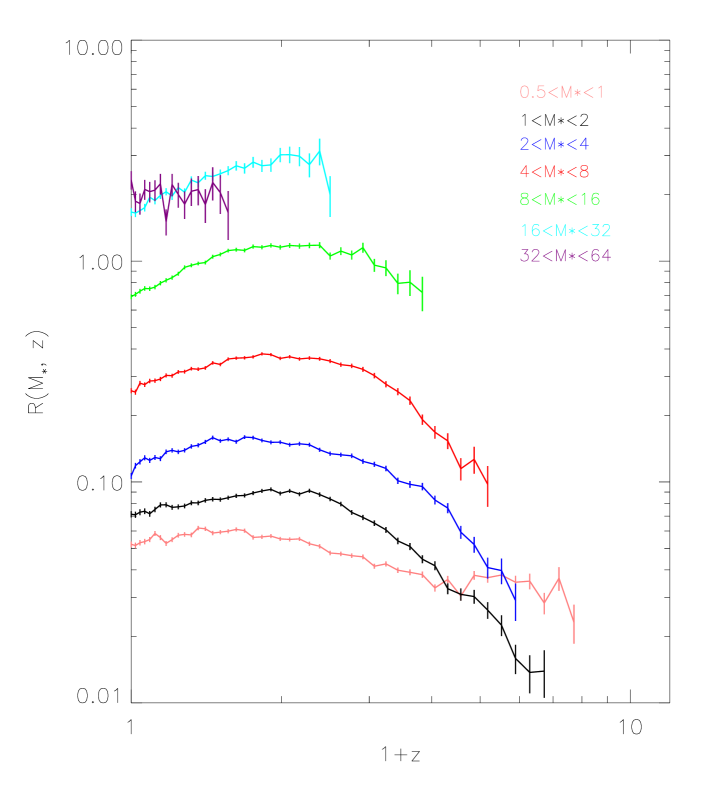
We define a dimensionless major merger rate per galaxy as a function of redshift and stellar mass through
| (1) |
where is the number of galaxies in the simulation at redshift and with stellar mass in a chosen interval centred on , is the number of these galaxies which have had a major merger since the last stored redshift (a galaxy which has had major mergers is counted times), is the time interval between and and is the age of the universe at . Hence is the fraction of galaxies of stellar mass formed per Hubble time through major mergers at redshift .
Fig. 1 shows major merger rates estimated in this way as a function of redshift for seven intervals of stellar mass, each a factor of 2 wide. We plot Poisson errors on our estimates which are determined entirely by the number of merger remnants found at each time. At low redshift () our dimensionless rate depends remarkably weakly on redshift. For large stellar mass, any variation is within the noise. For smaller there is a gentle rise (by less than a factor of 2) from low redshift out to , followed by a decline at higher redshift. On the other hand the dependence of on stellar mass is very strong. The probability of formation through major mergers is about 40 times higher for the most massive galaxies we consider than for the least massive galaxies. Galaxies comparable in mass to our Milky Way form through major mergers at a rate of about of the population per Hubble time, while for galaxies with a stellar mass the corresponding rate is about 8 times higher.
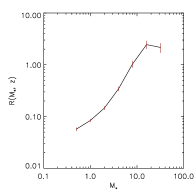
To see more clearly the stellar mass dependence of the specific rate of formation through major mergers, we plot in Fig. 2 the relation between and stellar mass. Here we have averaged the data of Fig. 1 over the redshift interval from to 0 (or, for massive galaxies, over redshifts where there are more than 15 major mergers in total). Error bars show the rms variation in the rate over the redshift range used. The relative formation rate through major mergers is approximately proportional to stellar mass , although the plot suggests a more complex behaviour with an initial steepening towards higher mass followed by a (possible) saturation at the highest mass.
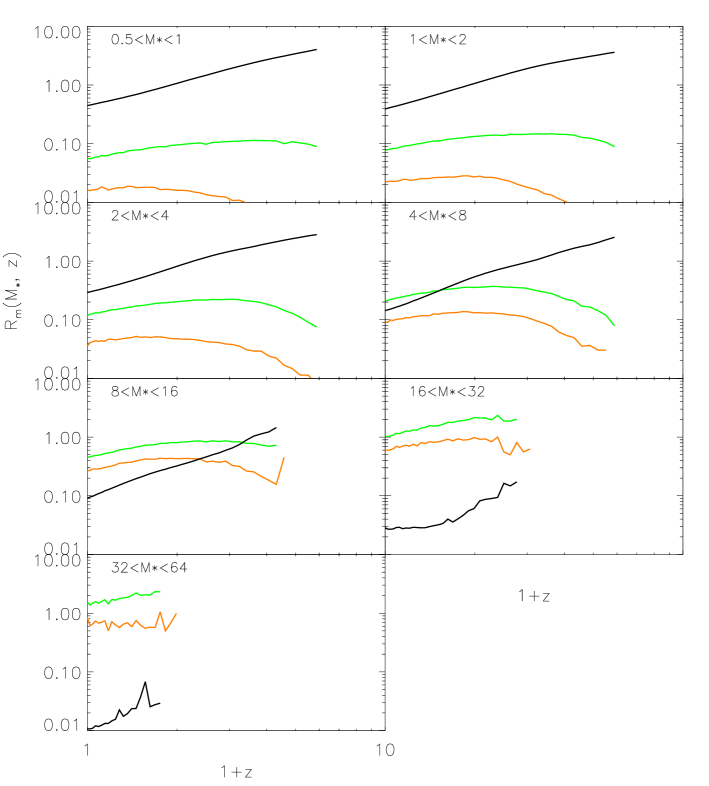
Galaxies grow not only through major mergers, but also through minor mergers and through star formation. In order to compare the relative importance of these processes, we now calculate mean growth rates for galaxies in each of these channels as a function of stellar mass and redshift. In analogy to equation (1) we define mean dimensionless growth rates due to major mergers, to all mergers and to star formation as
| (2) |
| (3) |
| (4) |
where is the total stellar mass of all galaxies at redshift with individual stellar masses in the bin centred on , and with subscripts ‘major’, ‘merger’ and ‘gas’ indicates the total stellar mass added to the main progenitors of these galaxies since the previous output time through major mergers, all mergers and star formation, respectively. This includes star formation over this time interval in all the progenitor galaxies, as well as in quiescent and in merger-related starburst modes. and have the same meaning as before. These rates represent the recent growth of galaxies prior to the time they are observed in terms of the fractional increase in their stellar mass per current Hubble time occurring in each of the three modes. For example, represents a class of galaxies whose recent average star formation rate exceeds their past average star formation rate.
In Fig. 3 we plot these growth rates as a function of redshift for the same 7 bins of stellar mass already illustrated in Fig. 1. The orange curves give the dimensionless growth rate through major mergers and so are very similar to the curves already plotted in Fig. 1. Indeed, the ratio of the two is just the average of the ratio of the stellar mass of the smaller galaxy in a major merger to the stellar mass of the merger product. Thus, the dimensionless growth of galaxies through major mergers also depends little on redshift but strongly on stellar mass (as in Fig. 2). Only for the most massive galaxies does approach unity; for galaxies of Milky Way mass it is around 10% at all redshifts.
The green curves in Fig. 3 give mean growth rates due to all mergers. For all but the more massive galaxies at the lowest redshifts, these curves lie more than a factor of 2 above the major merger curves. The difference between the two curves increases with increasing redshift in all cases. Thus, minor mergers are generally more important for increasing the stellar mass of galaxies than are major mergers. For small mass galaxies at high redshift the ratio of the two growth rates can be an order of magnitude. For galaxies with masses above (in the model this represents the classical giant elliptical population) merging dominates the growth rates at redshifts , and major mergers account for more than half of the total stellar mass growth at low redshifts. In the highest stellar mass bin the relative importance of major and minor mergers is slightly different; these objects are the Brightest Cluster Galaxies investigated in detail by De Lucia & Blaizot (2007).
Finally, the black curves in Fig. 3 give mean growth rates due to star formation as a function of redshift. These are constructed by averaging all the star formation between two output times in all the progenitors of the galaxies in each mass bin. As a result, they include quiescent star formation both in the main galaxies and in smaller galaxies which merge with them, as well merger-induced starbursts. Unlike the growth rates due to mergers, they increase monotonically and relatively steeply towards high redshift, roughly as one power of on average, although the slope decreases with redshift at low stellar mass and increases with redshift at high stellar mass. At the present day is a decreasing function of and is always below unity. Thus, galaxies of all stellar masses are, on average, currently forming stars at less than their past average rate. For galaxies of Milky Way mass, the mean star formation rate at is about 15% of the past average; this ratio drops to very small values for more massive systems.
This behaviour is well known in the real Universe and is often taken as evidence for “downsizing”; massive galaxies seem to complete most of their star formation at higher redshift than low mass systems. Somewhat surprisingly, however. this ranking of dimensionless growth rate holds at all redshifts, not just at . In this model there is no redshift at which high stellar mass galaxies are growing faster (in relative terms) than less massive systems. Except for the highest mass bin (where galaxies form almost exclusively through multiple mergers) the dimensionless growth rates due to star formation exceed unity at sufficiently high redshift for galaxies of all stellar mass. This remains true to lower redshift for lower stellar mass.
If we compare the mean growth rates due to star formation with those due to (all) mergers, we see that, except at the highest stellar masses, star formation dominates at sufficiently high redshift. This is true all the way down to for galaxies less massive than the Milky Way, but for higher mass systems mergers are the dominant growth mode at low redshift. It is interesting that the Milky Way mass, which is also approximately the characteristic stellar mass at the knee of the galaxy luminosity function, marks the boundary between the two regimes. This is not a coincidence. It is built into the model by the physical assumptions required to get a good fit to the observed galaxy luminosity function. In low-mass systems cooling is very efficient and supernova feedback has to be invoked to prevent overproduction of stars. Even with such feedback, a significant fraction of the baryonic material gained by small halos is turned into stars, and most of this accreted material is associated with objects which were too small to contain stars of their own. Hence star formation is a more effective growth mode than merging. At Milky Way mass, cooling is still efficient, particularly at early times, and supernova feedback is less effective in preventing star formation. On the other hand, much of the infalling material is in objects which are massive enough to contain substantial numbers of their own stars. Thus stellar mergers become competitive with star formation. For higher stellar masses, the model invokes “radio mode” AGN feedback to suppress cooling and star formation. The steep quasi-exponential tail of the stellar mass function is then populated almost exclusively by mergers.
4 Growth Rates for FOF groups
As discussed in Sec. 1, the relation between galaxy mergers and mergers of their host halos is less straightforward than one might expect. In this section we investigate merger and growth rates for dark halos in a way which allows direct comparison with the results presented for galaxies above. For the purposes of our study it is convenient to identify dark halos as the friends-of-friends (FOF) groups initially identified in the Millennium Simulation, and to approximate the mass of each FOF group by the sum of the masses of its identified subhalos. This loses the mass of a certain number of “diffuse” particles which are not bound to any subhalo, but this systematic is relatively small for most halos and is of no consequence for our analysis. This scheme provides a straightforward way for us to deal with the problem that simulated halos, unlike those in extended Press-Schechter models (e.g. Lacey & Cole 1993) or the galaxies discussed above, often fragment into pieces which can become parts of different halos at a later time. This means that the progenitors of an FOF halo may include only part of an earlier FOF halo. Tracking individual subhalos allows us to account for this, since the Millennium halo database is set up so that each subhalo has a unique descendent, ensuring that the progenitors of an FOF group are a unique set of subhalos which may form all or part of several FOF halos.
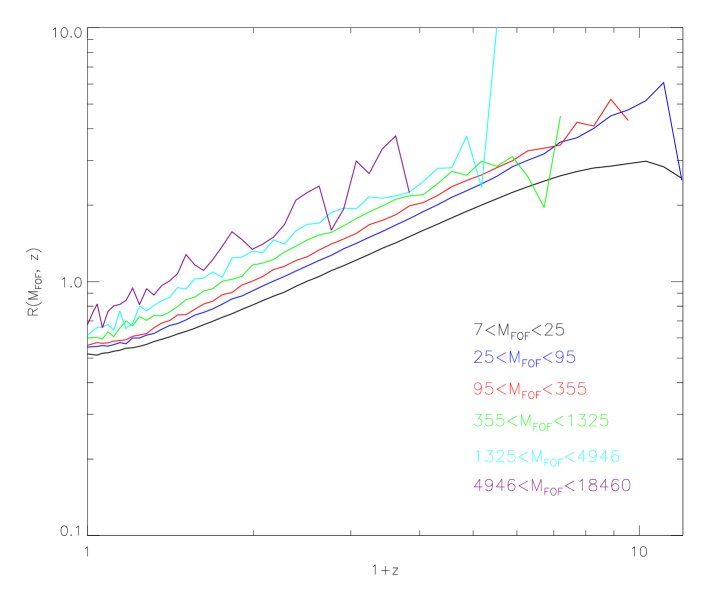
We bin the FOF groups at each redshift according to mass, with each bin spanning a factor of 3.8 in mass. The six bins for which we present results then correspond very roughly to halos whose central galaxies lie in the upper six stellar mass bins of figures 1 and 3.
In Fig 4, we plot the redshift dependence of the specific rate of formation of FOF halos through major mergers for our 6 bins of halo mass. A halo is defined to have just undergone major mergers if its progenitor subhalos at the previous output come from at least different FOF halos, and if the total subhalo mass coming from of the subdominant FOF progenitors is more than a third of that coming from the main FOF progenitor. This merger count can then be used to define a merger rate in direct analogy to equation (1). Figure 4 can be compared directly with the 6 most massive cases of Fig. 1. The behaviour is quite different, however. In Fig. 4 there is a strong and monotonic dependence of formation rate on redshift, but there is little dependence on halo mass. This is the exact contrary of what we found for galaxies, where the mass dependence was strong and the redshift dependence weak. The redshift dependence of these curves is reasonably well described as a simple proportionality to . For all masses the rates exceed unity for all but the lowest redshifts. Recall that in Fig. 1 we found the coresponding rates for galaxies to exceed unity only for the most massive systems. Major mergers are thus a much more significant growth mode for dark halos than they are for most galaxies.
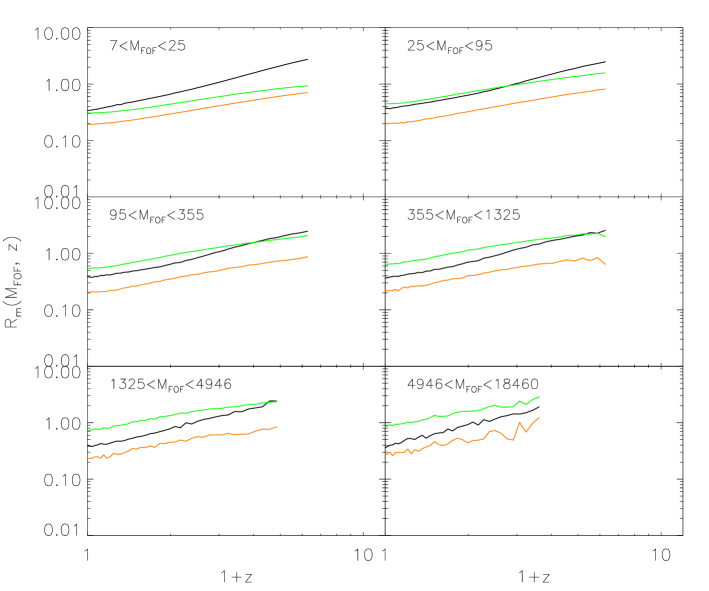
Fig 5 shows dimensionless growth rates for FOF halos as a function of redshift for the same 6 halo mass bins. These rates are defined in exact analogy to equations (4) through (2) and refer to growth through major mergers (orange), through all resolved mergers (green), and through accretion of “diffuse” particles (i.e. simulation particles not assigned to any FOF halo with more than 20 particles; the black curve). Again the growth rate through major mergers parallels the specific formation rate already plotted in Fig. 4; the ratio of the two is just the average mass of the smaller partner in a major merger in units of the final halo mass. Both the growth rate through major mergers and the growth rate through all (resolved) mergers are near power-laws of similar slope. The growth rate through all resolved mergers exceeds that through major mergers by a larger factor for high-mass halos than for low-mass ones. This primarily reflects the fact that the resolution limit of the simulation corresponds to a much lower mass ratio limit for identifying a merger in the former case. This is not the whole story, however, as one can see by the fact that the diffuse accretion rate depends differently on redshift than the other growth rates. Hence the growth of objects of given mass is more strongly affected by accretion of diffuse material at early times than at late times. In addition, comparing the major merger growth rates (the orange curves) with the total growth rates (the sum of the green and black curves), one sees that while at high masses and at early redshifts major mergers account for about 15% of the total growth rate, for small objects at late times they account for a larger fraction of the growth. Note that at all redshifts and for all masses, accretion of “diffuse” particles accounts for at least 30% of the total growth.
5 Summary and discussion
We have used publicly available data for the De Lucia & Blaizot (2007) model of galaxy formation to study the relative importance of merging and of star formation for the growth of galaxies. This model is based on stored halo merging trees for the Millennium Simulation, a very large simulation of the evolution of the dark matter distribution in a CDM cosmology. It is consistent with a wide variety of observational data on the properties and clustering of galaxies both at low and at high redshift. We thus expect its behaviour to give at least a qualitative indication of the balance needed between the various modes of galaxy assembly in any successful model in the CDM context. A particular goal of our study has been to contrast the roles of merging in galaxy and dark halo evolution.
The most striking result from our study is that formation through merging depends in a completely different way on mass and redshift for our two classes of object. Recent formation through a major merger is almost equally likely for halos of all masses at any given time, but is substantially more likely at early times than it is today. For galaxies, on the other hand, the likelihood of recent formation through a major merger is a strong function of stellar mass, but depends at most weakly on redshift. In addition, halos of all masses have grown more rapidly through mergers than all but the most massive galaxies. A little reflection shows that these differences are required by the facts that a galaxy cluster is considered as a single dark matter halo but contains many distinct galaxies, and that the stellar mass function for cluster galaxies differs little from that of the Universe as a whole. This implies that the build-up of massive halos through mergers cannot be paralleled by merging of the associated galaxies. Merging plays a much less important role (though still significant) in galaxy growth than in dark halo growth. The high rates of recent merging found for the most massive galaxies are a selection effect. Only through merging can galaxies attain such high masses. This is also the reason why the most massive galaxies are usually ellipticals,
A second striking result from our study is the increasing importance of star formation with increasing redshift for galaxies of all masses. At low redshift we find the observed result that mean specific growth rates through star formation are smaller in high-mass galaxies than in low-mass ones, but it turns out that this result also holds at high redshift. According to the De Lucia & Blaizot (2007) model there is no redshift where the specific star formation rate of massive galaxies significantly exceeds that of low mass systems. Individual objects may be experiencing dramatic starbursts, but averaged over the population of all objects of given stellar mass, the prediction is that the mean specific growth rate through star formation is always a decreasing function of stellar mass.
Only at redshifts below one and for galaxies comparable to or more massive than the Milky Way does the growth rate through mergers exceed that through star formation. This corresponds nicely to the “transition stellar mass” at which the stellar populations and the structural parameters of local galaxies switch from being predominantly star-forming and disk-like to predominantly old and spheroidal (Kauffmann et al., 2003). This agreement is, of course, in part a consequence of the tuning of the parameters of the galaxy formation model to fit observation.
A less surprising but still interesting result is that merger-related growth for objects of all stellar masses and at most times is roughly equally divided between what we have defined as major and minor mergers. Clearly our separation at a progenitor stellar mass ratio of 3 to 1 is arbitrary. If we had chosen 5 to 1, major mergers would have dominated in most cases. If we had chosen 50 to 1, minor mergers would have been unimportant. Clearly the accretion of the LMC will make a much more significant change to the Milky Way’s stellar mass than the addition of all the Dwarf Spheroidals, and this in turn will be dwarfed by the impending merger with M31!
As we now show, the FOF halo behaviour we find is at least qualitatively consistent with the predictions of EPS theory (Lacey & Cole, 1993). The analytical expression for the probability that a mass element which is part of a halo of given mass at time is part of a halos of (smaller) mass at the earlier time is
where is the rms linear density fluctuation (extrapolated to ) in spheres containing a mean mass , is the redshift-dependent critical density for collapse, is the growth factor of linear fluctuations, and is a constant. By taking the limit as tends to (so tends to 0) and integrating over , we can get the dimensionless merger rate per product halo:
Setting and we get the major merger rate which is seen to evolve with time as . In a Einstein de Sitter universe and thus , roughly reproducing the behaviour we get for the major merger rate of FOF halos in the Millennium Simulation. In the CDM cosmology, the formula is more complex but is quantitatively similar. As shown by Carroll et al. (1992), where
and () is the density parameter of matter (dark energy). We plot against for the two cases in Fig 6 to illustrate the size of the expected differences.
The same formalism also allows the dimensionless mass accretion rates through mergers and/or smooth accretion to be expressed as
The dependence of this rate can be seen by assuming the limits and to scale with , and approximating the dependence of on as a power-law , where for the usual definition of the density power spectrum index . The of the above equation then scales as . When lies in the expected range between and , the mass dependence is very weak, roughly . Taking into account that in the simulation one cannot really take infinitesimal time intervals, this dependence on final halo mass may be further weakened by the exponential term in the expression for .
Finally, we can also use these formulae to estimate the ratio of the growth rate through major mergers to that through “smooth” accretion (here defined as ). It is not easy to obtain analytic expressions for this ratio but it can easily be computed from the above formulae in the power law approximation for . Here we give in Table 1 the relative fraction for several typical values of .
| -2/3 | 0.27 : 0.73 |
|---|---|
| -1/3 | 0.26 : 0.74 |
| -1 | 0.29 : 0.71 |
Roughly speaking, major mergers are predicted to contribute 25% to 30% of the total mass accretion, quite consistent with our simulation results.

Acknowledgements
The public databases on which this work is based can be found at http://www.mpa-garching.mpg.de/millennium. We are grateful to Gabriella De Lucia, to Jeremy Blaizot and particularly to Gerard Lemson for help in using the these databases, as well as to Shaun Cole and Volker Springel for useful discussions.
References
- Abadi et al. (2003) Abadi M. G., Navarro J. F., Steinmetz M., Eke V. R., 2003, ApJ, 597, 21
- Barnes (1988) Barnes J. E., 1988, ApJ, 331, 699
- Barnes & Hernquist (1991) Barnes J. E., Hernquist L. E., 1991, ApJ, 370, L65
- Bell et al. (2006) Bell E. F., Phleps S., Somerville R. S., Wolf C., Borch A., Meisenheimer K., 2006, ApJ, 625,270
- Benson et al. (2000) Benson A. J., Cole S., Frenk C. S., Baugh C. M., Lacey C. G., 2000, MNRAS, 311, 793
- Bower et al. (2006) Bower R. G., Benson A. J., Malbon R., Helly J. C., Frenk C. S., Baugh C. M., Cole S., Lacey C. G., 2006, MNRAS, 370, 645
- Bundy et al. (2004) Bundy K., Fukugita M., Ellis R. S., Kodama T., Conselice C. J., 2004, ApJ, 601, L123
- Carlberg et al. (2000) Carlberg R. G., Cohen J. G., Patton D. R., Blandford R., Hogg D. W., Yee H. K. C., Morris S. L., Lin H., Hall P. B., Sawicki M., Wirth G. D., Cowie L. L., Hu E., Songaila A., 2000, ApJ, 532, L1
- Carroll et al. (1992) Carroll S. M., Press W. H., Turner E. L., 1992, ARA&A, 30, 499
- Cen & Ostriker (1992) Cen R., Ostriker J. P., 1992, ApJ, 393, 22
- Cen & Ostriker (2000) Cen R., Ostriker J. P., 2000, ApJ, 538, 83
- Cimatti et al. (2006) Cimatti A., Daddi E., Renzini A., 2006, A&A, 453, L29
- Cole et al. (1994) Cole S., Aragon-Salamanca A., Frenk C. S., Navarro J. F., Zepf S. E., 1994, MNRAS, 271, 781
- Cole et al. (2000) Cole S., Lacey C. G., Baugh C. M., Frenk C. S., 2000, MNRAS, 319, 168
- Colless et al. (2001) Colless M., Dalton G., Maddox S., Sutherland W., Norberg P., Cole S., Bland-Hawthorn J., Bridges T., Cannon R., Collins C., Couch W., Cross N., Deeley K., De Propris R., Driver S. P., Efstathiou G., Ellis R. S., Frenk C. S., Glazebrook K., Jackson C., Lahav O., Lewis I., Lumsden S., Madgwick D., Peacock J. A., Peterson B. A., Price I., Seaborne M., Taylor K., 2001, MNRAS, 328, 1039
- Conselice et al. (2003) Conselice C. J., Bershady M. A., Dickinson M., Papovich C., 2003, AJ, 126, 1183
- Croton et al. (2006) Croton D. J., Springel V., White S. D. M., De Lucia G., Frenk C. S., Gao L., Jenkins A., Kauffmann G., Navarro J. F., Yoshida N., 2006, MNRAS, 365, 11
- Davis et al. (1985) Davis M., Efstathiou G., Frenk C. S., White S. D. M., 1985, ApJ, 292, 371
- De Lucia & Blaizot (2007) De Lucia G., Blaizot J., 2007, MNRAS, 375, 2
- De Lucia et al. (2006) De Lucia G., Springel V., White S. D. M., Croton D., Kauffmann G., 2006, MNRAS, 366, 499
- Di Matteo et al. (2005) Di Matteo T., Springel V., Hernquist L., 2005, Nature, 433, 604
- Fall (1979) Fall S. M., 1979, Nature, 281, 200
- Farouki & Shapiro (1982) Farouki R. T., Shapiro S. L., 1982, ApJ, 259, 103
- Gao et al. (2004) Gao L., White S. D. M., Jenkins A., Stoehr F., Springel V., 2004, MNRAS, 355, 819
- Ghigna et al. (1998) Ghigna S., Moore B., Governato F., Lake G., Quinn T., Stadel J., 1998, MNRAS, 300, 146
- Hatton et al. (2003) Hatton S., Devriendt J. E. G., Ninin S., Bouchet F. R., Guiderdoni B., Vibert D., 2003, MNRAS, 343, 75
- Helly et al. (2003) Helly J. C., Cole S., Frenk C. S., Baugh C. M., Benson A., Lacey C., 2003, MNRAS, 338, 903
- Kang et al. (2005) Kang X., Jing Y. P., Mo H. J., Börner G., 2005, ApJ, 631, 21
- Katz et al. (1996) Katz N., Weinberg D. H., Hernquist L., 1996, ApJS, 105, 19
- Kauffmann & Charlot (1998) Kauffmann G., Charlot S., 1998, MNRAS, 297, L23+
- Kauffmann et al. (1999) Kauffmann G., Colberg J. M., Diaferio A., White S. D. M., 1999, MNRAS, 303, 188
- Kauffmann et al. (2003) Kauffmann G., Heckman T. M., White S. D. M., Charlot S., Tremonti C., Peng E. W., Seibert M., Brinkmann J., Nichol R. C., SubbaRao M., York D., 2003, MNRAS, 341, 54
- Kauffmann et al. (1997) Kauffmann G., Nusser A., Steinmetz M., 1997, MNRAS, 286, 795
- Kauffmann et al. (1993) Kauffmann G., White S. D. M., Guiderdoni B., 1993, MNRAS, 264, 201
- Kitzbichler & White (2007) Kitzbichler M. G., White S. D. M., 2007, MNRAS, 376, 2
- Lacey & Cole (1993) Lacey C., Cole S., 1993, MNRAS, 262, 627
- Le Fèvre et al. (2000) Le Fèvre O., Abraham R., S. J., Ellis R. S., Brinchmann J., Schade D., Tresse L., Colless M., Crampton D., 2000, MNRAS, 311, 565
- Lin et al. (2004) Lin L., Koo D. C., Willmer C. N. A., Patton D. R., Conselice C. J., Yan R., Coil A. L., Cooper M. C., Davis M., Faber S. M., Gerke B. F., Guhathakurta P., Newman J. A., 2004, ApJ, 617, L9
- Mihos & Hernquist (1994) Mihos J. C., Hernquist L., 1994, ApJ, 425, L13
- Mihos & Hernquist (1996) Mihos J. C., Hernquist L., 1996, ApJ, 464, 641
- Moore et al. (1999) Moore B., Ghigna S., Governato F., Lake G., Quinn T., Stadel J., Tozzi P., 1999, ApJ, 524, L19
- Naab & Burkert (2003) Naab T., Burkert A., 2003, ApJ, 597, 893
- Navarro & White (1994) Navarro J. F,White S. D. M., 1994, MNRAS, 267 , 401
- Negroponte & White (1983) Negroponte J., White S. D. M., 1983, MNRAS, 205, 1009
- Patton et al. (2002) Patton D. R., Pritchet C. J., Carlberg R. G., Marzke R. O., Yee H. K. C., Hall P. B., Lin H., Morris S. L., Sawicki M., Shepherd C. W., Wirth G. D., 2002, ApJ, 565, 208
- Pfrommer et al. (2006) Pfrommer C., Springel V., Enßlin T. A., Jubelgas M., 2006, MNRAS, 367, 113
- Sanders et al. (1988) Sanders D. B., Soifer B. T., Elias J. H., Madore B. F., Matthews K., Neugebauer G., Scoville N. Z., 1988, ApJ, 325, 74
- Somerville & Primack (1999) Somerville R. S., Primack J. R., 1999, MNRAS, 310, 1087
- Somerville et al. (2001) Somerville R. S., Primack J. R., Faber S. M., 2001, MNRAS, 320, 504
- Spergel et al. (2003) Spergel D. N., Verde L., Peiris H. V., Komatsu E., Nolta M. R., Bennett C. L., Halpern M., Hinshaw G., Jarosik N., Kogut A., Limon M., Meyer S. S., Page L., Tucker G. S., Weiland J. L., Wollack E., Wright E. L., 2003, ApJS, 148, 175
- Springel et al. (2005a) Springel V., Di Matteo T., Hernquist L., 2005a, ApJ, 620, L79
- Springel & Hernquist (2003) Springel V., Hernquist L., 2003, MNRAS, 339, 289
- Springel et al. (2005b) Springel V., White S. D. M., Jenkins A., Frenk C. S., Yoshida N., Gao L., Navarro J., Thacker R., Croton D., Helly J., Peacock J. A., Cole S., Thomas P., Couchman H., Evrard A., Colberg J., Pearce F., 2005b, Nature, 435, 629
- Springel et al. (2001) Springel V., White S. D. M., Tormen G., Kauffmann G., 2001, MNRAS, 328, 726
- Toomre (1976) Toomre A., 1976, in Bulletin of the American Astronomical Society Vol. 8 of Bulletin of the American Astronomical Society, INVITED PAPER - Interacting Galaxies. pp 354–+
- van Dokkum (2005) van Dokkum P. G., 2005, AJ, 130, 2647
- Velazquez & White (1999) Velazquez H., White S. D. M., 1999, MNRAS, 304, 254
- White (1978) White S. D. M., 1978, MNRAS, 184, 185
- White & Rees (1978) White S. D. M., Rees M. J., 1978, MNRAS, 183, 341