2GEPI, Observatoire de Paris-Meudon, 92195 Meudon, France
3Department of Physics, Hebei Normal University, Shijiazhuang 050016, China
4Department of Physics, Harbin University, Haerbin 150086, China
Checking the reliability of equivalent width for estimating the metallicities of galaxies
Abstract
Aims. We verify whether the O/H abundances of galaxies can be derived from the equivalent width (EW) instead of the extinction-corrected flux , and eventually propose a method of improving the reliability of this empirical method, which is often used for the non-flux calibrated spectra of galaxies.
Methods. We select 37,173 star-forming galaxies from the Second Data Release of the Sloan Digital Sky Survey (SDSS-DR2), which offers a wide range of properties to test the EW method.
Results. The EW- method brings with it a significant bias: for the bulk of SDSS galaxies, it may affect the determination of log(O/H) by factors ranging from -0.2 to 0.1 dex and for some galaxies by factors ranging from -0.5 to 0.2 dex. We characterize this discrepancy (or bias) by = )/(, which is virtually independent of dust extinction, while tightly correlating with (4000), although at a lower significance, with () colors.
Conclusions. The EW- method cannot be used as a proxy for the extinction-corrected flux method. From analytical third-order polynomial fits of versus () colors, we have been able to correct the EW- method. With this additional and easy correction, the EW- method provides O/H abundance values similar to those derived from the extinction-corrected flux method with an accuracy of 0.1 dex for 92% of the SDSS galaxies.
Key Words.:
Galaxy: abundances - Galaxies: evolution - Galaxies: ISM - Galaxies: photometry - Galaxies: spiral - Galaxies: starburst1 Introduction
Chemical abundance is a fundamental parameter for tracing the history of star formation and evolution of galaxies. Oxygen is the most commonly used metallicity indicator in the interstellar medium (ISM) by virtue of its high relative abundance and strong emission lines in the optical part of the spectrum (e.g., [O ii]3727 and [O iii]4959, 5007). However, the “direct” method of estimating oxygen abundances from electron temperature () is generally only available for metal-poor galaxies (12+log(O/H)8.5), where the [O iii]4363 emission line can possibly be detected, which is needed for measuring by its ratio to [O iii]4959, 5007 (Pagel et al. 1992; Skillman & Kennicutt 1993). For metal-rich galaxies, the most commonly used are empirical strong-line methods, such as :
| (1) |
i.e. the flux ratios of [O ii] and [O iii] to H (Pagel et al. 1979; McGaugh 1991; Zaritsky et al. 1994; Kobulnicky et al. 1999; Tremonti et al. 2004 and the references therein).
However, flux calibrations are frequently problematic in the current generation of wide-field galaxy surveys of multiobject spectrography, because of unfavorable observing conditions or instrumental effects such as a variation in system response over the field of view, nevertheless, one still expects to derive metallicity properties of the star-forming galaxies detected in the large data sets from surveys. Then, (EWs) are being used to replace the fluxes of their values for estimating metallicities of the galaxies, i.e., from the EW :
| (2) |
This replacement was first checked by Kobulnicky & Phillips (2003; KP03 hereafter) on the basis of a sample of 243 nearby galaxies. Consequently, this method has been used by some researchers to estimate metallicities of nearby and even intermediate- galaxies (e.g. Kobulnicky et al. 2003; Kobulnicky & Kewley 2004; Lamareille et al. 2005a,b; Mouhcine et al. 2006a,b etc.).
However, it is known that there is a continuum () scale factor between the flux () and EW () values of the emission line:
| (3) |
This will naturally make us ask whether the continua underlying [O ii] and H (and [O iii]) are very similar or not. If not, could be far from a unique constant, and then the metallicities derived from EW could have large discrepancies from those derived from flux .
The SDSS provides a complete dataset and measurements up to several ten-thousand galaxies, making it a very good database for studying this question. In this paper, we selected 37,173 star-forming galaxies from the SDSS-DR2 to further check the reliability of using EW replacing the extinction-corrected flux to estimate the metallicities of galaxies. Moreover, this is a large homogeneous database observed by one single highly efficient facility, which will minimize the effect of using various instruments. Some other characteristic parameters provided by the SDSS can also help for understanding the question further, e.g., (4000), and photometric magnitudes, etc.
This paper is organized as follows. The sample selection criteria are described in Sect.2. In Sect.3, we check how big the difference is between the underlying continua of [O ii] and H, which is quantified as a parameter (by 1/). The emission-line quantities of the sample galaxies are analyzed in Sect.4, as well as the discrepancies between their EW and flux , and the discrepancies between the derived log(O/H) abundances from them. In Sect.5, we try to find the factors that mostly affected the parameter, then to find the relations between them and , hence to modify the EW method, which includes the stellar population indicators (4000) and colors. In Sect.6, we discuss the boundary of the upper branch of 12+log(O/H) abundances from the log calibration, then summarize and conclude this paper in Sect.7.
2 Sample selection
The data analyzed in this study were drawn from the
SDSS-DR2 (Abazajian et al.
2004). These galaxies are part of the SDSS “main” galaxy sample
used for large-scale structure studies (Strauss et al. 2002).
We selected a sample of star-forming galaxies with metallicity
estimates from the SDSS-DR2 database. The selection criteria are
similar to those of Tremonti et al. (2004) and Liang et al.
(2006). We summarize the criteria for selection as follows,
and mark the selected number of the sample galaxies in
parenthesis at the end of each step:
(i) SDSS-DR2 (261,054), 14.5r17.77 mag (Petrosian magnitude, 193,890 left);
(ii) 12+log(O/H)SDSS 0 (50,385 left) (SDSS refers to
the metallicity values
provided by the MPA/JHU group, which were obtained on the basis of
the 2001 Charlot & Longhetti model and Bayesian technique,
see Tremonti et al. 2004);
(iii) (40,693 left) (this allows the spectral coverage from
[O ii]3727 to [S ii]6731 for the sample
galaxies);
(iv) the emission lines
[O ii], H, [O iii], H, and [N ii] are
detected and their fluxes and EWs are reasonable;
fluxes of emission lines H, H, and [N ii]6584
are detected at levels higher than 5 (39,029 left);
(v) 8.512+log(O/H)9.3 (38,932 left) (we
adopt the formula of Tremonti et al. 2004 to convert to
the oxygen abundance 12+log(O/H), which is only
suitable for metal-rich galaxies; therefore, we only select the
galaxies with 12+log(O/H)8.5 here; 9.3 is almost the upper
limit of the abundances in the samples);
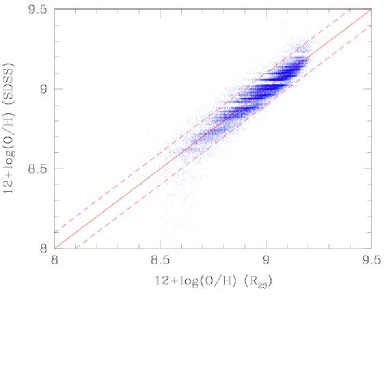
(vi) the discrepancy between log(O/H)
and log(O/H)SDSS is less than 0.1 dex
(37,173 left finally), which removes some scattered data points
from the calibration, as shown by Fig. 1.
Finally, we obtained a sample of 37,173 star-forming galaxies from the SDSS-DR2 as our sample in this study.
The criteria (i)-(iv) are almost the same as what was adopted in Tremonti et al. (2004), except the lower limit for redshift was increased from 0.005 to 0.04 by following Kewley et al. (2005) to minimize the aperture effects of the SDSS. In Sect. 6, we discuss criterion (v) in particular, i.e. 12+log(O/H)8.5 as the lower boundary of the upper branch of oxygen abundances from log calibration.
3 Quantifying the difference between EW and flux : determining the parameter
The MPA/JHU collaboration has put the measurements of emission-lines and some physical parameters for a large sample of SDSS galaxies on the MPA SDSS website111http://www.mpa-garching.mpg.de/SDSS/ (Kauffmann et al. 2003; Brinchmann et al. 2004; Tremonti et al. 2004 etc.). These measurement values were obtained from the stellar-feature subtracted spectra with the spectral population synthesis code of Bruzual & Charlot (2003).
Fluxes of the emission lines should be corrected for dust extinction, so we estimate the attenuation of the sample galaxies using the Balmer line ratio H/H and assuming case B recombination, with a density of 100 cm-3, a temperature of K, and the intrinsic H/H ratio of 2.86 (Osterbrock 1989), following the relation of
| (4) |
Using the average interstellar extinction law given by Osterbrock(1989), we obtain (H)- (H) = 0.37. For the data points with , = 0 is assumed since their intrinsic H/H may be lower than 2.86 if their electron temperature is high (Osterbrock 1989).
Then, the extinction-corrected parameter and its relation with the EW are:
| (5) | |||||
where , and is about equal to 1 since [O iii]4959,5007 and H are very close in wavelength. The expression refers to the dereddened, calibrated flux values of the corresponding lines; refers to the observed flux values; and represents the EW values of the related emission lines. The parameter is the extinction coefficient. (Also see KP03)
The values of these SDSS galaxies can be calculated directly from , where and can be estimated from their ratios of fluxes to EW values, and is the extinction coefficient. The derived parameters of these sample galaxies show a median value of 0.85 and an average value of 0.86 in a range from 0.1 to 2.6. KP03 estimate the typical value of the parameters of their 243 sample galaxies to be . However, KP03 still adopted when they used the EW to estimate the oxygen abundances of galaxies.
4 Analysis of emission-line quantities
Several relations are analyzed in this section, including those of the emission-line quantities, e.g. EW(H), with the parameter, with the discrepancies of EW and flux , and with the discrepancies of the log(O/H) abundances derived from these two values.
4.1 Relations between the line strengths and parameters
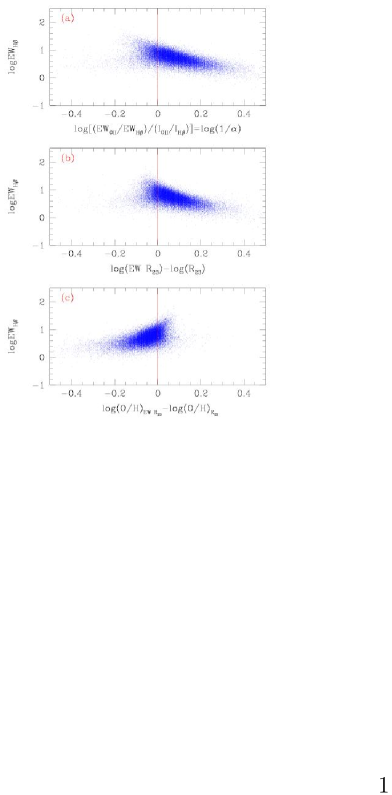
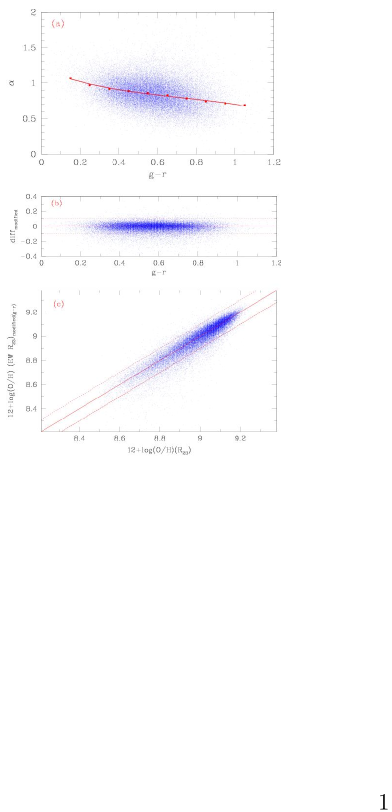
Figure 2a shows the relations between the emission-line strengths EW(H) and the line-ratio / (=1/) of the sample galaxies. The solid line marks the one-to-one correspondence. It seems that there is some correlation between the parameter and the emission-line strengths: from the galaxies with stronger emission lines, the ratios of log(/) (=log(1/)) change from -0.2 (mostly) to 0.5 monotonicly, though the scatters are large and show some exceptional points with log(1/)-0.2. This range is similar to what KP03 found for their sample galaxies. The line strengths of [O ii] and [O iii], i.e., EW[OII] and EW[OIII], also show similar trends to EW(H) in these kinds of relations, but with somewhat larger scatter. The ratio log(/) (=log(1/)) of all the sample galaxies show a median value of 0.069 dex (with a scatter of 0.060 dex) and a mean value of 0.077 dex (with a scatter of 0.104 dex).
4.2 Discrepancies between EW and
When directly using the EW to replace the flux , namely, =1 is adopted for EW , the derived metallicities could have some discrepancies. Figure 2b shows the discrepancies between the EW and the extinction-corrected flux as a function of line strengths EW(H). The general trend is that, from galaxies with stronger line strengths, the differences between log(EW ) and log() increase from -0.15 (mostly) to 0.5 dex monotonicly. KP03 also find a similar trend for their sample galaxies. Our much larger sample shows this systematic discrepancy more clearly. The median value of these discrepancies is about 0.061 dex (with a scatter of 0.050 dex), and the mean value of them is about 0.069 dex (with a scatter of 0.086 dex).
4.3 Discrepancies between (O/H) and (O/H)
One of the most important results of this work is given in Fig. 2c, which shows the difference between log(O/H) and log(O/H) as functions of the emission-line strengths EW(H). The general trend is that, from the galaxies with stronger line strengths, the differences in the two log(O/H) estimates change from -0.5 to 0.2 dex, with most of them ranging from -0.2 to 0.1 dex. KP03 do not present such a direct comparison for the O/H abundances.
The large sample of SDSS star-forming galaxies that we use generally show that the EW will underestimate the oxygen abundances of the sample galaxies by a factor of 0.041 (the median offset, with a scatter of 0.036 dex) or 0.054 dex (the mean offset, with a scatter of 0.078 dex). Here the log(O/H) abundances were obtained from the calibration of Tremonti et al. (2004). We also adopted some other calibration formulas, i.e. Kobulnicky et al. (1999, the analysis formulas for the models of McGaugh 1991), Zaritsky et al. (1994), and Kobulnicky & Kewley (2004, the average of McGaugh 1991 and Kewley & Dopita 2002), to check these discrepancies, the results of which are quite similar. Moustakas & Kennicutt (2006) find similar discrepancies to ours by comparing the abundances derived from the extinction-corrected flux- and EW- of 12 nearby spiral galaxies. They find that the integrated abundances determined from the emission-lines systematically underestimated the characteristic abundances. The mean offset is 0.060.09 dex using the McGaugh (1991) calibration, or 0.110.13 dex using the Pilyugin & Thuran (2005) calibration, and the corresponding median offsets are 0.04 and 0.09 dex, respectively.
These results show that the oxygen abundances derived from the EW and the extinction-corrected flux- are not seriously different for these star-forming galaxies, generally less than 0.1 dex. However, the global discrepancy of them does show a wide distribution, from -0.5 to 0.2 dex, which means that this replacement of EW to flux for metallicity estimates could cause different effects on the individual galaxies, and should be considered carefully.
5 Modifying the EW -method
It is interesting to further check the main factors that affect the discrepancy between the log(O/H) abundances derived from EW and flux . We may then find some ways to modify the EW method in order to obtain almost identical oxygen abundances to the flux on the basis of this large set of SDSS galaxies.
5.1 Factors that affect the parameter
In Sect.3, we point out that the parameter is the ratio of the intrinsic continua underlying [O ii]3727 and H and that it is related to the observed continua and the line extinction (see Eq. (5)). In this section, we discuss the dominant effect on the parameter.
Equation (5) shows is a function of the dust extinction and stellar populations of the galaxies, so then we have
| (6) | |||||
where and are the dereddened continua underlying [O ii] and H, the dust attenuation on emission-line, and characterizes the dust attenuation on the continuum. Here we assume and follow the same reddening law. (Also see KP03)
As a rough estimate, we assume that the sample galaxies follow the same extinction law as the starburst galaxies studied by Calzetti et al. (1994), who found that the difference between the optical depths of the continua underlying the Balmer lines is about one-half of the difference between the optical depths of the Balmer emission lines (their Eq.26). Thus, we assume , and then obtain the following equation:
| (7) |
where characterizes the stellar populations of the galaxies, and -term characterizes the dust extinction.
It is easy to check the relation between and the dust extinction since we have obtained both of them for the individual galaxies. However, we cannot obtain the intrinsic values of directly. Fortunately, the MPA/JHU group and the SDSS provide (4000) parameters and several photometric magnitudes for this large sample of galaxies, which can characterize the stellar populations of the galaxies. We check the relations between and dust extinction , (4000), colors for the sample galaxies in the next three sections.
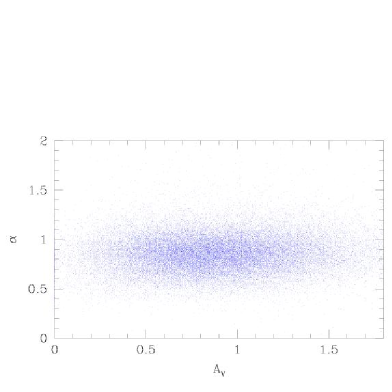
5.2 The relation between and dust extinction
The [O ii]3727 is bluer in wavelength and is affected more strongly by dust extinction than H, thus the parameter may be correlated with dust extinction . Figure 3 shows the parameter as a function of dust extinction (=, Seaton (1979), =3.1). The derived is from 0 to 2.7, with the median and average values of 0.87 and 0.89, respectively. It shows that there is no clear correlation between and for these SDSS sample galaxies, and the linear least-square fit is with a very slight slope. This means that the differences in the continua underlying [O ii]3727 and H are not affected much by dust extinction. The reasons may be that the related two lines are not very far away at wavelength and that the dust extinction coefficients of these SDSS star-forming galaxies are not so large.
5.3 The corrected EW method using (4000) index
The break occurring at 4000Å is the strongest discontinuity in the optical spectrum of a galaxy, and it arises because of the accumulation of a large number of spectral lines in a narrow wavelength region. The main contribution to the opacity comes from ionized metals. In hot stars, the elements are multiply ionized and the opacity decreases, so the 4000-Å break will be small for young stellar populations and large for old, metal-rich galaxies (Kauffmann et al. 2003). Kauffmann et al. (2003) adopt the narrow definition from Balogh et al. (1999) and denote this index as (4000) for the SDSS galaxies. It is the ratio of the average flux density in the bands 3850-3950 and 4000-4100 , 100Å narrower than the definition by Bruzual (1983). The parameter (4000) is one of the main ones used by Kauffmann et al. (2003) to trace the stellar formation history of the SDSS galaxies, which shows a monotonic increase after the instantaneous burst of star formation.
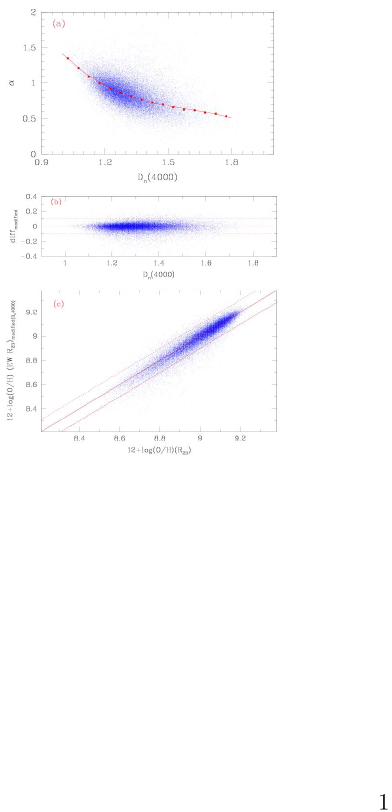
We plot the relations of against (4000) for the sample galaxies in Fig. 4a, which clearly shows a correlation. A third-order polynomial fit for this relation is obtained by fitting the 16 median-value points in bins of 0.05 in (4000) from 1 to 1.8, and given as:
| (8) |
with a standard error of 0.164, where . This relation of vs. (4000) could be used to correct the EW and then to obtain the consistent metallicities of galaxies with the flux . We propose using (EW)corrected= EW([O ii])/EW(H) + EW([O iii])/EW(H) to then estimate the metallicities of galaxies.
Figure 4b shows the consistency of the metallicity estimates from the corrected EW and flux after we apply the correction of (4000) for . Figure 4c shows more direct comparisons for the two O/H estimates with such a correction. Both of them show that the two derived abundances are very consistent. The median and mean discrepancies between log(O/H) and log(O/H) now decrease to about 0.005 dex (with a scatter of 0.024 dex), and 0.010 dex (with a scatter of 0.054 dex), respectively. Then the corrected EW method provides log(O/H) abundances similar to those of the extinction-corrected flux method within an accuracy of 0.1 dex for 94% of the galaxies.
Unfortunately this correction is difficult to handle with non-calibrated spectra, simply because reliable measurements for (4000) require flux-calibrated spectroscopy. Since (4000) amplitude depends on the stellar population, age, and metallicity, it also correlates with colors. In the following we aim at generating a correction usable by a large community, using a non-calibrated spectrum and one color as input (e.g. for the SDSS data).
5.4 The corrected EW method using color
Colors can provide important information for the stellar populations of the galaxies and can be obtained directly from the photometric observations. SDSS has made the band magnitudes of the galaxies available publicly. Since the magnitude has large uncertainty (20 per cent; Kauffmann et al. 2003) and the images in and band are relatively shallow, whereas band image may suffer from the ‘red halo’ effect (Michard 2002; Wu et al. 2005), we use color here to study such corrections for . The and magnitudes can be converted to other band magnitudes, e.g. , , following some conversions, for example, Smith et al. (2002) and Jordi et al. (2006).
Figure 5a shows the correlation between the colors (in Petrosian magnitudes) and for the sample galaxies. The basic trend shows that the redder galaxies have relatively lower values, corresponding to the larger differences between the underlying continua of [O ii] and H. The third-order polynomial fits for these correlations were obtained and given as
| (9) |
with a standard error of 0.186, where refers to color. Then we propose using (EW)corrected= EW([O ii])/EW(H) + EW([O iii])/EW(H) to estimate the metallicities of galaxies.
Figure 5b shows the consistency of the metallicity estimates from the corrected EW and flux after we apply the correction from color for . Figure 5c shows the comparison between the two O/H estimates with this correction more directly. They show that the median and mean discrepancies between log(O/H) and log(O/H) now decrease to about 0.004 dex (a scatter of 0.030 dex) and 0.012 dex (a scatter of 0.062 dex), respectively. Then the two oxygen abundance estimates are almost identical to each other. Namely, the corrected EW method provides log(O/H) abundances similar to those of the extinction-corrected flux method within an accuracy of 0.1 dex for 92% of the galaxies.
5.5 Correction for the EW method by a constant =0.85
The calculated median value of this large sample of SDSS local star-forming galaxies is about 0.85 (the average value is 0.86). We may also use this constant -factor to modify the EW . However, this constant correction is only useful for estimating the global metallicity distribution of a large dataset, for example, from the database of a survey. As for the individual galaxy, this may reversely enlarge the uncertainty for some of them, for example, the object with about EW(H)10Å(see Fig. 2a). Indeed, the correction on EW for the individual galaxies correlates tightly with their stellar populations and star formation histories.
6 Discussions about the boundary of the upper branch of 12+log(O/H)
In this work, we adopt 12+log(O/H)8.5 as the low boundary of the upper branch of oxygen abundances from the log calibration. The main reason is that the calibration used (taken from Tremonti et al. 2004) is valid above this metallicity. In Sect. 6.1, we present more observational data with O/H abundances derived from electron temperature , especially from the recent SDSS, and some photoionization models to further identify the reason we adopt 12+log(O/H)8.5 as the boundary of the upper branch of oxygen abundances to compare the EW and flux methods. However, this boundary value is a bit higher than used by some other researchers, e.g., Pilyugin (2000, 2001a,b) and Pilyugin & Thuan (2005), who use 12+log(O/H)8.2 on the basis of a sample of H ii regions having their log(O/H) abundances estimated from . Therefore, we extend the boundary to compare the EW and flux methods and check whether our relations are valid or not in the region of 12+log(O/H) 8.2-8.5, which will be presented in Sect. 6.2.
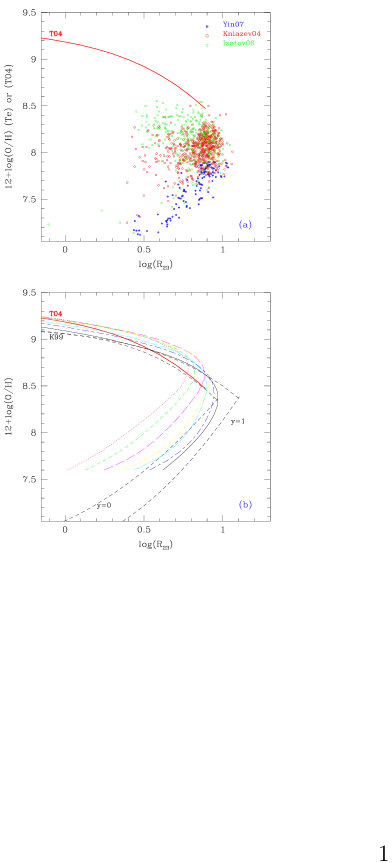
6.1 The observational data with (O/H) and the photoionization models
In Fig. 6a we plot the (O/H)- relations for the sample galaxies having -based O/H abundances, which are taken from Kniazev et al. (2004, 624 samples), Izotov et al. (2006, 409 samples), and Yin et al. (2007, 695 samples). Figure 6b presents the predictions of photoionization models for the relations of 12+log(O/H) vs. log taken from Kewley & Dopita (2002) and Kobulnicky et al. (1999, K99), which was obtained by analyzing those of McGaugh (1991).
Figure 6a and Fig. 6b show that both the large sample of observational data and photoionization models confirm that it is very difficult to derive a reliable O/H abundance from the parameter for the region of 12+log(O/H)8.5 because of the large scatter of the data points there, the weak dependence of O/H on (down to 12+log(O/H)7.9), and the strong effects of ionization parameters. Yin et al. (2007) has used their Fig.3b to show the large discrepancy, up to 0.4 dex, of the two sets of log(O/H) estimates derived from the upper branch and lower branch of calibrations for the samples within 7.912+log(O/H)8.4. Stasinska (2002) discusses the weak dependence of (O/H) on in the transition region from nebular physics.
Considering the discussions above, and also to avoid that some galaxies included may lie in the lower branch of the -(O/H) relation, we select the galaxies having 12+log(O/H)8.5 to check the EW method in this study. However, it could be useful to check this and the validity of our relations in an extended upper branch range, 12+log(O/H)8.2-8.5, as used in some studies.
6.2 Checking the extended upper-branch range of 12+log(O/H)8.2-8.5
We select a subsample from Fig. 6a to check the situation in the extended range of upper branch, 12+log(O/H)8.2-8.5. To be consistent with other parts of this work, we select this subsample based on the SDSS-DR2 catalog. Finally, 37 independent objects with metallicities of 8.212+log(O/H)8.5 are selected by cross-correlating the DR2 catalog with the lists of Kniazev et al. (2004, from DR1), Izotov et al. (2006, from DR3), and Yin et al. (2007, from DR4). Then we use the EW and flux measurements of the related emission lines provided by the MPA/JHU group to estimate their EW and flux , hence, the resulted abundances.
These 37 galaxies show a discrepancy between log(EW) and log() (as Fig. 2b) within a range of -0.2 to 0, which may result in overestimated log(O/H) abundances of about 0-0.2 dex by the EW as shown in Fig. 2c. Their (4000) values are around 1.0, with colors around 0.0 (ranging from -0.2 to 0.3), which confirms that they are low-metallicity objects that will distribute in the left hand parts in Figs. 4a and 5a. Their values are within 1-2, with the average value about 1.5. If we apply the corrections for their EW , the correction factors will be about 1.4 and 1.2 by extrapolating Eqs. (8) and (9), respectively.
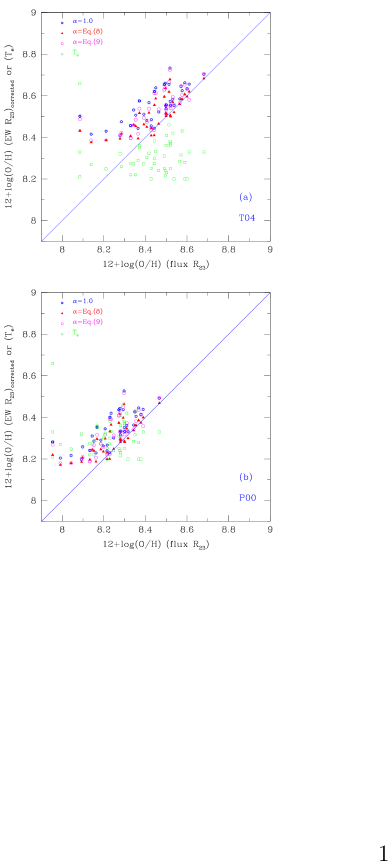
If we do not consider the discrepancy among the different photoionization parameters and the weak dependence of O/H on in this metallicity region (shown as Fig.6b) and try to extrapolate the calibration of Tremonti et al. (2004) down to these objects with 8.212+log(O/H)8.5, then the open squares in Fig. 7a show that the method will often overestimate the abundances of the galaxies and even underestimate the abundances of some galaxies. The stars in Fig.7a show that the EW method provides a higher log(O/H) abundance than the flux , generally about 0.2 dex, which is consistent with the discussions above and with Fig.2c. Figure 7a also shows that the correction by () will not improve the consistency for these objects much, and the correction by () gives more consistent O/H abundances for the objects with 12+log(O/H)8.2. We changed to the calibration of Zaritsky et al. (1994) (which is an average of three previous calibrations) to obtain these comparisons again, and find the results are very similar to Fig.7a.
We also used the calibration of Pilyugin (2000) (their Eq.5) to do these comparisons, and present the results in Fig. 7b. It shows that mostly the flux method provides consistent log(O/H) abundances with the method, except for some data points in the left hand part of the data with underestimated log(O/H) and some reversed ones in the right hand section. It also shows that the corrected EW method by () provides more consistent abundances with the flux for the objects with 12+log(O/H)8.1 than the uncorrected EW or corrected by (), which are similar to Fig. 7a. These differences among the EW abundances presented in Fig.7 are not difficult to understand since the average value of these low-metallicity objects is about 1.5, which is higher than the correction relations provided, 1.4 or 1.2.
In short, in the lower metallicity range of 8.2 12+log(O/H)8.5, we would not recommend using our relations to correct the EW method for the oxygen abundance calibrations, since there are several situations affecting the results, such as the big scatter of the data, the strong effects of ionization parameters, and the weak dependence of O/H on in the range.
7 Summary and conclusion
The goal of this paper is to check the reliability of using EW (=) to replace the extinction-corrected flux (=) to estimate the metallicities of star-forming galaxies on the basis of a large sample (37,173) of galaxies with 12+log(O/H)8.5, selected from the SDSS-DR2. This replacement is often adopted when there are some problems dealing with proper flux calibrations for the spectral observations. This large sample can provide some obvious statistical trends.
The results show that the logarithm values of EW and extinction-corrected flux- have a discrepancy from -0.4 to 0.5 dex, with a median value of about +0.061 dex and a mean value about +0.069 dex. Thus, the discrepancies between the log(O/H) abundances obtained from EW and those from the flux- range from -0.5 to 0.2 dex and have a median value of about -0.041 dex, a mean value of about -0.054 dex. These discrepancies are caused by the different continua () underlying the emission lines [O ii] and H ([O iii], as well). These differences are characterized by the parameter as ()/(), which changes from 0.1 to 2.6, and by a median value of 0.85 and a mean value of 0.86.
Then we discuss the factor that affects this discrepancy mostly. Our large sample of data shows that the parameter is almost independent of the dust extinction inside the galaxies and depends closely on stellar populations of the galaxies, which can be quantified by the (4000) parameters and colors of the galaxies. Third-order polynomial fits have been obtained for the observed relations of versus (4000) and versus colors for the sample galaxies, which can be used to modify the EW method. After applying this correction by (4000), the median and mean discrepancies between log(O/H) and log(O/H) decrease to about 0.005 dex and 0.010 dex, respectively. After applying this correction by colors, the median and mean discrepancies between log(O/H) and log(O/H) decrease to about 0.004 dex and 0.012 dex, respectively. The two derived sets of log(O/H) abundances are almost identical now.
In summary, when there are problems with flux calibrations of the spectra, the EW could be used roughly to replace the extinction-corrected flux to estimate the metallicities of star-forming galaxies. The discrepancy caused by this replacement can be from -0.2 to 0.1 dex generally. This factor is consistent with those found by KP03 and Moustakas & Kennicutt (2006). However, this discrepancy could be large for the different individual galaxies, from -0.5 to 0.2, if the underlying continua of [O ii] and H ([O iii]) are quite different. The (4000) parameters and colors of the galaxies are very useful for correcting the EW method, which will then greatly decrease the discrepancies and result in an almost identical oxygen abundance to the flux-.
Nevertheless, the modified EW still suffers from the drawback of the “double-value” of for the O/H estimates, and some other strong-line ratios are also useful for estimating the metallicities of galaxies then, such as [N ii]/H, ([O iii]/H)/([N ii]/H), [N ii]/[S ii] and [O iii]/H, etc. (Kewley & Dopita 2002; Pettini & Pagel 2004; Liang et al. 2006; Yin et al. 2007).
Acknowledgments
We thank our referee for the valuable comments and suggestions, which helped to improve this work. We thank Rob Kennicutt, Lisa Kewley, Hong Wu, Licai Deng, Bo Zhang, and Hector Flores for valuable discussions related to this study, and thank Ruixiang Chang, Shiying Shen, Caina Hao, Jing Wang, and Chen Cao for helpful discussions about the SDSS database. We thank James Wicker for his help in improving the English expression in the text. This work was supported by the Natural Science Foundation of China (NSFC) Foundation under No.10403006, 10433010, 10673002, 10573022, 10333060, and 10521001; and the National Basic Research Program of China (973 Program) No.2007CB815404.
References
- (1) Abazajian, K., Adelman-McCarthy, J.K., Agueros, M.A. et al. 2004, AJ, 128, 502
- (2) Balogh, M. L., Morris, S.L., Yee, H.K.C., Carlberg, R.G., Ellingson, E., 1999, ApJ, 527, 54
- (3) Brinchmann, J., Charlot, S., White, S. D. M., Tremonti, C., Kauffmann, G., Heckman, T., Brinkmann, J., 2004, MNRAS, 351, 1151
- (4) Bruzual, A. G., 1983, ApJ, 273, 105
- (5) Calzetti, D., Kinney, A. L., Storchi-Bergmann, T., 1994, ApJ, 429, 582
- (6) Izotov, Y. I., Stasinska, G., Meynet, G. et al. 2006, A&A, 448, 955
- (7) Jordi, K., Grebel, E. K., Ammon, K., 2006, A&A, 460, 339
- (8) Kauffmann, G., Heckman, T.M., White, S.D.M. et al, 2003, MNRAS, 341, 33
- (9) Kobulnicky, H. A., Kennicutt, R.C.Jr., Pizagno,J.L., 1999, ApJ, 514, 544
- (10) Kobulnicky, H .A., Kewley, L.J., 2004, ApJ, 617, 240
- (11) Kobulnicky, H. A., Willmer, C.N.A., Phillips, A. C. et al. 2003, ApJ, 599, 1006
- (12) Kobulnicky, H. A., Phillips, A.C., 2003, ApJ, 599, 1031 (KP03)
- (13) Kewley, L. J. & Dopita, M. A. 2002, ApJS 142, 35
- (14) Kniazev, A. Y., Pustilnik, S. A., Grebel, E. K. et al. 2004, ApJS, 153, 429
- (15) Lamareille, F., Contini, T., Le Borgne, J.-F. et al. 2005a, A&A, 448, 893
- (16) Lamareille, F., Contini, T., Brinchmann, J. et al. 2005b, A&A, 448, 907
- (17) Liang, Y. C., Yin, S. Y., Hammer, F. et al. 2006, ApJ, 652, 257
- (18) McGaugh, S. S. 1991, ApJ, 380, 140
- (19) Michard, R. 2002, A&A, 384, 763
- (20) Mouhcine, M., Bamford, S. P., Aragon-Salamanca, A. et al. 2006a, MNRAS, 368, 1871
- (21) Mouhcine, M., Bamford, S. P., Aragon-Salamanca, A. et al. 2006b, MNRAS, 369, 891
- (22) Moustakas, J. & Kennicutt, R. C. Jr., 2006, ApJ, 651, 155
- (23) Osterbrock, D. E., 1989, Astrophysics of Gaseous Nebulae and Active Galactic Nuclei. Mill Valley, California University Science BookS
- (24) Pagel, B. E. J., Edmunds, M. G., Blackwell, D. E. et al. 1979, MNRAS, 189, 95
- (25) Pagel, B. E. J., Simonson, E.A., Terlevich, R.J., Edmunds, M.G., 1992, MNRAS, 255, 325
- (26) Pettini, M. & Pagel. B. E. J., 2004, MNRAS, 348, L59
- (27) Pilyugin, L. S., 2000, A&A, 362, 325
- (28) Pilyugin, L.S., 2001a, A&A, 369, 594
- (29) Pilyugin, L.S., 2001b, A&A, 373, 56
- (30) Pilyugin, L. S. Thuan, T. X., 2005, ApJ, 631, 231
- (31) Seaton, M. J., 1979, MNRAS, 187, 73
- (32) Skillman, E. D., Kennicutt, R.C.Jr., 1993, ApJ, 411, 655
- (33) Smith, J. A., Tucker, D. L., Kent, S. et al., 2002, AJ, 123, 2121
- (34) Stasinska, G. 2002, astro-ph/0207500
- (35) Strauss, M. A., Weinberg, D.H., Lupton, R.H., 2002, AJ, 124, 1810
- (36) Tremonti, C. A. et al. 2004, ApJ, 613, 898
- (37) Wu, H., Shao, Z. Y., Mo, H. J., Xia, X. Y., & Deng, Z. G. 2005, ApJ, 622, 244
- (38) Yin, S.Y., Liang, Y.C., Hammer, F. et al. 2007, A&A, 462, 535 ‘
- (39) Zaritsky, D., Kennicutt, R. C., Huchra, J. P., 1994, ApJ, 420, 87