Analysis of Molecular Hydrogen Formation on Low Temperature Surfaces in Temperature Programmed Desorption Experiments
Abstract
The study of the formation of molecular hydrogen on low temperature surfaces is of interest both because it enables to explore elementary steps in the heterogeneous catalysis of a simple molecule and due to its applications in astrochemistry. Here we report results of experiments of molecular hydrogen formation on amorphous silicate surfaces using temperature-programmed desorption (TPD). In these experiments, beams of H and D atoms are irradiated on the surface of an amorphous silicate sample. The desorption rate of HD molecules is monitored using a mass spectrometer during a subsequent TPD run. The results are analyzed using rate equations and the energy barriers of the processes leading to molecular hydrogen formation are obtained from the TPD data. We show that a model based on a single isotope provides the correct results for the activation energies for diffusion and desorption of H atoms. These results are used in order to evaluate the formation rate of H2 on dust grains under the actual conditions present in interstellar clouds. It is found that under typical conditions in diffuse interstellar clouds, amorphous silicate grains are efficient catalysts of H2 formation when the grain temperatures are between 9-14K. This temperature window is within the typical range of grain temperatures in diffuse clouds. It is thus concluded that amorphous silicates are good candidates to be efficient catalysts of H2 formation in diffuse clouds.
I Introduction
Few are the studies of the formation of molecular hydrogen on low temperature surfaces. One of the pioneering experiments was done in the 1970’s by the group of Giacinto Scoles, who measured the scattering, sticking and energy deposition of atomic and molecular hydrogen beams on the surface of bolometers (semiconductor thin films) at liquid helium temperature Marenco1972 ; Schutte1976 ; Govers1980 . It was found that both the sticking coefficient and the hydrogen recombination rate depend on the coverage of H2 on the target surface. It was also shown that the heat released in the formation of molecular hydrogen causes the desorption of hydrogen molecules that have been pre-adsorbed on the surface. Thus, a molecule just formed is immediately ejected from the surface. These experiments offered a rare view of the interaction of hydrogen atoms and molecules in the physical adsorption regime and a connection with processes in interstellar space. However, the sample temperature of 3-4 (K) was well below that of interstellar dust grains, the coverage of the sample with atoms/molecules was high and the ice layer not fully characterized. These conditions made it difficult to obtain a quantitative understanding of actual gas-dust grain processes in astrophysical environments.
Molecular hydrogen (H2), the most abundant molecule in the Universe, influences the chemical make-up of the Cosmos Duley1984 ; Williams1998 and is instrumental in the formation of stars by contributing to the cooling during the gravitational collapse of molecular clouds. The challenge of explaining the formation of molecular hydrogen in space begins with the realization that the stabilization of the nascent molecule in the bonding of two (neutral) hydrogen (H) atoms involves the forbidden transition to the ground state. Three-body gas-phase interactions are too rare to contribute significantly to H2 formation in cold clouds Duley1984 , but may take place in other environments such as interstellar shocks. Under conditions observed in interstellar clouds, other gas-phase routes (such as: H H- + , H- + H H2 + ; or, less frequently, H+H+ H, H + H H2 + H+) do not make enough H2 to counterbalance the known destruction rate due to UV photons. Duley1984 .
In the 1960’s, Salpeter and collaborators proposed a model in which H2 formation occurs on the surfaces of interstellar dust grains Gould1963 ; Hollenbach1970 ; Hollenbach1971a ; Hollenbach1971b . These grains are formed in the envelopes of massive late-stars and in novae and supernova explosions. They are made of carbonaceous materials and of silicates. Their sizes exhibit a broad power-law like distribution between 1-100 nm Mathis1977 ; Draine1984 ; Weingartner2001 . Observations of scattered, absorbed and emitted starlight, and laboratory work, show that in the interstellar medium (ISM), silicate grains are amorphous and mostly of composition (FexMg1-x)2SiO4, where Tielens2005 . There is, on average, one dust grain per about 1012 hydrogen atoms, and the grains account for about 1% of the mass of interstellar clouds. Kinematic calculations show that in order to produce enough molecular hydrogen to counterbalance the destruction rate, the catalysis on grain surfaces must be efficient. More specifically, the processes of hydrogen sticking, migration and bond formation on the grains must convert at least about of the adsorbed hydrogen atoms into molecular form Hollenbach1970 .
With some exceptions Hasegawa1992 ; Herbst2003 , chemical models that look at the chemical evolution of an interstellar cloud, have largely ignored or underplayed the coupling of gas and dust. However, observations, experiments and calculations are pointing to the fact that the formation of key ISM molecules [such as H2, formaldehyde (H2CO), and methanol (CH3OH)] takes place on dust grains, as gas-phase reactions are too slow in these particular cases Geppert2006 ; Hidaka2004 ; Watanabe2005 ; Garrod2006 . As far as the formation of molecular formation is concerned, there is a great need to know the basic mechanisms of reaction (Langmuir-Hinshelwood, Eley-Rideal or hot atom), characteristic energies for various processes (diffusion and desorption) and kinetic parameters of dust-catalyzed reactions so they can be used in models of interstellar chemistry.
It is within this framework that in the late 1990’s we began a series of investigations on the formation of molecular hydrogen on analogues of dust grains Pirronello1997a ; Pirronello1997b ; Pirronello1999 . These experiments, inspired by Scoles’ work, were aimed at combining tools of surface science, chemical physics and low temperature physics in order to recreate the environmental conditions of the interstellar space and overcome some of the limitations of prior experiments, such as: high fluxes of H, too low sample temperatures and not adequately characterized materials (For a review of early experiments, see Ref. Vidali1998 ). In practice, the experiments have to be done at low background pressure, low sample temperatures and low fluxes of atoms impinging on the samples. The first two requirements are relatively easily achieved. Even taking special care to obtain fluxes of low energy (200-300K) hydrogen atoms, it is not possible to either produce or detect as low fluxes of atoms as appear in the ISM. Thus, carefully designed theoretical and computational tools need to be used to simulate the actual processes occurring is the ISM using the results of the experiments.
The formation of molecular hydrogen on surfaces has been explored at length in the past, but most of the work has been on characterized surfaces of metals and semiconductors, and at much higher surface temperatures and fluxes (or coverages) than in the regime we are interested in. On low temperature surfaces, efficient recombination can occur only if the mobility of hydrogen is high. There are situations when this does not have to be verified, as in the Eley-Rideal and hot atom mechanisms, in which H atoms from the gas phase directly interact with the target hydrogen atoms or move on the surface at superthermal energy. Such mechanisms have been shown to be working in the interaction of H with H-plated metal Rettner1994 ; Eilmsteiner1996 , silicon Khan2007 and graphite Zecho2002 surfaces. Although there are certain interstellar environments where these mechanisms enter into play, the diffuse cloud environment - where the coverage of H atoms on a grain at any given time is very low - is not one of them. Thus, we expect that H atoms in our experiments to experience physical adsorption forces and the dominant mechanism of reaction is expected to be the Langmuir-Hinshelwood reaction.
In the experiments, the sample is exposed to well collimated beams of hydrogen (H) and deuterium (D) atoms. The production of HD molecules occurring on the surface of a dust grain analogue is measured both during the irradiation with the beams and during a subsequent temperature programmed desorption (TPD) experiment. In order to disentangle the process of diffusion from the one of desorption, additional experiments are carried out in which molecular species are irradiated on the sample and then are induced to desorb.
We first studied the formation of hydrogen deuteride on a telluric polycrystalline sample of olivine Pirronello1997a ; Pirronello1997b . This was followed by studies of HD formation on amorphous carbon and amorphous water ice Pirronello1999 ; Roser2002 ; Roser2003 . Water ice is known [together with other condensables, such as carbon dioxide (CO2), carbon monoxide (CO), and CH3OH] to coat grains in molecular clouds, under conditions of high density, low temperature (10-15K) and in the absence of UV radiation. The high density is important for effective mantle formation, while the low temperature is essential in order to avoid mantle evaporation. Thus, shielding is required from both UV radiation (which causes photodissociation) and from thermal heating sources, namely stars and protostars. Other groups studied the formation of molecular hydrogen on amorphous water ice surfaces Hornekaer2003 as well as the desorption of H2 from these surfaces Hornekaer2005 ; Dulieu2005 ; Amiaud2006 .
Measurements of the kinetic energy of hydrogen molecules emerging from amorphous water ice show that the molecules have nearly thermal energies Roser2003 ; Hornekaer2003 . The ro-vibrational states of excitation of the just-formed molecules leaving the surface were also studied using graphite samples Hornekaer2003 ; Creighan2006 . For a review of recent experimental work on the formation of molecules on astrophysically relevant surfaces see Ref. Williams2007 .
The picture that emerges from the experimental studies on H2 formation is the following. Molecular hydrogen formation takes place via the Langmuir-Hinshelwood mechanism, at least in the range of surface temperatures (during irradiation) that was sampled (5-16K). The results of our TPD experiments were analyzed using rate equation models Katz1999 ; Cazaux2002 ; Cazaux2004 ; Perets2005 . In this analysis the parameters of the rate equations were fitted to the experimental TPD curves. These parameters include the energy barriers for atomic hydrogen diffusion and desorption and the energy barrier for molecular hydrogen desorption. Using the values of the parameters that fit best the experimental results, the efficiency of hydrogen recombination on the polycrystalline olivine, amorphous carbon and water ice surfaces was calculated for interstellar conditions. By varying the temperature and flux over the astrophysically relevant range, the domain in which there is non-negligible recombination efficiency was identified. It was found that the recombination efficiency is highly temperature dependent. For each of the samples, there is a narrow window of high efficiency along the temperature axis, which slowly shifts to higher temperatures as the flux is increased. Contrary to expectations, for astrophysically relevant fluxes, the formation of H2 on polycrystalline olivine occurs in a temperature range which is too low and too narrow for making molecular hydrogen but in very selected environments. On other surfaces, such as amorphous carbon and amorphous water ice, efficient molecular hydrogen formation occurs on a wider sample temperature range, which is within the typical range of grain temperatures in diffuse and dense clouds Katz1999 ; Cazaux2002 ; Cazaux2004 ; Perets2005 .
Since silicates make up a significant fraction of the interstellar dust, and given our results that pointed at a less than optimal efficiency of polycrystalline olivine in catalyzing the formation of molecular hydrogen, we decided to revisit the formation of H2 on such a class of materials. Although crystalline silicates are observed in circumstellar envelopes, in the ISM silicates are mostly amorphous. We thus studied the formation of molecular hydrogen on amorphous silicate samples, (Fex, Mg1-x)2SiO4, , produced by laser ablation (with wavelength of 266 nm) of a mixed MgO, FeO and SiO2 target in an oxygen atmosphere (10 mbar). The optical and stochiometric characterization of the samples produced with this technique is given elsewhere Brucato2002 . Measurements of the amorphous silicate samples by scanning electron microscope show rough surfaces with droplets of different sizes. However, unlike the amorphous water ice, no indications of porosity were observed. A brief report on the formation of molecular hydrogen on an amorphous sample of composition (Fe0.5Mg0.5)2 SiO4 at low irradiation temperature (around 5K) appears in Ref. Perets2007 .
In this paper we present data on the formation of HD at a higher irradiation temperature (10 K) which is at the lower edge of the range of the dust temperature in the ISM. We describe in detail the methodology for analyzing the results of the TPD experiments. We show that the results, based on measurements of HD formation are applicable for the evaluation of H2 formation rate in interstellar clouds. Results from surfaces of samples with other compositions (Fex,Mg1-x)2SiO4, , will be given elsewhere.
The paper is organized as follows: In Sec. II we present a review of the experimental methods. TPD results for HD formation on an amorphous silicate surface are given in Sec. III. The rate equation model is presented in Sec. IV and is used in Sec. V for the analysis of the experimental results. Applications to interstellar chemistry are considered in Sec. VI.
II Review of Experimental Methods
The apparatus consists of two atomic/molecular beam lines aimed at a target located in a ultra-high vacuum (UHV) chamber. The triple differentially pumped beam lines have each a radio-frequency (RF) dissociation source; typical dissociation rates are in the 75-90 range and are measured when the beams enter the sample chamber. The atoms can be cooled by passing them through a short aluminum nozzle connected to a liquid nitrogen reservoir via copper braids. The fluxes and , of H and D atoms, respectively, are both estimated to be equal to (atoms cm-2s-1) Roser2002 .
The detector, located in the main UHV chamber, is a differentially pumped quadrupole mass spectrometer that can be rotated around the sample; it is used to measure the signals proportional to the number of particles in the beams and of the molecules evolving from the surface either during the irradiation phase or during the thermal desorption. The sample is mounted on a liquid-helium cooled sample holder with thermal shields. The sample can be rotated around its axis. A heater in the back of the sample can heat it to 400K for cleaning.
A typical experiment proceeds as follows. During the baking of the apparatus and prior each series of data taking, the sample temperature is taken to K. After cooldown, when the desired sample temperature is reached, the sample is exposed to two converging beams of H and D (prior the pumping down, laser beams are shone through the beam lines to make sure they point at the same spot on the sample). Using two isotopes is essential in order that the fraction of undissociated molecules and the background pressure of H2 will not affect our measurements. During the irradiation phase of the experiment, as well as the subsequent TPD phase, the detector monitors the increase of HD partial pressure due to HD formation on and release from the surface. After irradiation time of (s), the beams are turned off and the sample temperature is raised, either by shutting off the flow of liquid helium or by increasing the power to the heater. The sample temperature vs. time, , is measured by an iron-gold/chromel thermocouple and a calibrated silicon diode placed in contact with the sample. The temperature curves are nonlinear but highly reproducible. To account for this nonlinearity, the TPD curves in Figs. 2-4 show the instantaneous HD desorption rate vs. temperature rather than vs. time. The heating rate is steep in the beginning and gradually decreases. The temperature curves for the experiments analyzed in this paper are shown in the insets in Figs. 1 and 2. The typical irradiation times are 1 to 2 minutes (although, the actual time the sample is exposed to the beam is half that, since the beams are chopped with a mechanical selector of 50% duty cycle). The typical coverages, assuming a sticking coefficient of 1 are of the order of a few percents of a layer.
During the experiment, it is checked that after a thermal desorption there is no re-adsorption of HD on the surface. Also, in the experiments done at the lowest sample temperatures during irradiation (such as 5.6K), care is taken to make sure that the sample remains in this low temperature long enough to reach thermal equilibration (as judged by the repeatability and quality of the results). Further details can be found in other publications Vidali2006 .
III Experimental Results
Here we report TPD results for HD desorption from amorphous silicates of composition (Fex,Mg1-x)2SiO4, where , after irradiation by H+D beams at a sample temperature of 10K. Three specimen were used, yielding comparable results. These results complement and extend those reported in Ref. Perets2007 , where we analyzed TPD results for irradiation of H and D (hereafter H+D) at a low sample temperature (5K) and in which the exposure was varied. In these experiments we find that most of the molecules that form on the surface come off during the TPD; therefore, we focus our analysis on this aspect of the experiment. In a separate set of experiments, beams of HD molecules were irradiated on the same surface.
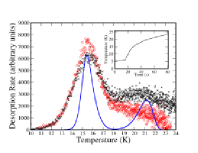
In Fig. 1 we show a typical TPD trace of HD desorption, taken after irradiating the sample, while at 5.6K, with HD molecules () and with H and D atoms (circles). Both curves exhibit a strong peak at about 15-16K and a lower but broad peak (or a shoulder) around 21K. The broad peaks reflect the fact that the surface is disordered. For comparison, a TPD trace taken from a polycrystalline olivine sample is much narrower and has a maximum at a lower temperature Perets2007 .
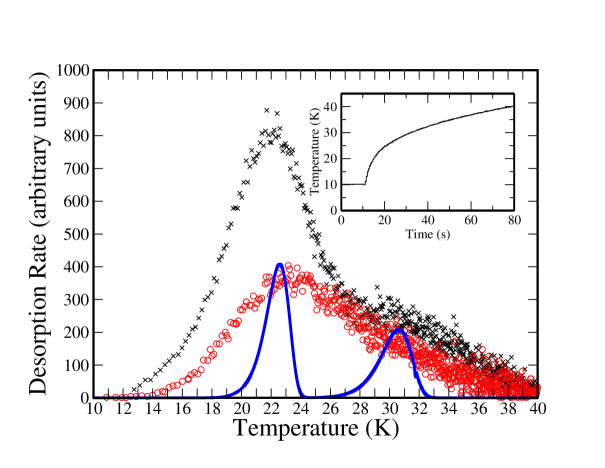
In Fig. 2 we present the desorption rates of HD after irradiation with HD molecules () and H+D atoms (circles) at a sample temperature of K. These TPD traces exhibit two peaks. The main peak coincides with the high temperature peak of Fig. 1. In addition, there is a smaller peak or a shoulder at 31-32K, which does not appear in Fig. 1. However, it turns out that the TPD curve of Fig. 1 was recorded only up to 24K. Therefore, we cannot reject the possibility that a third peak, around 31-32K also appears under the conditions of Fig. 1.
The experiments with HD irradiation provide direct information on the energy barriers for the desorption of HD molecules. Combining the two sets of experiments, we find that there are three types of adsorption sites for molecules: shallow, medium and deep. When HD molecules are irradiated at 5.6K they reside in the shallow and medium depth sites; when the molecules are irradiated at 10K they mostly reside reside in the medium and deep sites. This indicates that during irradiation at 10K the HD molecules have sufficient mobility to hop from the shallow sites to deeper sites before they desorb. The similarity between the TPD curves obtained with HD and H+D irradiations indicates that molecules just formed on the surface quickly thermalize with the surface temperature and occupy the same adsorption sites as those molecules deposited from the gas phase Perets2007 .
In Fig. 3 we present several TPD traces obtained after irradiation with HD molecules at a sample temperature of 10K. The irradiation times are 30 (triangles), 60 (), 120 (circles) and 240 (squares) s. In all cases the main peak is at 22K, as expected for irradiation with molecules, leading to first order kinetics. The high temperature peak appears around 31-32K for all exposures.
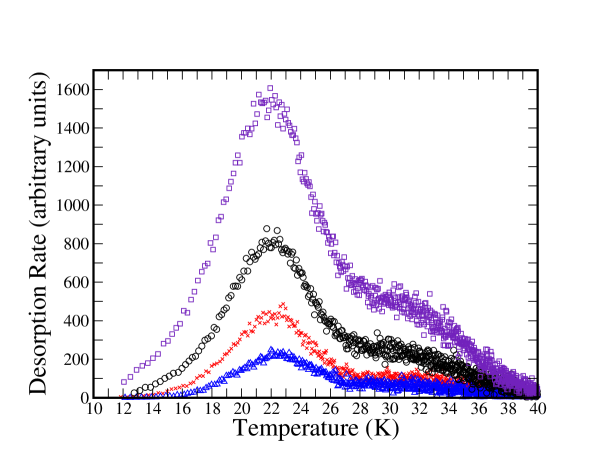
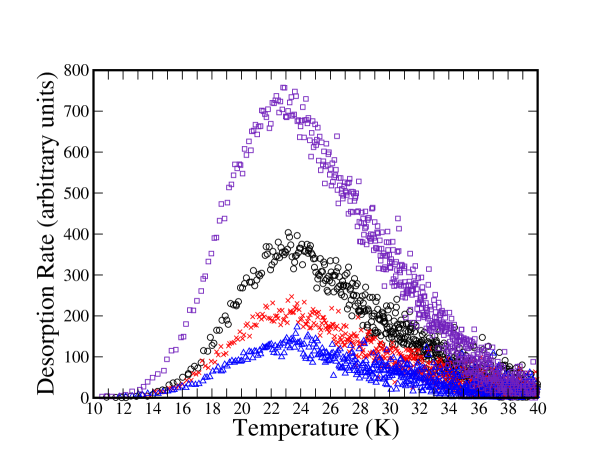
In Fig. 4 we present several TPD traces obtained after irradiation with H+D atoms at a sample temperature of 10K. The irradiation times are 30 (triangles), 60 (), 120 (circles) and 240 (squares) s. The location of the peak is clearly the same for all exposures, indicating a first order kinetics. This peak temperature (around 23K) is only slighly higher than the 22K peak obtained for HD irradiation. However, the peak obtained for H+D irradiation exhibits a broader high temperature wing, which merges with the second peak. The first order feature of the H+D peak for irradiation at of 10K may indicate that some of the molecules are formed during irradiation or at early stages of the TPD run and quickly equilibrate with the surface. However, the broad high temperature wing may indicate that some other molecules are formed at later stages of the TPD run. In this case, the high temperature peak (which is difficult to resolve) may exhibit a combination of first and second order features. The experimental data was analyzed using the rate equation models described below. The results for the energy barriers for diffusion and desorption are summarized in Table I.
IV The Rate Equation Model
Consider an experiment in which beams of H and D atoms are irradiated on a surface. Atoms that stick to the surface hop as random walkers. The hopping atoms may either encounter each other and form H2, HD and D2 molecules, or desorb from the surface in atomic form. As the sample temperature is raised, both the hopping and desorption rates quickly increase. The fluxes of H and D are denoted by and , respectively [in units of monolayer (ML) ]. These fluxes are related to the beam intensities by and , where (cm-2) is the density of adsorption sites on the surface.
The process of molecular hydrogen formation is described by a rate equation model, which includes three surface reactions, namely , and . The surface coverages of adsorbed H and D atoms are denoted by (ML) and (ML), respectively. Similarly, the coverages of the adsorbed H2, D2 and HD molecules are denoted by , and (ML). The time derivatives of the coverages of adsorbed atoms are given by the rate equations
| (1) |
The time derivatives of the coverages of adsorbed molecules are given by
| (2) |
The first terms on the right hand sides of Eqs. (1) represent the incoming flux. For simplicity, we ignore the Langmuir rejection. The second terms in Eqs. (1) represent the desorption of H and D atoms from the surface, while the second terms in Eqs. (2) represent the desorption of molecules. The desorption coefficients are
| (3) |
where is the attempt rate (standardly taken to be ), is the energy barrier for desorption of species , where X H, D, H2, HD or D2, and (K) is the surface temperature. The third and fourth terms in Eqs. (1) and the first terms in Eqs. (2) account for the formation of H2, HD and D2 molecules, where
| (4) |
is the hopping rate of atoms of species X H, D between adsorption sites on the surface and is the energy barrier for hopping. Here we assume that there is no energy barrier for the formation of hydrogen molecules on the surface, namely two hydrogen atoms that encounter each other form a molecule. The desorption rate (ML s-1) of molecular species X is . In particular, the rate of HD desorption is given by
| (5) |
To simplify the analysis and reduce the number of fitting parameters it is desireable to use a model which includes only one isotope of hydrogen. Here we examine the effect of the isotopic difference on the TPD results. Due to its higher mass, the zero point energy for adsorbed D atoms is lower than for H atoms. As a result, the energy barriers for diffusion and desorption of D atoms are expected to be higher than for H atoms. The evaluation of the difference in the activation energies between the H and D isotopes requires detailed knowledge of the atom-surface potentials. Such potentials are not available for the amorphous surfaces of interest here. However, one can obtain a rough idea about the isotope effect by considering the difference between the activation energies of H and D atoms on a graphite surface. In this case, measurements show that the laterally averaged binding energy on the basal plane of graphite, in the ground state level is 31.6 meV for H atoms and it is 3.8 meV higher for D atoms Ghio1980 . The isotopic difference in the energy barriers for diffusion is expected to be at most as large as the difference in the energy barriers for desorption.
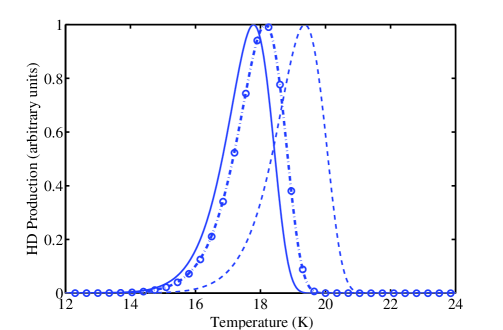
Here we examine the effect of increasing the energy barriers for D diffusion and desorption, keeping those of H atoms unchanged. In Fig. 5 we present the TPD curves obtained from the rate equation model, following irradiation at 5.6K and heating at a constant rate of 0.5K/s. Four curves are shown: the TPD results obtained when the parameters of H and D are identical, and given by Table I (solid line); the energy barrier for desorption of D atoms is raised by 4.0 meV (dashed-dotted line); the energy barriers for desorption and diffusion of D atoms are raised by 4.0 meV (circles); and the energy barriers for desorption and diffusion of both H and D are raised by 4.0 meV (dashed line). We find that raising the energy barriers for desorption (and diffusion) of D atoms gives rise to only a slight shift of the peak to a higher temperature. We conclude that the TPD curves are mainly determined by the isotope that interacts more weakly with the surface. It is thus appropriate to use a simplified model which includes only one isotope. The energy barriers obtained should be interpreted as the barriers for H atoms.
In the models we assume a given density of adsorption sites on the surface. In terms of the adsorption of H atoms, all the adsorption sites are assumed to be identical, where the energy barrier for H diffusion is and the barrier for desorption is . This assumption is justified by the fact that such a simple model provides good fits to the TPD curves obtained after H+D irradiation. If there is a distribution of diffusion energy barriers, the hydrogen atoms are expected to be trapped most of the time in the deep adsorption sites. Thus, the diffusion-induced recombination is expected to be dominated by the deepest wells. This means that the parameters obtained from fitting the TPD curves to the rate equation model characterize the upper edge of the distribution of energy barriers. A more complete model that provides a connection between the roughness and the distribution of energy barriers for H diffusion and desorption was studied in Ref. Cuppen2005 .
As for the adsorption of hydrogen molecules, we assume that the adsorption sites may differ from each other. The energy barriers for desorption of HD molecules can be obtained directly from the TPD curves that follow HD irradiation. These curves, obtained for different surface temperatures during irradiation, reveal a total of three peaks, indicating that there are three types of adsorption sites. In general, we assume that the adsorption sites are divided into types according to the binding energies of trapped HD molecules. Ignoring the isotopic differences for molecules, the energy barrier for desorption of H2 molecules from an adsorption site of type is , where . The parameter represents the fraction of the molecules that are trapped in sites of type upon formation or adsorption and . Let (ML) be the coverage of H2 molecules that are trapped in adsorption sites of type , where . The rate equation model takes the form Perets2005
| (6) |
where . The first term on the right hand side of Eq. (LABEL:eq:NH) represents the incoming flux in the Langmuir kinetics. In this scheme H atoms deposited on top of H atoms already on the surface are rejected. There are indications that adsorbed H2 molecules do not lead to Langmuir rejection of H atoms Govers1980 . The parameter represents an effective flux (in units of ML s-1), namely it already includes the possibility of a temperature dependent sticking coefficient. The second term in Eq. (LABEL:eq:NH) represents the desorption of H atoms from the surface. The third term in Eq. (LABEL:eq:NH) accounts for the depletion of the H atoms on the surface due to diffusion-mediated recombination into H2 molecules. Eq. (LABEL:eq:N2(j)) accounts for the population of molecules on the surface. The first term on the right hand side represents the formation of H2 molecules that become adsorbed in a site of type . The second term in Eq. (LABEL:eq:N2(j)) describes the desorption of H2 molecules from sites of type , where
| (7) |
is the H2 desorption coefficient. The H2 production rate (ML s-1) is given by:
| (8) |
To analyze the diffusion of H2 molecules, one needs to use a more complete model Perets2005 . This model includes additional parameters, namely the energy barriers for hopping of H2 molecules out of sites of type , as well as the partial densities (cm-2) of such sites. It is difficult to extract, from the experimental data, unique values for all these parameters with sufficient confidence.
V Analysis of the Experimental Results
In Ref. Perets2007 we presented a series of TPD traces obtained after irradiation of H and D atoms on an amorphous silicate sample at low surface temperatures (5.6K). Each trace exhibits a large peak at a lower temperature and a small peak at a higher temperature. The location of the low temperature peak shifts to the right as the irradiation time is reduced, suggesting second order kinetics. We should note that a somewhat similar behavior was found in TPD experiments in which D2 molecules were irradiated on amorphous water ice Dulieu2005 ; Amiaud2006 . In that case the second-order like behavior was interpreted as a result of the saturation of the deepest adsorption sites. However, in our experiments the coverage of hydrogen atoms on the surface is very low. Therefore, it is unlikely that saturation effects play a significant role.
This observation indicates that the molecules are formed during the heating and not during the irradiation stage. Thus, the adsorbed hydrogen atoms are immobile during irradiation at 5.6K. This means that tunneling alone is not sufficient in order to provide significant mobility to the adsorbed hydrogen atoms, and their mobility is dominated by thermal activation. A similar conclusion was reached from analysis of data from polycrystalline olivine Katz1999 .
Assuming that the Langmuir rejection mechanism applies, hydrogen atoms that are deposited on top of already adsorbed atoms are rejected. This provides a prediction for the coverage of adsorbed atoms after irradiation time . Taking the Langmuir rejection into account, the coverage is given by Biham2001
| (9) |
In the experiment, the coverage after irradiation can be evaluated using the total yield of HD molecules in each TPD run. The total yields for irradiation at 5.6K and several exposure times were evaluated and fitted according to Eq. (9). It was found that the flux of incoming atoms is (in ML s-1). Since the beam intensities and are known, one can use the relations , where X=H, D, to obtain the density of adsorption sites. It was found that the density of adsorption sites on the amorphous silicate sample is (sites cm-2).
The experimental results were fitted using the rate equation model described above. The parameters for the diffusion and desorption of hydrogen atoms and molecules on the amorphous silicate surface were obtained. These include the energy barrier (meV) for the diffusion of H atoms and the barrier (meV) for their desorption. The value obtained for the energy barrier for desorption should be considered only as a lower bound, because the TPD results are insensitive to variations in , as long as it is higher than the reported value. The desorption energy barriers of HD molecules adsorbed in shallow (lower temperature peak) and deep (higher temperature peak) sites, are given by and (meV).
The rate equation model is integrated using a Runge Kutta stepper. For any given choice of the parameters, one obtains a set of TPD curves for the different irradiation times used in the experiments. The actual time dependence of the temperature, T(t), recorded during the experiment, is taken into account as follows. The rate equations [Eqs. (6)] are integrated numerically using a Runge Kutta stepper. The rate constants for diffusion and desorption [given by Eqs. (3), (4) and (7)], which depend on the temperature, are adjusted during the integration according to the experimentally recorded temperature curve, T(t). Thus the simulation fully reflects the physical conditions during the experiment.
In the first step, the barriers , , for the desorption of molecules are obtained using the results of the experiments in which HD molecules are irradiated on the surface. To obtain better fits of the peak shape, suitable Gaussian distributions of energy barriers around these two values can be incorporated (see Figs. 1 and 2 in Ref. Perets2007 ). However, even with these Gaussian distributions it is difficult to fit the leading edge of the TPD curves. This may indicate that the distribution of the energy barriers is non-symmetric and exhibits a broader tail on the lower side.
A wide range of energies can be expected for a morphologically heterogeneous surface. For example, in a calculation of H adsorption energies and diffusion barriers on a water cluster simulating the surface of amorphous water ice, Buch and co-workers obtained Gaussian distribution for these energies Buch1991a ; Buch1991b .
Using a single value of each barrier, one obtains fits which consist of rather narrow peaks. Their locations coincide with the experimental peaks but they do not capture the tails.
The results of the H+D experiments (circles in Fig. 1) are fitted using the rate equation model (solid line) with the activation energies specified above. The weights of the molecular adsorption sites are chosen to be and . These values reflect the total relative yields of desorbed HD molecules in the two peaks. The results of H+D irradiation at 10K, shown in Fig. 2, were also fitted using the rate equation model. The activation energies, and are the same as above. However, in this case it is found that the molecular adsorption sites indexed by are too shallow to trap molecular hydrogen when the irradiation is done at 10K. To account for this fact we impose . The TPD curve is fitted with (as above) and (meV). The weights are and .
VI Discussion and Applications
The processes of molecular hydrogen formation on amorphous silicate surfaces at low temperatures are based on physisorption forces. The activation energies that we obtained show that these values are higher than expected for other physisorption interactions that have been measured between H and the surface of single crystals Vidali1991 . This is probably due to the more complex chemical and morphological composition of the amorphous silicate samples. Using the parameters obtained from the experiments we now calculate the recombination efficiency of hydrogen on amorphous silicate surfaces under interstellar conditions. The recombination efficiency is defined as the fraction of the adsorbed hydrogen atoms which come out as molecules, namely Biham1998
| (10) |
Under steady state conditions, the recombination rate (ML s-1) is given by , where
| (11) |
Within the assumptions of this model, the binding energies of H2 molecules to the surface do not affect the rate of H2 formation. They only determine the residence time of H2 molecules on the grain and thus affect the steady state coverage of H2 molecules on the surface.
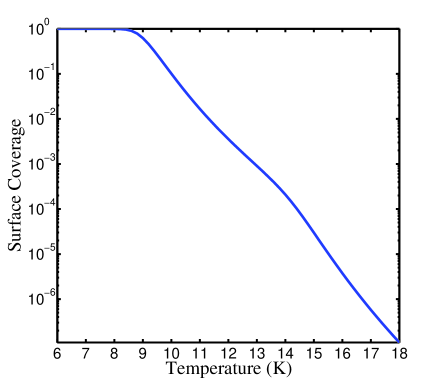
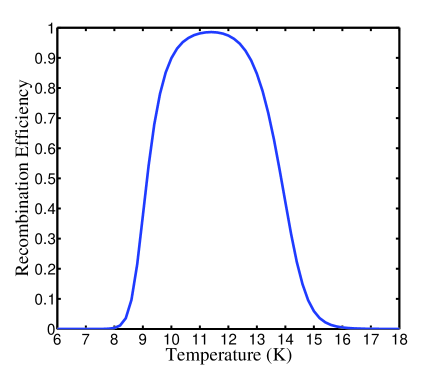
In Figs. 6(a) and 6(b) we present the recombination efficiency and the coverage of H atoms, respectively, vs. surface temperature for an amorphous silicate sample under flux of 5.2 (ML s-1). This flux is within the typical range for diffuse interstellar clouds, where bare amorphous silicate grains are expected to play a crucial role in H2 formation. This flux corresponds to gas density of 100 (atoms cm-3), gas temperature of 100K and a density of adsorption sites per cm2 on the grain surface. A window of high recombination efficiency is found between 9-14K, compared to 6-10K for polycrystalline silicate under similar conditions. The surface coverage of H atoms decreases dramatically within the efficiency window, from nearly full monolayer at 9K to about 10-4 ML at 14K. This is due to the fact that as the temperature increases, the surface mobility of H atoms is enhanced and their residence time before recombination is reduced.
In general, the high efficiency window for hydrogen recombination is bounded from below by Biham2002
| (12) |
and from above by
| (13) |
These bounds are obtained by solving Eq. (LABEL:eq:NH) under steady state conditions for recombination efficiency of 50%. Thus, inside the window the efficiency is higher than 50%, while outside it is lower than 50%. The recombination efficiency declines sharply near these bounds. The width of the high efficiency window is proportional to the difference, , between the diffusion and desorption energy barriers of H atoms. The location of this window exhibits a logarithmic dependence on the flux and slowly shifts to higher temperatures as increases.
At temperatures higher than atoms desorb from the surface before they have sufficient time to encounter each other. At temperatures lower than diffusion is suppressed and the surface is saturated by immobile H atoms. As a result, the Langmuir-Hinshelwood mechanism is no longer efficient. Saturation of the surface with immobile H atoms might render the Eley-Rideal mechanism more efficient in producing some recombination (Katz1999, ; Perets2005, ). Our results thus indicate that the recombination efficiency of hydrogen on amorphous silicates is high in a temperature range, which is relevant to interstellar clouds. Therefore, amorphous silicates seem to be good candidates for interstellar grain components on which hydrogen recombines with high efficiency.
To apply the results of the experiments to H2 formation in the ISM, consider for simplicity a spherical grain of radius . The cross section of such grain is and the number of adsorption sites on its surface is . We denote by the number of H atoms adsorbed on such grain. Its time dependence is given by
| (14) |
The incoming flux density is given by , where (cm-3) is the density of H atoms in the gas phase and is their average velocity. The parameter , is the sweeping rate, which is approximately the inverse of the time it takes for an H atom to visit nearly all the adsorption sites on the grain surface (for a more precise evaluation of the sweeping rate see Refs. Krug2003 ; Lohmar2006 ).
The production rate of H2 molecules on a single grain, is given by
| (15) |
Under given flux and surface temperature, for grains that are large enough to hold many H atoms, Eqs. (6) provide a good description of the recombination process. However, in the limit of small grains and low flux, may be reduced to order unity or less. Under these conditions, Eqs. (6) become unsuitable, because they ignore the discrete nature of the population of adsorbed atoms and its fluctuations.
To account for the reaction rates on small grains, a modified set of rate equations was introduced and applied to a variety of chemical reactions Caselli1998 ; Shalabiea1998 . In these equations the rate coefficients are modified in a semi-empirical way taking into account the effect of the finite grain size on the recombination process. The modified rate equations take into account correctly the length scales involved in the recombination process on small grains Biham2002 . However, they still involve only the average values and ignore fluctuations, thus providing only approximate results for the reaction rates on small grains.
To account correctly for the effects of fluctuations on the recombination rate on small grains, simulations using the master equation are required. The dynamical variables of the master equation are the probabilities of having a population of hydrogen atoms on the grain. In the case of hydrogen recombination, the master equation takes the form Biham2001 ; Green2001
| (16) | |||||
where (the master equation must be truncated in order to keep the number of equations finite). The first term on the right hand side of Eq. (16) describes the effect of the incoming flux. The probability increases when an H atom is adsorbed by a grain that already has adsorbed H atoms, and decreases when it is adsorbed on a grain with atoms. The second term accounts for the desorption process. The third term describes the recombination process. The recombination rate is proportional to the number of pairs of H atoms on the grain, namely . Therefore, the H2 production rate per grain can be expressed in terms of the first two moments of , according to
| (17) |
where
| (18) |
The master equation can be simulated either by direct numerical integration or by a stochastic implementation via Monte Carlo (MC) methods Gillespie1976 ; Charnly2001 . A significant advantage of the direct integration over the MC approach is that the equations can be easily coupled to the rate equations of gas-phase chemistery. However, the number of coupled equations increases exponentially with the number of reactive species, making direct integration infeasible for complex reaction networks of multiple species Stantcheva2002 ; Stantcheva2003 . To solve this problem, two approaches have been proposed: the multiplane method Lipshtat2004 ; Barzel2007c and the moment equations Lipshtat2003 ; Barzel2007a ; Barzel2007b .
The multiplane method Lipshtat2004 is based on breaking the network into a set of maximal fully connected subnetworks (maximal cliques). It involves an approximation, in which the correlations between pairs of species that react with each other are maintained, while the correlations between non-reacting pairs are neglected Barzel2007c . The result is a set of lower dimensional master equations, one for each clique, with suitable couplings between them. For sparse networks, the cliques are typically small and mostly consist of two or three nodes. This method thus enables the simulation of large networks much beyond the point where the master equation becomes infeasible.
The moment equations include one equation for the population size of each reactive species (represented by a first moment) and one equation for each reaction rate (represented by a second moment). These equations are obtained by taking the time derivative of each moment and using the master equation to express the time derivatives of the probabilities Lipshtat2003 . In the resulting equations, the time derivative of each moment can be expressed as a linear combination of first, second and third order moments. To close the set of moment equations one must express the third order moments in terms of first and second order moments. This is achieved by the incorporatin of a suitable truncation scheme of the master equation Lipshtat2003 ; Barzel2007a ; Barzel2007b . The moment equations provide the most efficient incorporation of stochastic grain chemistry, including hydrogen recombination and other surface reactions into models of interstellar chemistry.
VII Summary
We have reported the results of experiments on molecular hydrogen formation on amorphous silicate surfaces, using temperature-programmed desorption. In these experiments beams of H and D atoms were irradiated on the surface of an amorphous silicate sample. The desorption rate of HD molecules was monitored using a mass spectrometer during a subsequent TPD run. The results were analyzed using rate equations. It was shown that a model based on a single isotope provides the correct results for the activation energies for diffusion and desorption of H atoms. The barriers , and , as well as the density of adsorption sites on the surface were obtained.
The results were used in order to evaluate the formation rate of H2 on dust grains under the actual conditions present in interstellar clouds. It was found that under typical conditions in diffuse interstellar clouds, amorphous silicate grains are efficient catalysts of H2 formation when the grain temperatures are between 9-14K. This temperature window is within the typical range of grain temperatures in diffuse clouds. It was thus concluded that amorphous silicates are efficient catalysts of H2 formation in diffuse clouds. The recently developed computational methodologies for the evaluation of reaction rates on interstellar grains were briefly reviewed.
Acknowledgements.
This work was supported by NASA through grants NAG5-9093, NAG5-11438 and NASA 1284471 (G.V), by the Israel Science Foundation and the Adler Foundation for Space Research (O.B), and by the Italian Ministry for University and Scientific Research through grant 21043088 (V.P).References
- (1) Marenco, G.; Schutte, A; Scoles, G.; Tommasini, J. Vac. Sci. Tech. 1972, 9, 824.
- (2) Schutte, A; Bassi, D.; Tommasini, F.; Turelli, A.; Scoles, G.; Hermans, L.J.F. J. Chem. Phys. 1976, 64, 4135.
- (3) Govers, T.R.; Mattera, L.; Scoles, G. J. Chem. Phys. 1980, 72, 5446.
- (4) Duley, W.W.; Williams, D.A. Interstellar Chemistry, Academic Press, London, 1984.
- (5) Williams D.A., Faraday Discuss. Chem. Soc. 1998, 109, 1
- (6) Gould, R.J.; Salpeter, E.E. ApJ 1963, 138, 393
- (7) Hollenbach, D.; Salpeter, E.E. J. Chem. Phys. 1970, 53, 79
- (8) D. Hollenbach and E.E. Salpeter, ApJ 1971, 163, 155
- (9) Hollenbach, D.; Werner, M.W.; Salpeter, E.E. ApJ 1971, 163, 165
- (10) Mathis, J.S.; Rumpl, W.; Nordsieck, K.H. ApJ 1977, 217, 425
- (11) Draine, B.T.; Lee, H.M. ApJ 1984, 285, 89
- (12) Weingartner, J.C.; Draine, B.T. ApJ 2001, 548, 296
- (13) Tielens, A.G.G.M. The Physics and Chemistry of the Interstellar Medium, Cambridge University Press, Cambridge, 2005.
- (14) Hasegawa, T.I.; Herbst, E.; Leung, C.M. ApJ Suppl. 1992, 82, 167.
- (15) Herbst, E.; Shematovich, V.I. Astrophys. Space Sci. 2003, 235, 725.
- (16) Geppert, W.D.; Hamberg, M.; Thomas, R.D.; Österdahl, F.; Hellberg, F.; Zhaunerchyk, V.; Ehlerding, A.; Millar, T.J.; Roberrts, H.; Semaniak, J.; af Ugglas, M.; Källberg, A.; Simonsson, A.; Kaminska, M.; Lrsson, M. Faraday Discussions 2006, 133, 177.
- (17) Hidaka, H.; Watanabe, N.; Shiraki, T.; Nagaoka, A.; Kouchi, A. ApJ 2004, 614, 1124
- (18) Watanabe, N. IAU Symposium 231, Astrochemistry: Recent Successes and Current Challenges, eds. D.C. Lis, G.A. Blake and E. Herbst, Cambridge University Press, Cambridge, UK, 2005, 231, 415.
- (19) Garrod, R.; Park, I.H.; Caselli, P.; Herbst, E. Faraday Discussions, 2006, 133, 51.
- (20) Pirronello, V.; Liu, C.; Shen, L.; Vidali, G. ApJ 1997, 475, L69.
- (21) Pirronello, V.; Biham, O.; Liu, C.; Shen, L.; Vidali, G. ApJ 1997, 483, L131.
- (22) Pirronello, V.; Liu, C.; Roser J.E.; Vidali, G. Astron. Astrophys. 1999, 344, 681
- (23) Vidali, G.; Pirronello, V.; Liu, C.; Shen, L. Astrophys. Lett. and Commun. 1998, 35, 423.
- (24) Rettner, C.T. J. Chem. Phys. 1994, 101, 1529.
- (25) Eilmsteiner, G.; Walkner, W.; Winkler, A. Surf. Sci. 1996, 352, 263.
- (26) Khan, A.R.; Takeo, A.; Ueno, S.; Inanaga, S.; Yamauchi, T; Narita, Y.; Tsurumaki, H; Namiki, A. Surf. Sci. 2007, 601, 1635.
- (27) Zecho, T.; Guttler, A.; Sha, X.; Lemoine, D.; Jackson, B.; Kuppers, J. Chem. Phys. Lett. 2002, 366, 188.
- (28) Roser, J.E.; Manicò, G.; Pirronello, V.; Vidali, G. ApJ 2002, 581, 276.
- (29) Roser, J.E; Swords, S.; Vidali, G.; Manicó, G.; Pirronello, V. ApJ 2003, 596, L55.
- (30) Hornekaer, L.; Baurichter, A.; Petrunin, V.V.; Field, D.; Luntz, A.C. Science 2003, 302, 1943.
- (31) Hornekaer, L.; Baurichter, A.; Petrunin, V.V.; Luntz, A.C.; Kay B.D.; Al-Halabi, A. J. Chem. Phys. 2005, 122, 124701.
- (32) Dulieu, F.; Amiaud, L.; Baouche, S.; Momeni, A.; Fillion, J.H.; Lemaire, J.L. Chem. Phys. Lett. 2005, 404, 187.
- (33) Amiaud, L.; Fillion, J.H.; Baouche, S.; Dulieu, F.; Momeni, A.; Lemaire, J.L. J. Chem. Phys. 2006, 124, 094702.
- (34) Creighan, S.C.; Perry, J.S.A.; Price, S.D. J. Chem. Phys. 2006, 124, 114701.
- (35) Williams, D.A.; Brown, W.A.; Price, S.D.; Rawlings, J.M.C.; Viti, S. Astron. Geophys. 2007, 48, 25.
- (36) Katz, N.; Furman, I.; Biham, O.; Pirronello, V.; Vidali, G. ApJ 1999, 522, 305.
- (37) Cazaux, S.; Tielens, A.G.G.M. ApJ 2002, 575, L29.
- (38) Cazaux, S.; Tielens, A.G.G.M. ApJ 2004, 604, 222.
- (39) Perets, H.B.; Biham, O.; Pirronello, V.; Roser, J.E.; Swords, S.; Manicó, G.; Vidali, G. ApJ 2005, 627, 850.
- (40) Brucato, J.R.; Mennella, V.; Colangeli, L.; Rotundi, A.; Palumbo, P. Planet. Space Sci. 2002, 50, 829.
- (41) Perets, H.B.; Lederhendler, A.; Biham, O.; Vidali, G.; Li, L.; Swords, S.; Congiu, E.; Roser, J.E.; Manicó, G.; Brucato, J.R.; Pirronello, V. ApJL 2007, 661, L163.
- (42) Vidali, G.; Roser, J.E.; Li, L.; Congiu, E., Manicó, G.; Pirronello, V. Faraday Discussions 2006, 133, 125.
- (43) Ghio, E.; Mattera, L.; Salvo, C.; Tommasini, F.; Valbusa, E. J. Chem. Phys. 1980, 73, 556.
- (44) Cuppen, H.M.; Herbst, E. Mon. Not. R. Astron. Soc. 2005, 361, 565.
- (45) Biham, O.; Furman, I.; Pirronello, V.; Vidali, G. ApJ 2001, 553, 595.
- (46) Buch, V.; Czerminski, R. J. Chem. Phys. 1991, 95, 6026.
- (47) Buch, V.; Zhang, Q. ApJ 1991, 379, 647.
- (48) Vidali, G.; Ihm, G.; Kim, Y.-J.; Cole, M.W. Surf. Sci. Rep. 1991, 12, 133
- (49) Biham, O.; Furman, I.; Katz, N.; Pirronello, V.; Vidali, G. Mon. Not. R. Astron. Soc. 1998, 296, 869
- (50) Biham, O.; Lipshtat, A. Phys. Rev. E 2002, 66, 056103.
- (51) Krug, J.;, Phys. Rev. E 2003, 67, 065012.
- (52) Lohmar, I.; Krug, J. Mon. Not. R. Astron. Soc. 2006, 370, 1025
- (53) Caselli, P.; Hasegawa, T.I.; Herbst, E. ApJ 1998, 495, 309
- (54) Shalabiea, O.M.; Caselli, P.; Herbst, E. ApJ 1998, 502, 652
- (55) Green, N.J.B.; Toniazzo, T.; Pilling, M.J.; Ruffle, D.P.; Bell, N.; Hartquist, T.W. Astron. Astrophys. 2001, 375, 1111
- (56) Charnley, S.B. ApJ 2001, 562, L99
- (57) Gillespie, D.T. J. Phys. Chem. 1977, 81, 2340
- (58) Stantcheva, T.; Shematovich, V.I.; Herbst, E. Astron. Astrophys. 2002, 391, 1069
- (59) Stantcheva, T.; Herbst, E. Mon. Not. R. Astron. Soc. 2003, 340, 983
- (60) Lipshtat, A.; Biham, O. Phys. Rev. Lett. 2004, 93, 170601
- (61) Barzel, B.; Biham, O.; Kupferman R. Phys. Rev. E. 2007, 76, 026703.
- (62) Lipshtat, A.; Biham, O. Astron. Astrophys. 2003, 400, 585
- (63) Barzel, B.; Biham, O. ApJ 2007, 658, L37
- (64) Barzel, B.; Biham, O. J. Chem. Phys. 2007, 127, 144703
| Material | (meV) | (meV) | (meV) | (sites cm-2) |
|---|---|---|---|---|
| Amorphous Silicate | 35 | 44 | 35, 53, 75 | 7 |
(a)
(b)