Measurement of the W + jet cross section at CDF
Abstract
A measurement of cross sections in collisions at using the Collider Detector at Fermilab in Run II is presented. The measurement is based on an integrated luminosity of , and includes events with jet multiplicity from to . In each jet multiplicity sample the differential and cumulative cross sections with respect to the transverse energy of the leading jet are measured. For jets the differential cross section with respect to the 2-leading jets invariant mass and angular separation is also reported. The data are compared to predictions from Monte Carlo simulations.
The study of jets produced in events containing a bosons provides a useful test of Quantum Chromo-Dynamics (QCD) at high momentum transfers. Recently a lot of work ref:MCLO has been invested to develop sophisticated Monte Carlo programs capable of handling more particle in the final state at the leading order (LO), or in some cases, next-to-leading order (NLO) in perturbative QCD. Measurements of W + jet cross sections are an important test of QCD and may be used to validate these new approaches. A good understanding of W + jet production is vital to reduce the uncertainty on the background to top pair production and to increase the sensitivity to higgs and new physics searches at the Tevatron and the LHC.
This contribution describes a measurement of the production cross section in collisions at a center of mass energy of 1.96 TeV. The cross section is presented for four inclusive n-jets samples ( 1, 2, 3, 4) as a function of the leading jet transverse energy (). For jets the differential cross section with respect to the 2-leading jets invariant mass and angular separation is also reported. Cross sections have been corrected to particle level jets, and are defined within a limited W decay phase space, closely matching that which is experimentally accessible. This definition, easily reproduced theoretically, minimizes the model dependence that can enter a correction back to the full W cross-section. These results thus offer the potential for extensive tuning of W+jet(s) Monte Carlo approaches at the hadron-level. This analysis is based on of data collected by the upgraded Collider Detector at Fermilab (CDF II) during the Tevatron Run II period.
The CDF II detector ref:CDF is an azimuthally and forward-backward symmetric apparatus situated around the interaction region, consisting of a magnetic spectrometer surrounded by calorimeters and muon chambers.
candidate events are selected from a high electron trigger ( GeV, ) by requiring one good quality electron candidate ( GeV) and the missing transverse energy () to be greater than . To further reduce background contamination, the transverse mass is required to satisfy . In addition, are rejected with a veto algorithm designed to identify event topologies consistent with having a second high electron. The candidate events are then classified according to their jet multiplicity into four inclusive jet samples (). Jet are searched for using an iterative seed-based cone algorithm ref:jetalg , with a cone radius . Jets are requested to have a corrected transverse energy GeV and a pseudorapidity . is corrected on average for the calorimeter response and the average contribution to the jet energy from additional interaction in the same bunch crossing ref:jetnim . No correction is applied for the contribution to the jet energy coming from the underlying event.
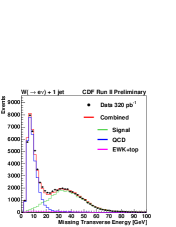
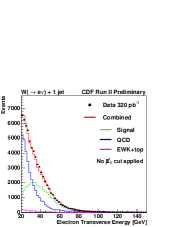
Backgrounds to production are classified in two categories: QCD and W-like events. The latter is represented by events which manifest themselves as real electrons and/or in the final state, namely: , , WW, top pair production. The former is mainly coming from jets production in which one or more jets fake an electron and have mis-measured energy that results in large . While the W-like backgrounds are modeled with Monte Carlo simulations, the QCD background is described with a data-driven technique. To extract the background fraction in each sample the distribution of candidates is fitted to background and signal templates (Fig. 1 upper left-hand side). For this fit the W-like backgrounds and signal are modeled using detector simulated Monte Carlo event samples. The QCD background is modeled using a “fake-electron” event sample, formed from the same candidate trigger dataset by requiring that at least two of the lepton identification cuts fail while maintaining all kinematic requirements. Cross-checks of this method have been performed by looking to other W kinematic distributions as the transverse mass of the W and the electron (fig. 1 upper right-hand side). In all these variables a very good agreement between data and background models has been found.
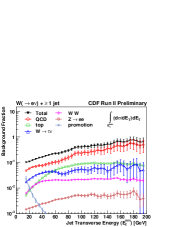
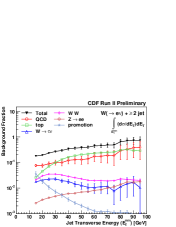
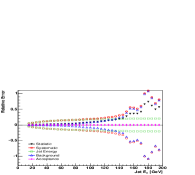
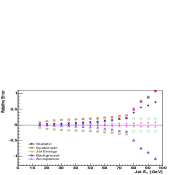
The total background fraction increases with increasing jet multiplicity and transverse energy. At low it is 10% (40%) in the () sample, rising to 90% at the highest . QCD comprises of the background in the sample. At high jet multiplicities and high the top contribution becomes increasingly important, climbing to 50% (80%) of the total background in the () sample. The behavior of the background in the 1 and 2 jet samples is plotted in the lower part of fig. 1, where the background fraction is given as a function of the minimum used to define the sample. The systematic uncertainty on the background estimate derives mainly from the limited statistics of the “fake-electron” sample used to model the QCD background, but at high jet multiplicity the 10% uncertainty on the measured top pair production cross section is also significant. In fig. 2 is plotted the effect of this uncertainty on the cross section for W + 1 and 2 jet as a function of the minimum .
A full detector simulation has been used to take into account selection efficiencies, coming from geometric acceptance, electron identification and and resolution effects. The full CDF II detector simulation accurately reproduces electron acceptance and identification inefficiencies: no evidence of a difference between data and simulation have been found in the sample. To minimize the theoretical uncertainty in the extrapolation of the measurement, the cross section has been defined for the W phase space accessible by the CDF II detector: GeV, , GeV and GeV/c2. This eliminates the dependence on Monte Carlo models to extrapolate the visible cross section to the full W phase space. Nevertheless Monte Carlo events have been used to correct for inefficiency and boundary effects on the kinematic selection that defines the cross section. Different Monte Carlo prescriptions have been checked and the critical parameters have been largely scanned. These effects turned out to be at the 5% level at low . They have been included into the systematic uncertainty on the efficiency which is %, largely independent of the jet kitematic. As shown in fig. 2, the acceptance contribute a small error to the total uncertainty on the cross section.
The candidate event yield, background fractions, and acceptance factors are combined to form the “raw” cross section in each bin of the spectra. The raw cross sections are unfolded for detector effects on the measured jet energies and corrected to the hadron level using Monte Carlo events. Alpgen ref:alpgen interfaced with PYTHIA-TUNE A ref:PYTHIA ; ref:TUNEA provides a reasonable description of the jet and underlying event properties, and is used to determine the correction factors, defined as the ratio of the hadron level cross section to the raw reconstructed cross section, used in the unfolding procedure. To avoid dependence of such a correction on the assumed Monte Carlo hadron level distribution, an iterative procedure is used to reweight the events at the hadron level until the hadron level distribution agrees with the corresponding data-unfolded distribution to within the systematic uncertainties on the measurement. The unfolding factors vary between and over the measured range of . The measured jet energies were varied by as detailed in ref:jetnim , to account for systematic effects introduced by the uncertainty on the calorimeter absolute energy scale. The total systematic on the cross section introduced by the jet energy measurement is dominated by the uncertainty on the absolute energy scale and ranges between 5% and 20%, increasing with .
The measured cross section are shown in fig. 3. Results are presented as both cumulative and differential distribution where is that of the leading jet (upper plots fig. 3). The measurement spans over three orders of magnitude in cross section and close to in jet for the sample. For each jet multiplicity, the jet spectrum is reasonably well described by individually normalized Apgen+PYTHIA samples. The shape of the dijet invariant mass and angular correlation (lower plots fig. 3) are also well modeled by the same theory prediction.
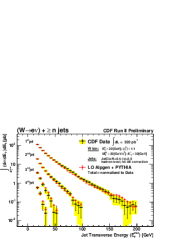
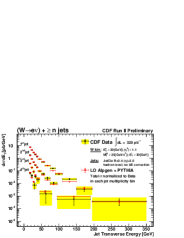
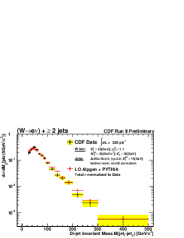
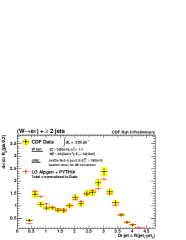
In fig 3 the solid bars represent the statistical uncertainties on the event yield in each bin, while the shaded bands are the total systematic uncertainty which is the sum in quadrature of the effects introduced by the uncertainty in the background estimation, efficiency correction and jet energy measurement (fig. 2). The systematic uncertainty is at low increasing to at high for all cross sections. At low the systematic error is dominated by the uncertainty on the jet energy scale, whereas at high it is dominated by the background uncertainty, in particular, by the limited statistic of the QCD background sample. We expect to reduce drastically this effect by increasing the statistic of the data sample. The behavior of the uncertainties as a function of the is similar for both the the cumulative and differential cross section. The invariant mass shows a similar increase of the uncertainty with increasing di-jet masses. The angualr correlation, on the other hand, has an uncertainty reasonably independent of the separation and dominated by the background subtraction.
In summary, we have measured the cross sections in of collisions at TeV, including events with or more jets produced in association with the boson. The cross sections, defined in a limited decay phase space, have otherwise been fully corrected for all known detector effects. Preliminary comparisons show reasonable agreement between the measured cross sections and the predictions of matched Monte Carlo samples.
References
- (1) M.A. Dobbs et al., hep-ph/0403045, and reference therein.
- (2) D. Acosta et al., [CDF Collaboration], Phys. Rev. D 71 (2005) 032001.
- (3) F. Abe et al., [CDF Collaboration], Phys. Rev. D 45 (1992) 1448.
- (4) A. Bhatti et al., Nucl. Instrum. Meth, A 566 (2006) 566.
- (5) M. Mangano et al., JHEP 0307 001 (2003).
- (6) T. Sjostrand et al., Comput. Phys. Commun. 135 (2001) 238, PHYTIA 6.203.
- (7) T. Affolder et al. [CDF Collaboration], Phys. Rev. D 65 (2002) 092002.