The Black Hole Mass of NGC 4151: Comparison of Reverberation Mapping and Stellar Dynamical Measurements
Abstract
We present a stellar dynamical estimate of the black hole (BH) mass in the Seyfert 1 galaxy, NGC 4151. We analyze ground-based spectroscopy as well as imaging data from the ground and space, and we construct 3-integral axisymmetric models in order to constrain the BH mass and mass-to-light ratio. The dynamical models depend on the assumed inclination of the kinematic symmetry axis of the stellar bulge. In the case where the bulge is assumed to be viewed edge-on, the kinematical data give only an upper limit to the mass of the BH of M⊙ (1). If the bulge kinematic axis is assumed to have the same inclination as the symmetry axis of the large-scale galaxy disk (i.e., 23∘ relative to the line of sight), a best-fit dynamical mass between M⊙ is obtained. However, because of the poor quality of the fit when the bulge is assumed to be inclined (as determined by the noisiness of the surface and its minimum value), and because we lack spectroscopic data that clearly resolves the BH sphere of influence, we consider our measurements to be tentative estimates of the dynamical BH mass. With this preliminary result, NGC 4151 is now among the small sample of galaxies in which the BH mass has been constrained from two independent techniques, and the mass values we find for both bulge inclinations are in reasonable agreement with the recent estimate from reverberation mapping ( M⊙) published by Bentz et al.
1 Introduction
Evidence for the existence of supermassive black holes (BHs) in galactic centers has progressively become stronger over the past decade (see Ferrarese & Ford, 2005, for a recent review). Direct kinematical measurements of BH masses () from tracers of various types have been made in roughly three dozen galaxies. This growth in the number of BHs with mass measurements has led to the discovery of correlations between and various properties of the host galaxies. The measured masses have been found to be correlated with bulge luminosity (Kormendy & Richstone, 1995; McLure & Dunlop, 2002; Marconi & Hunt, 2003; Erwin et al., 2004), bulge mass (Merritt & Ferrarese, 2001; Marconi & Hunt, 2003; Häring & Rix, 2004), the central velocity dispersion of the stellar component (the relationship; Ferrarese & Merritt, 2000; Gebhardt et al., 2000a), the degree of concentration of bulge light (Graham et al., 2001; Erwin et al., 2004; Graham & Driver, 2007), and, possibly, the mass of the surrounding dark matter halo (Ferrarese, 2002).
Most of the BHs that were used to define the and other scaling relationships between BH masses and host galaxy properties reside in quiescent galaxies. However, BHs also power active galactic nuclei (AGNs). In such systems, the brightness of the non-stellar continuum flux from the AGN complicates direct measurement of the BH mass from kinematical tracers around the central object. However, BH masses measured in broad-line AGNs using reverberation mapping (Blandford & McKee, 1982; Peterson, 1993) have also been found to follow a relation (Gebhardt et al., 2000b; Ferrarese et al., 2001; Onken et al., 2003; Nelson et al., 2004). Reverberation mapping relates the properties of gas in the broad-line region (BLR) to variability in the ionizing continuum flux from the central AGN. The time delay between variations in the continuum and the response of a broad emission line arising from the BLR is used to determine the characteristic radius () of the BLR, and the width of the emission line is used to estimate the line-of-sight velocity dispersion of the gas at that radius. Collin et al. (2006) showed that measuring the line width as the second moment of the variable part of the emission line profile () is less biased than using the full width at half maximum (FWHM). The mass is then given as , where is the gravitational constant and is a scaling factor that depends on the BLR geometry and kinematics. Because the BLR is not spatially resolved with current technology, mass measurements from reverberation mapping (and, specifically, the value of ) must be calibrated against BH masses derived through other methods. One way to determine is to use the correlation between central stellar velocity dispersion () and for those galaxies in which reverberation mapping estimates are available. Onken et al. (2004) calibrated the relationship for 16 reverberation-mapped AGNs and calculated the average scaling factor .
Another method of calibrating the BH masses from reverberation mapping is to apply one of the techniques commonly used for estimating BH masses in quiescent galaxies (e.g., dynamical mass estimation from stellar kinematical data) to a reverberation-mapped AGN. This approach is an important step in checking the masses of BHs determined from reverberation mapping since it does not rely on a secondary indicator of the mass (like in the case above). To firmly constrain BH masses, the kinematic measurements must reach inside the sphere of influence, the region wherein the stellar dynamics are dominated by the BH. Satisfying this requirement is particularly challenging in AGNs, in which, at the small angular separations corresponding to the radius of the sphere of influence (), the stellar light is easily overwhelmed by the luminosity from the AGN.
Based on the revised BH masses provided by the reverberation reanalysis of Peterson et al. (2004) and corresponding bulge velocity dispersions measurements (Ferrarese et al., 2001; Onken et al., 2004; Nelson et al., 2004), there are two reverberation-mapped AGNs for which the BH sphere of influence should be spatially resolvable with existing facilities: NGC 3227 (as mentioned above) and NGC 4151, both local broad-line Seyfert galaxies. The BH masses in these two AGNs were recently estimated through observations of their nuclear gas kinematics and by modeling the gas velocity field as a flat, circular disk (Hicks & Malkan, 2007). In addition, Davies et al. (2006) measured the BH mass in NGC 3227 from stellar dynamical modeling. We discuss these results further in § 5. A handful of narrow-line AGNs also have dynamical estimates of their BH masses, but because narrow-line objects are not capable of being reverberation mapped, these objects cannot act as calibrators between the two mass scales.
Here we present the results of a program to measure the BH mass in NGC 4151 via stellar kinematical modeling. In § 2, we describe the imaging and spectroscopic observations as well as the data analysis process. In § 3, we provide a brief overview of the standard 3-integral orbital superposition method of stellar dynamical modeling that we use to fit the data. In § 4, we present the results of the modeling. In § 5, we discuss the implications of our results for the calibration of BH masses from reverberation mapping and future steps.
2 Observations and data analysis
2.1 NGC 4151
NGC 4151 is a disk galaxy with faint spiral arms, a weak large-scale bar, and a prominent bulge. It is one of the original sample of galaxies identified by Seyfert (1943) as having unusual nuclear emission line properties, and has been studied extensively over a wide range of wavelengths (see Ulrich, 2000). The heliocentric radial velocity of the galaxy is 998 km s-1 (Pedlar et al., 1992), implying a distance of 13.9 Mpc if in pure Hubble expansion with km s-1 Mpc-1. However, other estimates of the distance to NGC 4151 have ranged from 10 to 30 Mpc based on various estimates of the Virgocentric infall correction (see the discussion by Mundell et al., 1999). We adopted a distance of 13.9 Mpc, but note that our dynamical estimate of the BH mass scales linearly with distance. For example, applying the local infall correction of Mould et al. (2000) would give a distance of 17 Mpc, increasing our estimated masses by roughly 20%. At our assumed distance of 13.9 Mpc, 1′′ corresponds to 67 pc.
The (distance-independent) reverberation mass estimate for NGC 4151 given by Peterson et al. (2004) was 1.33 M⊙ (from a combination of H and H measurements). However, a recent reanalysis of archival UV monitoring data from the International Ultraviolet Explorer (Metzroth et al., 2006) and a new H reverberation campaign (Bentz et al., 2006b) indicate a higher BH mass: 4.57 M⊙. NGC 4151 has a bulge velocity dispersion of 9314 km s-1 (Ferrarese et al., 2001), which, when combined with the Bentz et al. reverberation mass, gives a sphere of influence with pc or 0.
2.2 Imaging Data
We made use of a set of ground-based BVR images from the MDM 1.3 m McGraw-Hill telescope as well as Hubble Space Telescope (HST) imaging data obtained with the High Resolution Channel (HRC) of the Advanced Camera for Surveys (ACS). Both datasets are part of an independent project designed to study host galaxy contamination in AGN spectra (Bentz et al., 2006a).
2.2.1 Imaging with HST
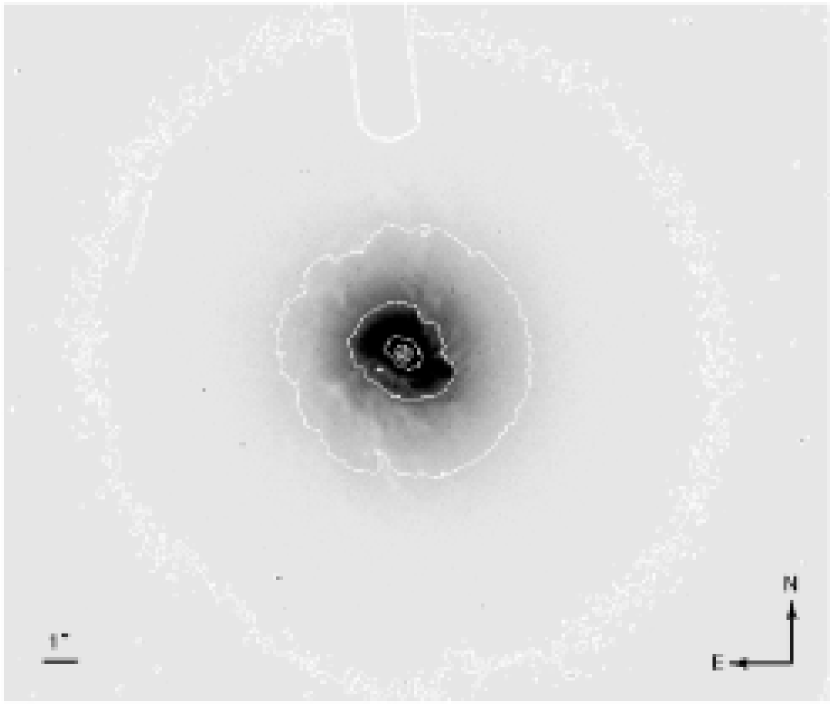
The ACS/HRC data were obtained with the F550M filter and have a total exposure time of 1020 s. The full details of the data reduction are described by Bentz et al. (2006a), and the final HST image is shown in Figure 1. The image has a plate scale of 0025 pixel-1 and a field of view of , with a point spread function (PSF) FWHM of .
2.2.2 Ground-based imaging
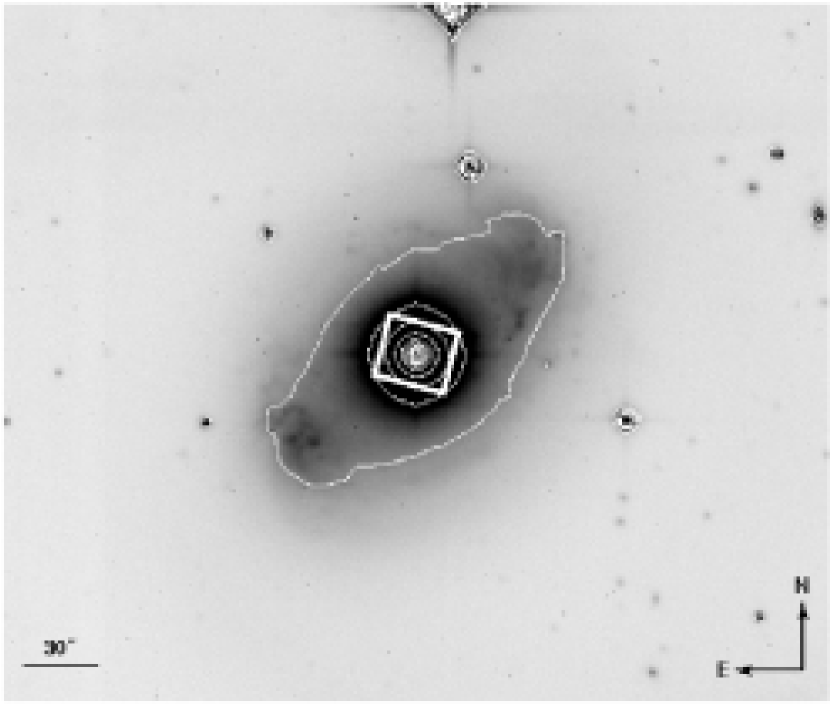
The MDM 1.3 m McGraw-Hill telescope was used with the “Templeton” CCD to take direct images of NGC 4151 in . The respective total exposure times were 1470, 1200, and 1220 s. The images in each filter were bias-subtracted, flat-fielded, registered, and then median-combined. The -band image (Fig. 2) was used to determine the surface brightness profile on large scales (§ 2.3). The image has a plate scale of 0508 pixel-1, a field of view of roughly on a side, and a seeing FWHM of . Flux calibration was achieved through aperture photometry of a star in the image (Eyermann et al., 2005).
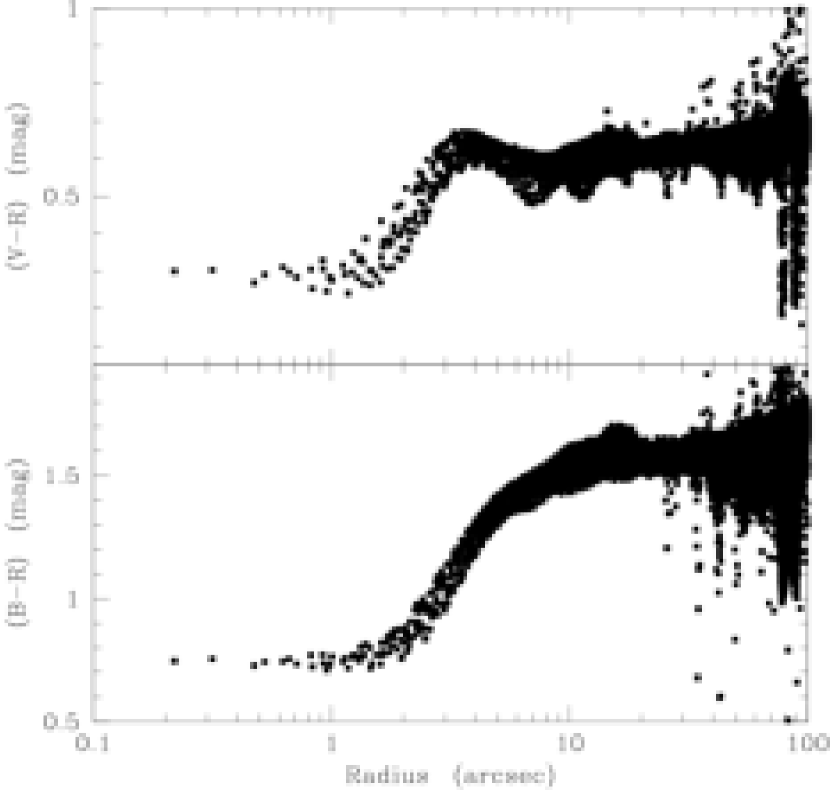
Bell & de Jong (2001) employed models of stellar population synthesis and spiral galaxy evolution, in conjunction with measured rotation curves, to derive relationships between galaxy color and stellar mass-to-light ratio. We used our multi-color imaging data to estimate the -band stellar mass-to-light ratio, (in units of solar masses per -band solar luminosity throughout), as follows. The images were aligned, convolved with Gaussians of appropriate size to bring the PSFs to the same size as the band with the worst seeing, and a pixel-by-pixel color map was created (Fig. 3). The () and () colors were then determined as a function of radius. The strong decrease in () and () near the center is consistent with AGN contamination, therefore we ignored the central 3′′. With ()1.5 mag and ()0.6 mag, we estimated to be (Bell & de Jong, 2001; Bell et al., 2003).
2.3 Surface Brightness Profile Modeling
We derived the surface brightness profile from the MDM -band image and the HST F550M image. As the goal of this procedure was to develop a model for the mass distribution in the galaxy, we needed to remove the AGN contribution to the light profile and extract the stellar surface brightness. The process of removing the AGN light was complicated by the very different spatial characteristics and filter bandpasses of the two images. We used GALFIT111http://zwicky.as.arizona.edu/$∼$cyp/work/galfit/galfit.html, the publicly available 2-D galaxy fitting software (Peng et al., 2002), to remove the AGN contamination. In order to most accurately subtract the AGN flux, we performed a multi-component fit to the major surface brightness features of the galaxy and jointly determined the galaxy properties and the AGN flux to be removed.
For the MDM -band image, we subtracted a sky level equal to the median flux beyond the visible extent of NGC 4151, and fit two Sérsic profiles (one for the disk and one for the bulge), allowing the Sérsic index to be a free parameter in each component. We also used a PSF for the AGN emission that was based on one of the stellar profiles in the image. The fit was done in several steps, initially masking out the bulge and nucleus in order to fit the disk. Next, we removed the mask from the bulge and used the earlier results from the disk-only fit as the starting values for the disk component. Then we removed the mask from the nucleus and allowed the nuclear magnitude to vary. We left the mask in place over several stars in the field and over a number of bright knots near the ends of the weak bar in NGC 4151. Because of slight differences in the profile shapes of the stellar PSF and the AGN light (possibly due to small image distortions between the positions of the AGN and PSF star in the field of view), manual adjustment of the PSF magnitude and position was required to produce the final fit. The best-fit Sérsic index values for the disk and bulge components were 0.73 and 1.48, respectively.
The small field of view of the HST image meant there were no galaxy-free regions from which to measure the sky flux. Instead, the background count rate for the HRC in the F550M filter was retrieved from the ACS Instrument Handbook (Pavlovsky et al., 2004) and was multiplied by the total exposure time to estimate the background flux. The effective radii of the two Sérsic profiles from the fit to the MDM image were converted to the appropriate pixel scale for the HST image and held fixed. The total magnitudes of the components were allowed to vary to account for differences arising from the different bandpasses between the images. We attempted to model the HRC PSF with Tiny Tim222http://www.stsci.edu/software/tinytim/tinytim.html, which produces PSFs for the various HST instruments at any desired position in the field. Tiny Tim also allows one to input a user-defined spectrum to better match any chromatic distortions in the optical path. We joined two archival Space Telescope Imaging Spectrograph (STIS) spectra of NGC 4151 taken with the G430L and G750L low-resolution gratings and a slit (Nelson et al., 2000), and fed the resulting spectrum to Tiny Tim. However, the output PSF proved to be a poor match to the nuclear emission. We searched for all archival stellar images taken with the HRC in the F550M filter. Unfortunately, this search turned up only a handful of white dwarf observations, all with relatively short exposure times. The best of these was a 2 s image of BD+17∘4708 (Bohlin & Gilliland, 2004), and this image was then used as our HRC PSF.
There were some strong residuals around the best GALFIT fit to the HST image, but it was unclear whether they were primarily due to dust obscuration or to [O III] 5007 emission leaking into the F550M bandpass. To assess the latter possibility, we retrieved an [O III] image of NGC 4151 taken with the linear ramp filter on the Wide Field Planetary Camera 2 (WFPC2) instrument of HST (Hutchings et al., 1999). After registering the images and resampling the HRC image to the slightly larger pixel scale of WFPC2, we were unable to find a scaling factor for the [O III] image that produced a satisfactory subtraction of the remaining residuals. While some of the positive-flux regions in the residual image may have been due to [O III] emission, it is likely that dust obscuration also played an important role in shaping the F550M image morphology. Ultimately, these regions were simply included as-is in the GALFIT fitting procedure.
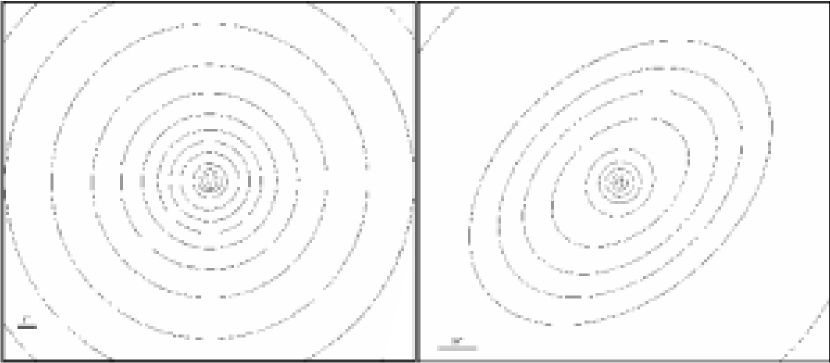
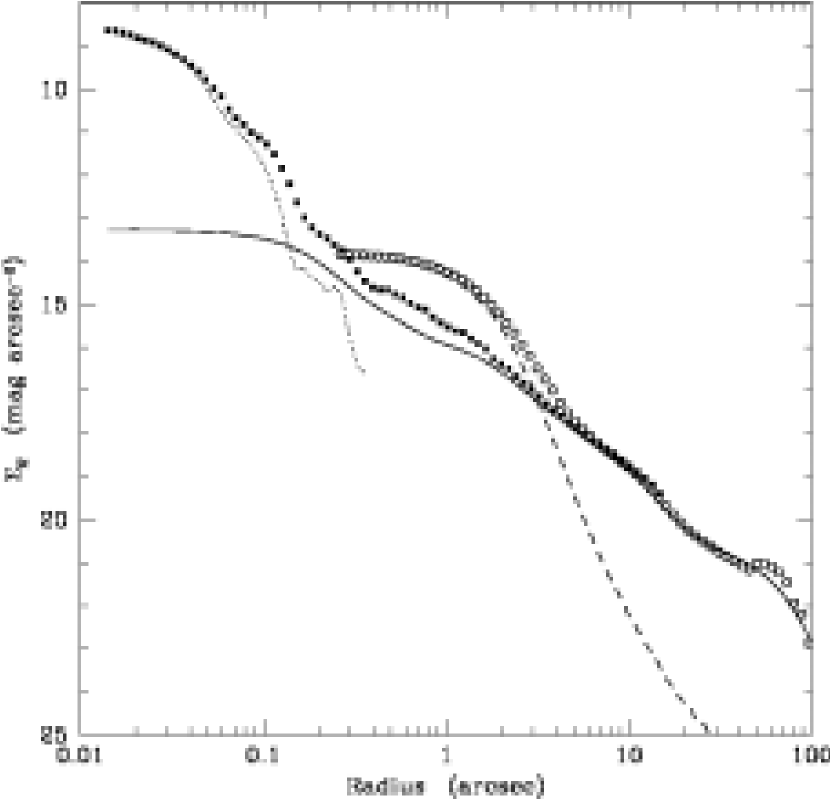
With the AGN emission subtracted, we employed the Multi-Gaussian Expansion (MGE) routine described by Cappellari (2002) to deproject the surface brightness distribution into a 3-D luminosity model. The MGE routine fits a series of concentric elliptical Gaussians to the 2-D galaxy image. (The program has been made publicly available333http://www.strw.leidenuniv.nl/$∼$mcappell/idl/ for use with IDL444http://www.rsinc.com/idl/.) The fit was performed simultaneously to the MDM and HST images, and this allowed us to rescale the HST flux level to match that of the MDM image where the two overlapped in radius. The scaling was consistent with that expected from the differences in plate scale and filter bandpass. We then tied the overall flux calibration to that determined by the stellar photometry in the -band. This approach had the advantage that the dynamical values could then be compared to the estimates from the multi-color MDM photometry. Adopting an -band extinction555Retrieved from NED: http://nedwww.ipac.caltech.edu/ in the direction of NGC 4151 of =0.074 mag (Schlegel et al., 1998), we converted the MGE output of flux in each Gaussian to solar luminosities (Table 1). The 2-D contours of the MGE model are shown in Figure 4 (with the same size scale as Figures 1 & 2), and the major-axis -band surface brightness profiles of both the raw data (determined with the IRAF task ELLIPSE) and the AGN-free MGE output are shown in Figure 5.
2.4 Spectroscopic Data
We acquired spectroscopic data at the MMT Observatory, and we revisited the Kitt Peak National Observatory (KPNO) spectra of NGC 4151 that had been used by Ferrarese et al. (2001) to determine . The stellar dynamics were determined using the Ca II triplet (hereafter CaT) stellar absorption lines at 8498, 8542, and 8662 Å. We extracted the stellar kinematics along the two (different) position angles (PAs) of the MMT and KPNO data.
2.4.1 MMT Spectra
We observed NGC 4151 and velocity standard stars with the Blue Channel Spectrograph at the 6.5 m MMT on UT 29 May 2004. We used the 1200 lines mm-1 grating with the LP-530 order-blocking filter, a 1′′ slit width, and the “ccd35” detector. The spectra were centered at 8600 Å for measurement of the CaT with a dispersion of 0.50 Å pixel-1 and a resolution of 1.4 Å. The plate scale was 03 pixel-1, and the PA was 69∘. While the photometric conditions were quite good, strong and gusty winds caused both poor seeing and problematic guiding (yielding a final spatial profile with FWHM). Our total exposure time was 11700 s.
The spectra were rectified and wavelength-calibrated using the bright sky lines that permeate the observed spectral region (the same wavelength solutions were applied to the spectra of a K-giant star, HR 4521, as the stellar exposures were too short for sky lines to appear and the lines present in the HeNeAr calibration lamp spectra were much more sparse). Flat field spectra taken among the observations of NGC 4151 were employed to remove the strong fringing (20% peak-to-peak) present in the spectra. Although the corrections left residual fringes of nearly 10%, the spectral regions around the bluest two lines of the CaT were free from contamination, and so we limited our subsequent analysis to those lines.
2.4.2 KPNO Spectra
The work of Ferrarese et al. (2001) used the Ritchey-Chrétien Spectrograph on the Mayall 4 m telescope at KPNO on UT 9 April 2001 to measure the bulge velocity dispersion of NGC 4151. Details of the observations were fully described in Ferrarese et al. (2001), but we restate the key features here. The observations were taken with a 2′′ slit at PA=135∘, the detector plate scale was 069 pixel-1, and the spectral resolution was Å. The total exposure time was 3600 s.
The observations were rectified and wavelength-calibrated with the sky lines present in the spectra, and then combined. Spectra of the star HR 4521 were obtained for the absorption line profile measurements and were reduced in the same way as the AGN data.
2.5 Spectroscopic Analysis
The MMT spectra were extracted in 1-pixel (03) apertures out to (40 pixels), tracing along the peak of the spatial profile. While the seeing disk (modeled as a Gaussian with ) was much larger than our individual extraction windows, the dynamical modeling routine took the seeing into account when fitting to the observed kinematics. To isolate the CaT lines for profile fitting, the extracted spectra were normalized with a high-order spline fit to the continuum, any remaining fringing, and several AGN emission features.
Because of the lower signal-to-noise ratio, , in the KPNO data, extractions were made with a variable window size, ranging from 1 pixel (069) at the peak of the light to a 7-pixel width in the furthest bins (extending to distances of 20 pixels, or ). The seeing for these observations was modeled as a Gaussian with .
The spectroscopic data were analyzed with the Penalized Pixel-Fitting (pPXF) method of Cappellari (2004)666The IDL routine is publicly available from http://www.strw.leidenuniv.nl/$∼$mcappell/idl/.. The pPXF program finds the best fit to the line-of-sight velocity distribution (LOSVD) based on a maximum penalized likelihood approach to the broadening of a template spectrum. The method parametrizes the LOSVD in the standard way as a Gauss-Hermite series (van der Marel & Franx, 1993; Gerhard, 1993), which we limited in our analysis to the first four terms (, , , ), where is the radial velocity, is the velocity dispersion, and and are the coefficients of the next two elements of the Gauss-Hermite expansion.
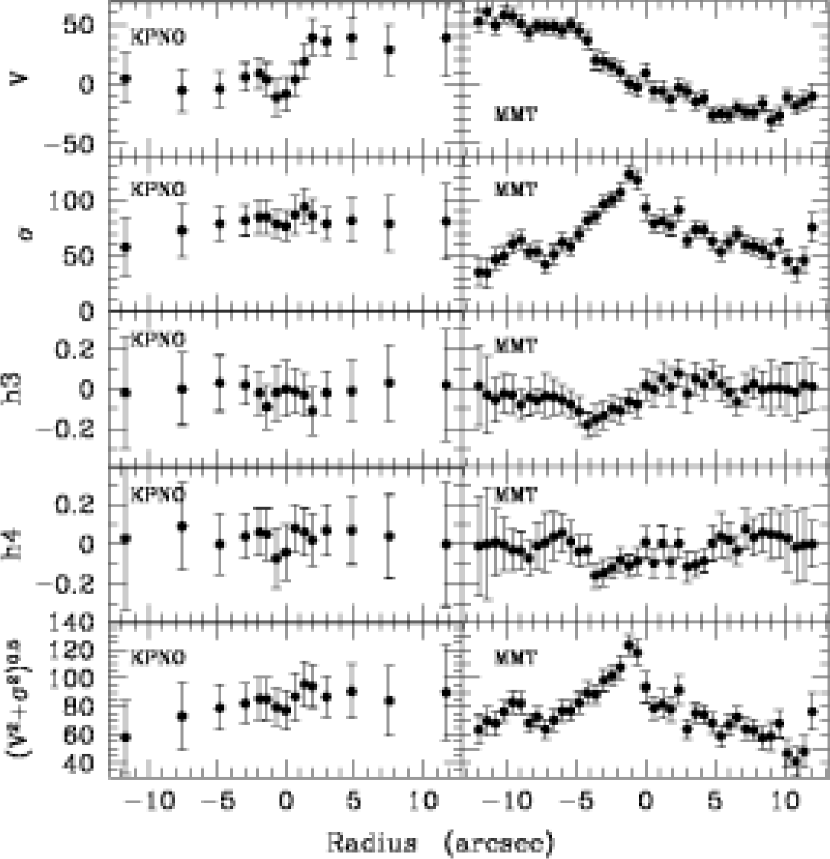
The pPXF routine uses a stellar spectrum as its template and simultaneously fits to all desired Gauss-Hermite terms over a user-defined wavelength region. The ability to select multiple fitting regions allowed us to exclude regions of noise or AGN emission that might lie between the stellar absorption lines we are trying to measure. Each of the extracted spectra from the MMT and KPNO data were run through the pPXF algorithm with a corresponding stellar template. HR 4521 was the only template common to both datasets. Thus, to minimize systematic differences between the MMT and KPNO results, and because the CaT is generally insensitive to problems from mismatched stellar templates (Barth et al., 2002), we limited our analysis to the single template star. The resulting kinematic parameters are shown in Figure 6 and listed in Table 2.
In addition to the narrow-aperture extractions described above, the MMT spectrum was extracted with a width of to provide an independent measurement of the bulge velocity dispersion. Applying the pPXF procedure gave km s-1, reasonably consistent with the results of both Ferrarese et al. (2001; km-1) and Nelson et al. (2004; km s-1).
2.6 Target-of-Opportunity Observations with STIS
One way to minimize the problem of nuclear glare when attempting to measure stellar features in an AGN is to take advantage of the variable nature of the nuclear emission and observe the target when the AGN is dim. We obtained Target-of-Opportunity (ToO) observations of NGC 4151 with STIS on HST. Monitoring of both NGC 4151 and NGC 3227 was carried out with ground-based spectroscopy at the Crimean Astrophysical Observatory (CrAO) and with space-based X-ray flux measurements from the Rossi X-ray Timing Explorer (RXTE).
The threshold for triggering the ToO observation had been derived from ground-based -band observations and bulge-disk-nucleus decompositions of NGC 3227 and NGC 4151 (Virani et al., 2000). These data allowed us to estimate the stellar flux we could expect to fall within the STIS slit and also to independently examine the effects on the of varying the nuclear brightness. We assumed a stellar contribution near the center of each galaxy to be roughly like an elliptical galaxy (flat in ), with a spatial distribution given by the bulge fit of Virani et al. (2000). Thus, we were able to parametrize the exposure time as a function of the nuclear non-stellar flux. We calculated the thresholds of nuclear flux for each target that allowed us to reach our desired stellar of 50 Å-1 in a reasonable amount of exposure time. For NGC 4151, this threshold was equal to erg s-1 cm-2 Å-1, which the AGN had been near in the recent past.
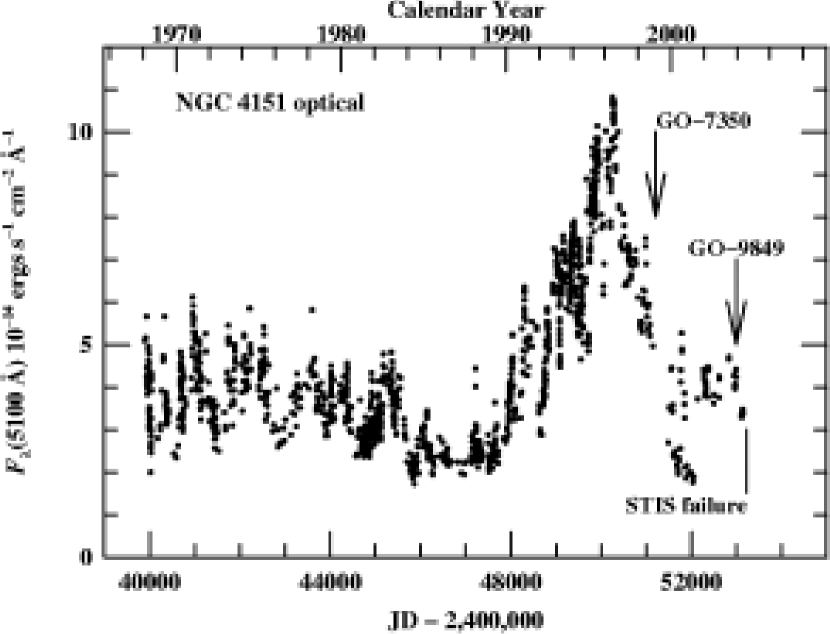
On 2003 November 19, the CrAO observations of NGC 4151 indicated that the continuum flux level had fallen below the triggering threshold. Figure 7 shows a historical light curve for NGC 4151 and indicates with arrows the date of a previous STIS observation (a shorter exposure that employed the STIS occulting bar to block the nuclear light, but which also blocked the stellar signature near the BH), the date when our ToO observation began, and when the STIS instrument stopped functioning.
The STIS observations were executed on UT 2003 December 15 and 19. The instrumental setup consisted of the G750M grating and the 52 slit, oriented with a PA of 69∘. The total exposure time was 29730 s. In addition to the observations of NGC 4151, spectra of HR 4521 were obtained on UT 2003 December 26 with the same instrumental setup to act as our comparison for the CaT line profiles.
While the continuum flux stayed close to the threshold value between the ToO triggering on 2003 November 20 and the actual time of observation, the extracted STIS spectrum does not show the presence of the CaT lines, and so we were unable to use the STIS data to constrain the stellar kinematics near the BH in NGC 4151.
The lack of absorption lines can be used to place upper limits on the number of giant stars in the central region of NGC 4151. The spectrum of the comparison star HR 4521 was used to estimate the maximum number of such stars that could exist in the center of NGC 4151 without producing measurable lines. HR 4521 has a Hipparcos parallax measurement of 15.800.59 mas, implying a distance of 63.32.4 pc. We then scaled the luminosity of HR 4521 to the flux appropriate for our assumed distance of NGC 4151 (13.9 Mpc), and found the multiplicative factors required to produce visible spectral features when subtracting the scaled stellar spectra from NGC 4151 spectra of different aperture sizes. For the inner 01 (6.7 pc), we derived an upper limit of giant stars. A wide-aperture extraction (, or 200 pc 6.7 pc) only increased the upper limit to 1.25 stars. For comparison, the mass enclosed within a radius of 7 pc at the center of the Milky Way is M⊙, only about 10% of which is accounted for by the BH (see Melia & Falcke, 2001). Approximately 1% of the stellar mass within that region of the Milky Way is composed of bright giants (Genzel et al., 1996), giving roughly 2 M⊙ and the equivalent number of stars (assuming an old bulge stellar population). Whether we take the NGC 4151 bulge mass estimate of Wandel (2002; a factor of 4 smaller than the Milky Way bulge mass given by Bissantz et al. 1997), or we estimate the bulge mass from the - relation of Häring & Rix (2004; a factor of 3 larger than the Milky Way bulge), the lack of CaT absorption is consistent with NGC 4151 having a similar bright giant fraction as the Milky Way.
As noted by Bentz et al. (2006a), ground-based imaging data often are insufficient to make an accurate galaxy decomposition. Thus, our reliance on the ground-based imaging analysis of Virani et al. (2000) to estimate the appropriate exposure time for the STIS observation may have contributed to our failure to detect the stellar absorption features. However, it is also possible that the CaT lines were filled in by emission arising from either young stars near the center of NGC 4151 or from the AGN itself.
3 Dynamical Modeling
We carried out dynamical modeling of the kinematical and imaging data using the now standard method of orbit superposition first described by Schwarzschild (1979). This allowed us to set dynamical constraints on the possible values of the BH mass () and the stellar mass-to-light ratio () that are consistent with the surface brightness and spectral data. The modeling algorithm we used is the one described by Valluri et al. (2004; hereafter VME04) and we refer the reader to that paper for a detailed description of the method.
We constructed a 3-D mass model of the galaxy by deprojecting the surface brightness distribution produced by the MGE routine (§ 2.3), using the method outlined by Cappellari (2002), and assuming an error of in each mass cell. We also assumed an inclination angle of the bulge (described below) and, to normalize the mass density, a value for , which was constant with radius. An unknown point mass () representing the central supermassive BH was added to the mass distribution and a large set of orbits were integrated in the resultant gravitational potential for every pair of parameters (, ), building an orbit library for each (, ) combination. We constructed models for a wide range of values of and (12–17 different values of and 8–16 values of ).
Two different inclination angles were used to model the bulge. The large-scale galaxy disk is somewhat inclined to the line of sight (the rotation axis of the disk having an inclination of relative to the line of sight; Simkin, 1975). However, the bulge appears very close to circular in projection (axial ratio ), suggesting that it is nearly spherical. We therefore constructed two sets of models. We first assumed that the bulge is viewed edge-on () and has its kinematic symmetry axis in the plane of the sky. The assumption of edge-on axisymmetry should be reasonable for orbits near the BH. We also constructed a second set of models for which we assumed that the rotation axis of the axisymmetric bulge has an inclination of . Because of these motivations for the two particular values of the inclination, we treat the cases independently, rather than marginalizing over the inclination.
The presence of a weak, large-scale bar in NGC 4151 is noticeable beyond 50′′ and is expected to result in non-axisymmetric motions in the stellar orbits, which cannot be modeled by our axisymmetric code. Although the bar is expected to be kinematically weak (Mundell & Shone, 1999), we restricted our models to fit the light distribution between 000015 (0.01 pc) and 50′′ (3.35 kpc). Again, within this radius, the projected isophotes were almost circular.
The total number of luminosity constraints from the surface brightness profile was 266 (the inner 196 from the HST photometry, and the remainder from the MDM photometry). Kinematical constraints () were available for 58 apertures within ′′ from the KPNO and MMT observations. Since the kinematical quantities (especially and ) obtained with both spectrographs were not symmetrical with respect to the center of the galaxy, the data at each slit position were averaged with those from , as is standard procedure. The Schwarzschild orbit superposition code assumes that the mass distribution is axisymmetrical. Consequently when the mass contribution of an orbit is stored in the library, it is stored on a grid in the meridional plane of the galaxy in cylindrical polar coordinates. However since we fit the kinematical data in the plane of the sky, the kinematical information from the orbit library was stored in the plane of the sky. It is necessary to symmetrize the kinematical data because if one does not do so, the model will try to simultaneously fit non-axisymmetric kinematical features and an axisymmetric mass distribution. Since these conditions are physically inconsistent with each other, the solutions obtained have poor and are biased. The total number of kinematical constraints modeled were 4 Gauss-Hermite parameters 29 apertures.
Each model was constructed with an orbit library consisting of 8100 different orbits. The contributions of each orbit to the observed LOSVDs and the deprojected luminosity distribution were determined. A non-negative least squares programming routine (Lawson & Hanson, 1995) was used to find the weighted superposition of the orbits that best reproduced both the assumed model stellar density distribution and the observed kinematical data.
Smoothing, or “regularization”, of the orbital solutions is typically performed in this type of analysis, and a variety of methods have been employed to that end. One can locally smooth the phase space (Cretton et al., 1999), impose a “maximum entropy” constraint (Gebhardt et al., 2003), or include a penalty function with an adjustable smoothing parameter (VME04). In the case of the penalty function, poorly selected values of the smoothing parameter can generate misleading results (VME04). For example, over-smoothing effectively restricts the range of allowed orbits, and can give erroneous best-fit values of . Here we present models without regularization. From VME04, we know that models without regularization give the full range of parameters allowed by the data. Regularization mainly helps to reduce the sensitivity of the solutions to noise in the data by requiring a smoother sampling of the orbit libraries used in the solution. However, when the unregularized solutions give a poor fit to the data, regularization does not improve the constraints obtained on the parameters.
Without regularization, the number of orbits used in the fits is generally equal to the number of constraints. In the edge-on model, orbit libraries employing half the number of orbits produced no difference in the results. In contrast (as described below), small changes in the orbit library size for the inclined model indicated some sensitivity to the number of orbits used, although not in a systematic manner. Since the number of orbits available influences the uncertainties in the solution (VME04), we analyzed both the inclined and edge-on cases with 8100 orbits, providing the most uniform comparison of the models.
4 Results of 3-Integral Modeling
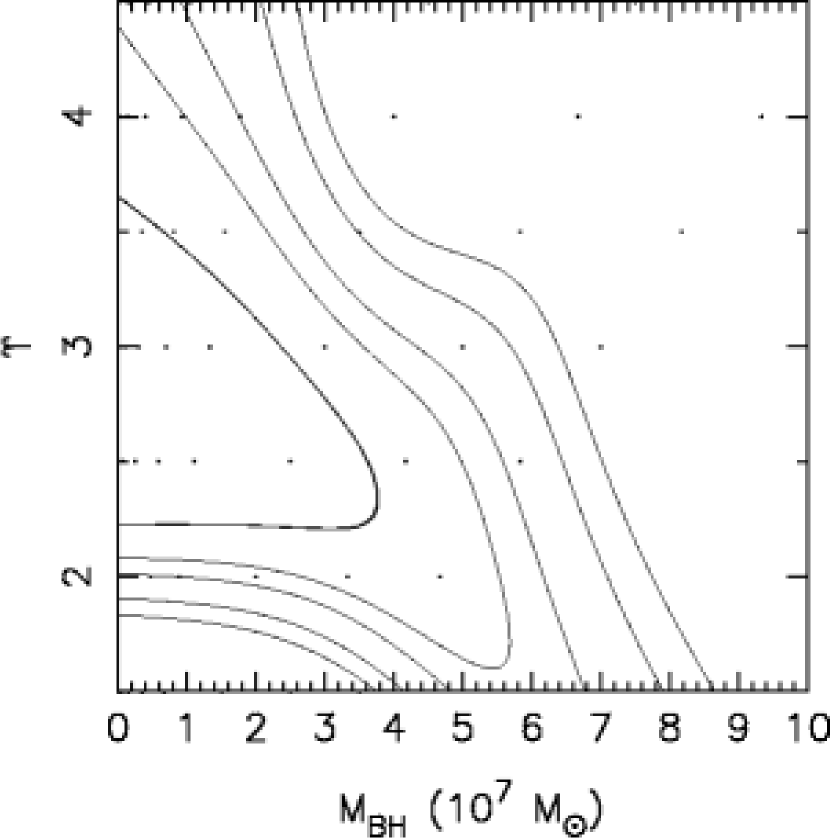
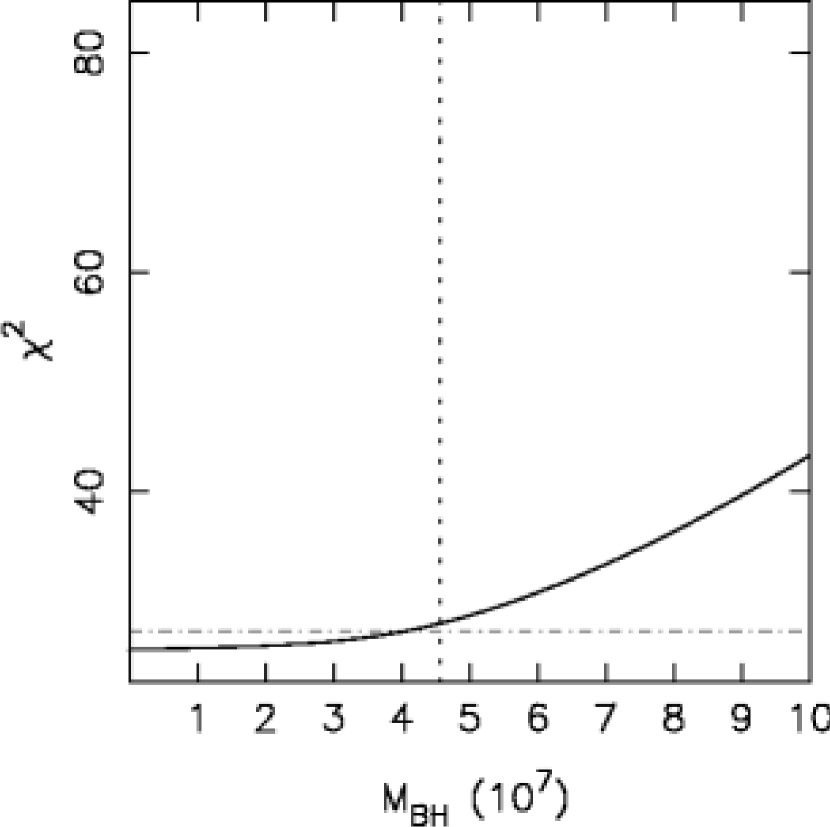
We present the results of 3-integral modeling with orbit libraries consisting of 8100 orbits each, which were fit to all of the available kinematic and photometric data. Figure 8 shows 2-dimensional contour plots of the total as a function of (abscissa) and for models which assumed that the bulge is viewed edge-on (). The models covered 12 values of and 8 values of (indicated by the grid of points); the inner 5 contours are plotted at which correspond to 68.3%, 90%, 95.4%, 99%, 99.73% confidence intervals, assuming two degrees of freedom (DoF). The innermost contour gives a 1 upper limit of M⊙ (for 2 DoF) but no best-fit value of the BH mass, since the values of are all comparable at smaller masses. The value of the mass-to-light ratio corresponding to the mass upper limit is = 2.3, roughly consistent with the estimate from the ground-based photometry in § 2.2.2. Figure 9 shows a 1-dimensional cut through the 2-dimensional contour plot at the value of = 2.3. The horizontal dot-dash line is at , which corresponds to the confidence interval for two DoF. The vertical dashed line in Figure 9 is at the location of the best-fit BH mass obtained from reverberation mapping studies: M⊙ (Bentz et al., 2006b).
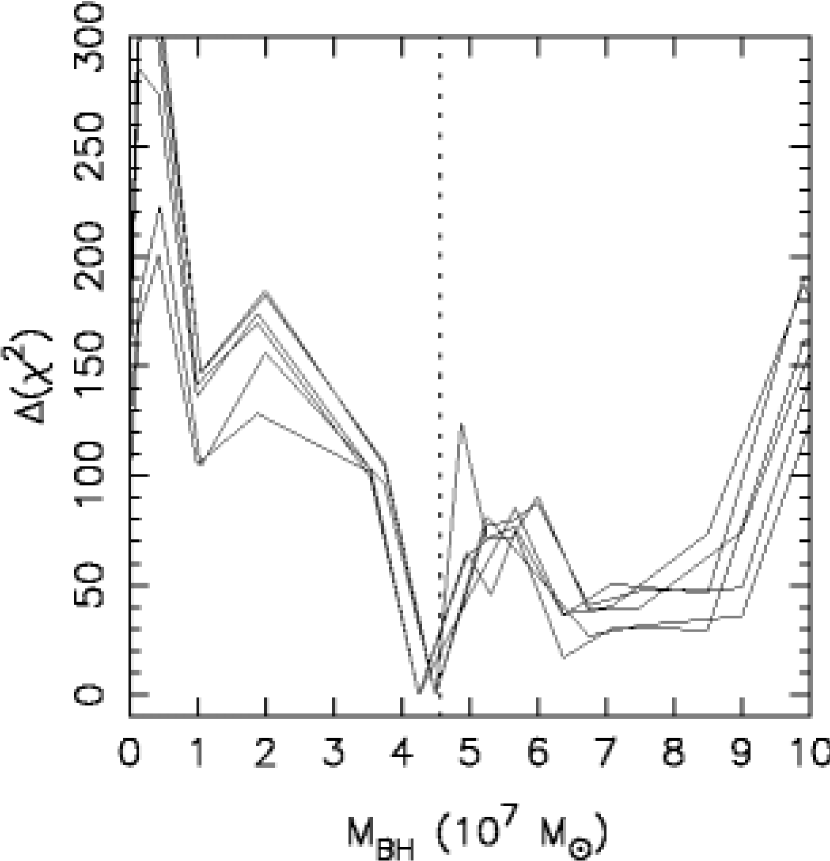
Figure 10 shows a similar 1-dimensional cut (at the best-fit = 3.5) through the corresponding 2-dimensional space for the models that assumed the bulge is viewed at the same inclination as the large-scale galaxy disk (as inferred from the shape of the disk, ). As an additional test of numerical effects, we ran several versions of the inclined model with orbit libraries of slightly different sizes (ranging between 7600 and 8100 orbits), for which we also show the 1-dimensional cuts in Figure 10. There is clearly a minimum in between and M⊙, but the precise location is uncertain. Furthermore, the non-smooth nature of the topology suggests that it is unwise to assign much meaning to the formal intervals since the location of the minimum varies quite strongly with orbit library. The most conservative statement that can be made is that the models give a best-fit BH mass between M⊙.
However, there are two reasons why we are reluctant to accept this as more than preliminary evidence of a “BH detection” based on stellar dynamical modeling. First, the best-fit value for the inclined model is a factor of 3 larger than the lowest value of for the edge-on model (with the upper limit). Formally, therefore, the solution with an edge-on bulge and an upper-limit of M⊙ is preferred. Second, there is considerably more noise in the topology of the 2-D surface for the inclined models than for the edge-on models, which is indicative of the fact that the inclined models are significantly more influenced by the noise in the data than are the edge-on models.
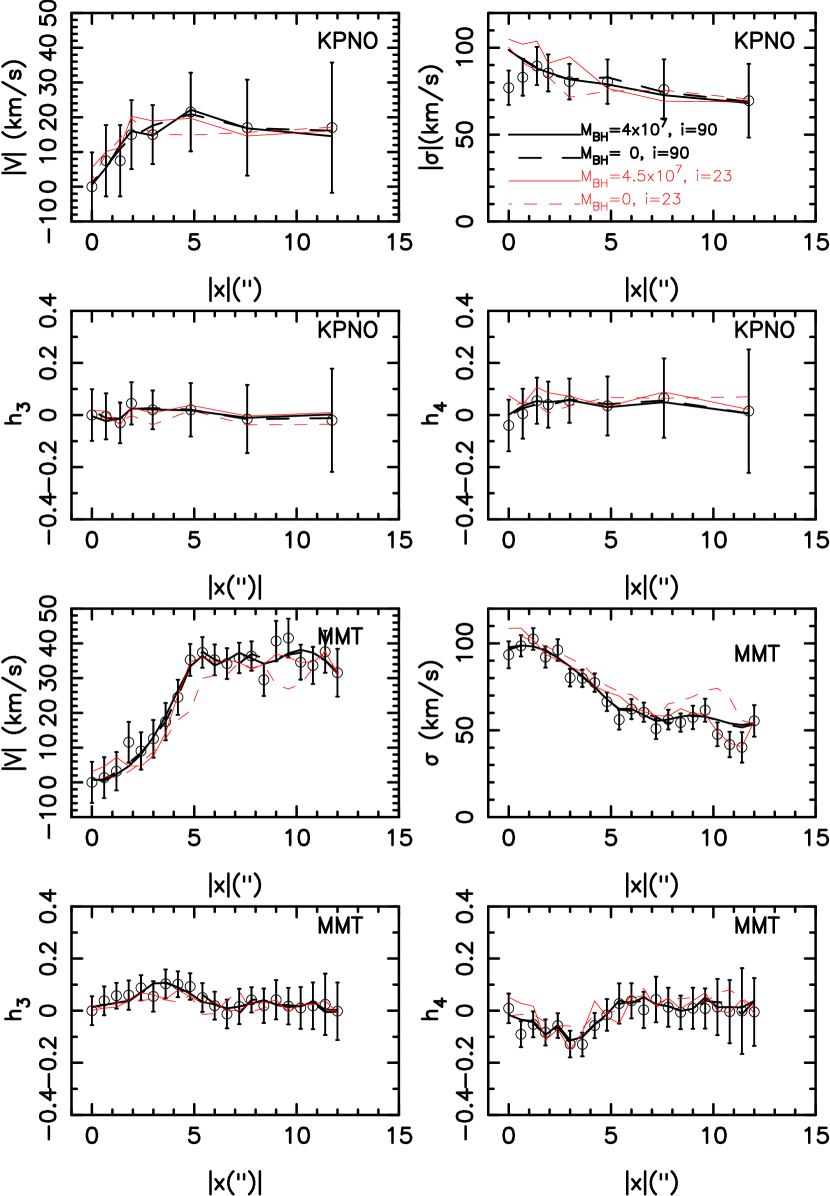
Figure 11 shows fits for 4 different models to the kinematical data from the two ground-based datasets (shown by open circles with error bars). The black lines are the fits obtained for an edge-on bulge (the solid black line is for the model at the upper limit, and the dashed black line is for an edge-on bulge with no black hole). The red lines are for the models with inclination angle . The solid red line is for the model that gives the best fit to the kinematical data, while the dashed red line is for the inclined bulge with no BH.
It is clear that in the case of the edge-on models (black lines), the upper limit and the “no BH” models provide essentially identical fits to the data. For an inclined bulge, the model with no BH systematically under-predicts the velocity (), which is why the larger BH mass is needed to fit the kinematical data.
If we make the plausible assumption that the large-scale inclination of the disk and its symmetry axis are likely to be shared by the bulge, one can reasonably conclude that the best-fit BH mass is M⊙, in extremely good agreement with the estimate obtained from reverberation mapping. Models in which the bulge grows via secular processes or by dissipative minor mergers of disk galaxies predict such alignment of symmetry axes (e.g., Robertson et al., 2006).
We propose this conclusion with some caution, however, because the ground-based kinematical data are of relatively low quality and do not resolve the sphere of influence of the BH. Previous studies (Verolme et al., 2002) have shown that it is essential to have large-scale two-dimensional kinematical data from integral field spectroscopy in order to obtain reliable constraints on the inclination angle of an ellipsoidal galaxy model from the kinematical data alone.
The existing data and the dynamical models presented above show that there is tentative, but good agreement between the mass of the BH inferred from stellar dynamical models and the mass obtained from reverberation mapping.
5 Discussion
We have presented one of the first direct stellar dynamical BH mass estimates for a broad-line AGN. We found that if the bulge of NGC 4151 was assumed to be viewed edge-on, the data only gave an upper limit on the dynamical BH mass of M⊙. Alternatively, when the bulge was assumed to have the same inclination to the line of sight as the rotation axis of the large-scale disk, we obtained a best-fit value for the mass of the central BH of M⊙. The only other stellar dynamical measurement of a broad-line AGN is from a recent study of NGC 3227 by Davies et al. (2006), who estimated a 1 range for the BH mass of M⊙. The value of derived from stellar kinematical data and 3-integral modeling is remarkably consistent with the value derived from reverberation mapping in both cases.
In addition, Hicks & Malkan (2007) have analyzed the dynamics of the molecular hydrogen gas in the central regions of both NGC 3227 and NGC 4151, and derive BH mass estimates for these galaxies that agree well with the reverberation mapping estimates. All of this supports the empirical calibration of reverberation-based masses from Onken et al. (2004), and indicates that the local AGNs used to establish that calibration likely already lie very close to the relation defined by quiescent galaxies. However, there is a fair amount of scatter in the AGN relation, and the mass predicted by the relation for NGC 4151 is M⊙ (using km s-1 and the fit to the relation by Ferrarese & Ford, 2005), roughly an order of magnitude lower than suggested by either the reverberation mapping studies or the stellar dynamical data presented here. While one could attribute the discrepancy of the reverberation-based mass in NGC 4151 to object-to-object variations in the reverberation scaling factor , a higher value of is supported by the stellar dynamical estimate, the gas dynamical estimate, and the relationship between BH mass, bolometric luminosity, and X-ray variability timescale (McHardy et al., 2006). We note that our stellar dynamical models for NGC 4151 are based on kinematical data that do not fully resolve the sphere of influence of the BH and that our modeling is simplistic in that it assumes an axisymmetric bulge and takes no account of the non-axisymmetry arising due to the presence of the galaxy’s bar. Thus we consider this measurement of the BH mass to be preliminary.
We believe that NGC 4151 is an excellent target for future stellar dynamical measurements with higher spatial resolution. One improvement over our present approach would be to expand from two slit positions to many, or to use an integral field unit (IFU). In the seeing-limited regime, observations with the optical IFU, SAURON, have recently been published by Dumas et al. (2007) and show a similar decrease in the stellar velocity dispersion of NGC 4151 at small radii. While the current shutdown of STIS precludes deeper studies of the CaT with HST, observations of the CO bandhead stellar absorption features at 2.29 m (as was used in the study of NGC 3227 by Davies et al., 2006) opens the possibility of ground-based observations with adaptive optics (AO) on large-aperture telescopes. It is worrying that observations of NGC 4151 taken during periods of both high AGN flux (Ivanov et al., 2000) and low AGN flux (Hicks & Malkan, 2007) fail to clearly reveal CO bandhead absorption from the central regions of the galaxy, but deeper observations may improve the situation. Incorporating these types of data into future modeling will be a significant step forward.
The use of high-spatial-resolution AO observations with infrared IFUs in conjunction with non-axisymmetric modeling will allow us to constrain the complex velocity fields arising from the bar; this is likely to place even stronger constraints on the mass of the central BH. Ultimately, the insensitivity of stellar orbits to the outflows and bulk motions that affect gas dynamics means that stellar dynamical BH masses will likely act as the linchpin in calibrating the BH masses produced by reverberation mapping.
References
- Barth et al. (2002) Barth, A. J., Ho, L. C., & Sargent, W. L. W. 2002, AJ, 124, 2607
- Bell & de Jong (2001) Bell, E. F., & de Jong, R. S. 2001, ApJ, 550, 212
- Bell et al. (2003) Bell, E. F., McIntosh, D. H., Katz, N., & Weinberg, M. D. 2003, ApJS, 149, 289
- Bentz et al. (2006a) Bentz, M. C., Peterson, B. M., Pogge, R. W., Vestergaard, M., & Onken, C. A. 2006a, ApJ, 644, 133
- Bentz et al. (2006b) Bentz, M. C., et al. 2006b, ApJ, 651, 775
- Bissantz et al. (1997) Bissantz, N., Englmaier, P., Binney, J., & Gerhard, O. 1997, MNRAS, 289, 651
- Blandford & McKee (1982) Blandford, R. D., & McKee, C. F. 1982, ApJ, 255, 419
- Bohlin & Gilliland (2004) Bohlin, R. C., & Gilliland, R. L. 2004, AJ, 128, 3053
- Cappellari (2002) Cappellari, M. 2002, MNRAS, 333, 400
- Cappellari (2004) Cappellari, M., & Emsellem, E. 2004, PASP, 116, 138
- Collin et al. (2006) Collin, S., Kawaguchi, T., Peterson, B. M., & Vestergaard, M. 2006, A&A, 456, 76
- Cretton et al. (1999) Cretton, N., de Zeeuw, P. T., van der Marel, R. P., & Rix, H. 1999, ApJS, 124, 383
- Davies et al. (2006) Davies, R. I., et al. 2006, ApJ, 646, 754
- Dumas et al. (2007) Dumas, G., Mundell, C. G., Emsellem, E., & Nagar, N. M. 2007, MNRAS, in press (arXiv:0705.4162)
- Erwin et al. (2004) Erwin, P., Graham, A. W., & Caon, N. 2004, in “Coevolution of Black Holes and Galaxies, Carnegie Observatories Astrophysics Series Vol. 1”, ed. L. C. Ho (Cambridge: Cambridge University Press), p. 264 (astro-ph/0212335)
- Eyermann et al. (2005) Eyermann, S. E., Rumstay, K. S., Boone, R. H., & Cortes, S. R. 2005, Publications I.A.P.P.P. (in press)
- Ferrarese & Ford (2005) Ferrarese, L., & Ford, H. 2005, SSRv, 116, 523
- Ferrarese & Merritt (2000) Ferrarese, L., & Merritt, D. 2000, ApJ, 539, L9
- Ferrarese et al. (2001) Ferrarese, L., Pogge, R. W., Peterson, B. M., Merritt, D., Wandel, A., & Joseph, C. L. 2001, ApJ, 555, L79
- Ferrarese (2002) Ferrarese, L. 2002, ApJ, 578, 90
- Gebhardt et al. (2000a) Gebhardt, K., et al. 2000a, ApJ, 539, L13
- Gebhardt et al. (2000b) Gebhardt, K., et al. 2000b, ApJ, 543, L5
- Gebhardt et al. (2003) Gebhardt, K., et al. 2003, ApJ, 583, 92
- Genzel et al. (1996) Genzel, R., Thatte, N., Krabbe, A., Kroker, H., & Tacconi-Garman, L. E. 1996, ApJ, 472, 153
- Gerhard (1993) Gerhard, O. E. 1993, MNRAS, 265, 213
- Graham & Driver (2007) Graham, A. W., & Driver, S. P. 2007, ApJ, 655, 77
- Graham et al. (2001) Graham, A. W., Erwin, P., Caon, N., & Trujillo, I. 2001, ApJ, 563, L11
- Häring & Rix (2004) Häring, N., & Rix, H.-W. 2004, ApJ, 604, L89
- Hicks & Malkan (2007) Hicks, E. K. S., & Malkan, M. A. 2007, ApJ, in press (arXiv:0707.0611)
- Hutchings et al. (1999) Hutchings, J. B., et al. 1999, AJ, 118, 2101
- Ivanov et al. (2000) Ivanov, V. D., Rieke, G. H., Groppi, C. E., Alonso-Herrero, A., Rieke, M. J., & Engelbracht, C. W. 2000, ApJ, 545, 190
- Kormendy & Richstone (1995) Kormendy, J., & Richstone, D. 1995, ARA&A, 581
- Lawson & Hanson (1995) Lawson, C. L. & Hanson, R. J. 1995, Solving Least Squares Problems, (SIAM: Philadelphia, PA)
- Marconi & Hunt (2003) Marconi, A., & Hunt, L. K. 2003, ApJ, 589, L21
- McHardy et al. (2006) McHardy, I. M., Koerding, E., Knigge, C., Uttley, P., & Fender, R. P. 2006, Nature, 444, 730
- McLure & Dunlop (2002) McLure, R. J. & Dunlop, J. S. 2002, MNRAS, 331, 795
- Melia & Falcke (2001) Melia, F., & Falcke, H. 2001, ARA&A, 39, 309
- Merritt & Ferrarese (2001) Merritt, D., & Ferrarese, L. 2001, MNRAS, 320, L30
- Metzroth et al. (2006) Metzroth, K. G., Onken, C. A., & Peterson, B. M. 2006, ApJ, 647, 901
- Mould et al. (2000) Mould, J. R., et al. 2000, ApJ, 529, 786
- Mundell & Shone (1999) Mundell, C. G., & Shone, D. L. 1999, MNRAS, 304, 475
- Mundell et al. (1999) Mundell, C. G., Pedlar, A., Shone, D. L., & Robinson, A. 1999, MNRAS, 304, 481
- Nelson et al. (2000) Nelson, C. H., Weistrop, D., Hutchings, J. B., Crenshaw, D. M., Gull, T. R., Kaiser, M. E., Kraemer, S. B., & Lindler, D. 2000, ApJ, 531, 257
- Nelson et al. (2004) Nelson, C. H., Green, R. F., Bower, G., Gebhardt, K., & Weistrop, D. 2004, ApJ, 615, 652
- Onken et al. (2003) Onken, C. A., Peterson, B. M., Dietrich, M., Robinson, A., & Salamanca, I. M. 2003, ApJ, 585, 121
- Onken et al. (2004) Onken, C. A., Ferrarese, L., Merritt, D., Peterson, B. M., Pogge, R. W., Vestergaard, M., & Wandel, A. 2004, ApJ, 615, 645
- Pavlovsky et al. (2004) Pavlovsky, C., et al. 2004, “ACS Instrument Handbook”, Version 5.0, (Baltimore: STScI)
- Pedlar et al. (1992) Pedlar, A., Howley, P., Axon, D. J., & Unger, S. W. 1992, MNRAS, 259, 369
- Peng et al. (2002) Peng, C. Y., Ho, L. C., Impey, C. D., & Rix, H.-W. 2002, AJ, 124, 266
- Peterson (1993) Peterson, B. M. 1993, PASP, 105, 247
- Peterson et al. (2004) Peterson, B. M., et al. 2004, ApJ, 613, 682
- Robertson et al. (2006) Robertson, B., Bullock, J. S., Cox, T. J., Di Matteo, T., Hernquist, L., Springel, V., & Yoshida, N. 2006, ApJ, 645, 986
- Schlegel et al. (1998) Schlegel, D. J., Finkbeiner, D. P., & Davis, M. 1998, ApJ, 500, 525
- Schwarzschild (1979) Schwarzschild, M. 1979, ApJ, 232, 236
- Seyfert (1943) Seyfert, C. K. 1943, ApJ, 97, 28
- Simkin (1975) Simkin, S. M. 1975, ApJ, 200, 567
- Ulrich (2000) Ulrich, M.-H. 2000, A&ARv, 10, 135
- Valluri et al. (2004) Valluri, M., Merritt, D., & Emsellem, E. 2004, ApJ, 602, 66
- Valluri et al. (2005) Valluri, M., Ferrarese, L., Merritt, D., & Joseph, C. L. 2005, ApJ, 628, 137
- van der Marel & Franx (1993) van der Marel, R. P., & Franx, M. 1993, ApJ, 407, 525
- Verolme et al. (2002) Verolme, E. K., et al. 2002, MNRAS, 335, 517
- Virani et al. (2000) Virani, S. N., De Robertis, M. M., & VanDalfsen, M. L. 2000, AJ, 120, 1739
- Wandel (2002) Wandel, A. 2002, ApJ, 565, 762
| Gaussian | Surface Density | Gaussian Sigma | Axial |
|---|---|---|---|
| Number | (L⊙,R pc-2) | (arcsec) | Ratio |
| 1 | 8.75E+04 | 0.14 | 1.00 |
| 2 | 2.43E+04 | 0.32 | 1.00 |
| 3 | 8.38E+03 | 1.19 | 1.00 |
| 4 | 3.19E+03 | 2.44 | 1.00 |
| 5 | 1.25E+03 | 6.46 | 1.00 |
| 6 | 2.75E+02 | 11.57 | 1.00 |
| 7 | 1.50E+02 | 45.21 | 0.67 |
| 8 | 5.06E+00 | 203.53 | 1.00 |
| 9 | 0.88E+00 | 203.53 | 0.27 |
| Position | |||||
|---|---|---|---|---|---|
| Dataset | Along SlitaaUncertainties indicate aperture size along the slit. | Velocity | |||
| (arcsec) | (km s-1) | (km s-1) | |||
| MMT | 12.00.3 | -1011 | 7613 | 0.010.11 | 0.000.12 |
| 11.40.3 | -148 | 4611 | 0.020.14 | 0.000.18 | |
| 10.80.3 | -188 | 3711 | -0.020.14 | -0.020.18 | |
| 10.20.3 | -118 | 4510 | 0.000.13 | 0.030.17 | |
| 9.60.3 | -268 | 6310 | 0.000.10 | 0.050.11 |
Note. — The kinematic data were symmetrized in the subsequent dynamical modeling. [The complete version of this table is in the electronic edition of the Journal. The printed edition contains only a sample.]