Magnetic properties of GdxY1-xFe2Zn20: dilute, large, S moments in a nearly ferromagnetic Fermi liquid
Abstract
Single crystals of the dilute, rare earth bearing, pseudo-ternary series, GdxY1-xFe2Zn20 were grown out of Zn-rich solution. Measurements of magnetization, resistivity and heat capacity on GdxY1-xFe2Zn20 samples reveal ferromagnetic order of Gd3+ local moments across virtually the whole series (). The magnetic properties of this series, including the ferromagnetic ordering, the reduced saturated moments at base temperature, the deviation of the susceptibilities from Curie-Weiss law and the anomalies in the resistivity, are understood within the frame work of dilute, S moments (Gd3+) embedded in a nearly ferromagnetic Fermi liquid (YFe2Zn20). The s-d model is employed to further explain the variation of with as well as the temperature dependences of of the susceptibilities.
pacs:
75.10.Lp, 75.50.Cc, 75.20.HrI Introduction
Materials that are just under the Stoner limit manifest large electronic specific heat and enhanced paramagnetism and are sometimes known as nearly ferromagnetic Fermi liquids (NFFL)Moriya (1985); Brommer and Franse (1990). Archetypical examples, such as PdJamieson and Manchester (1972), Ni3Gade Boer et al. (1967), TiBe2Matthias et al. (1978) and YCo2Lemaire (1966), have been studied for several decades. In addition to the interesting, intrinsic properties of these compounds, the introduction of local moments into these highly polarizable hosts has lead to both experimentalNieuwenhuys (1975) and theoretic interestLarkin and Mel’nikov (1972); Maebashi et al. (2002). In such highly polarizable hosts, local moment impurities can manifest long range, ferromagnetic order even for very low concentrations (0.5 at.% Fe in PdMydosh et al. (1968) and 1 at.% Gd in PdCrangle (1964)).
Recently, YFe2Zn20 was found to be a ternary example of a NFFL with a Stoner parameter ,Jia et al. (2007) as compared to for Pd, indicating strongly correlated electron behavior. When the large, S moment bearing, Gd3+ replaces the non-magnetic Y3+ ions, it was found that GdFe2Zn20 has a remarkably high ferromagnetic Curie temperature() of 86 K. Both of these compounds belong to the much larger, isostructural RT2Zn20 (R = rare earth, T = transition metal such as Fe, Co, Ni, Ru, Rh, Os, Ir, Pt)Nasch et al. (1997); Torikachvili et al. (2007) family, in which the R and T ions each occupy their own unique, single, crystallographic sites. In these dilute, rare earth bearing, intermetallic compounds (less than 5 at.% rare earth), the R ions are fully surrounded by Zn nearest and next nearest neighbors to form a Frank-Kasper-like Zn polyhedron; the T site is also surrounded by a nearest and next nearest neighbor, Zn shell. The shortest R-R spacing is 6 Å. Motivated by these intriguing magnetic and structural properties, we focus, in this work, on the pseudo-ternary series GdxY1-xFe2Zn20, which can be used as a model for studying the effects of titrating very dilute local moments into a nearly ferromagnetic Fermi liquid. Given that RFe2Zn20 is a dilute, rare earth bearing intermetallic, dilution of Gd onto the Y site (i) changes the lattice parameter by less than 0.2 %, (ii) does not change the band filling, (iii) does not change the all Zn local environment of either the Gd or Fe ions, and (iv) allows for the dilution of Gd in the system to be studied down to , i.e. down to approximately 200 Gd. As shown below, single crystals of GdxY1-xFe2Zn20 can be easily grown by a Zn, self flux methodJia et al. (2007); Canfield and Fisk (1992), and the Gd concentration can be consistently inferred via a variety of methods.
In this paper, we report on the characterization of single crystals of GdxY1-xFe2Zn20 by X-ray diffraction, Energy Dispersive X-ray Spectroscopy (EDS), magnetization, resistivity and heat capacity measurements. These data reveal ferromagnetic order of the Gd3+ local moment above 1.80 K for Gd concentration above . These results will be discussed within the framework of the so-called s-d modelShimizu (1981), based on the mean field approximation, and used to explain the variation of across the series with respect to x.
II Experimental Methods
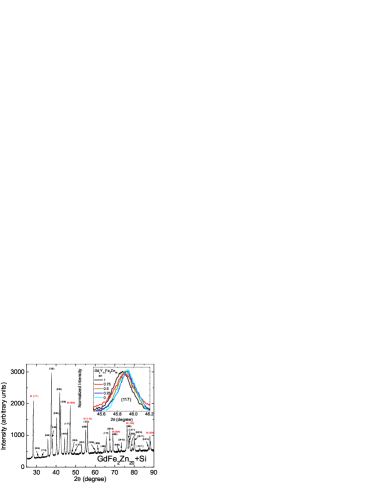
Single crystals of GdxY1-xFe2Zn20 were grown from a Zn-rich self fluxJia et al. (2007); Canfield and Fisk (1992). For , high purity elements were combined in a molar ratio of (GdxY1-x)2Fe4Zn94. For less than 0.02, a Y0.9Gd0.1 master alloy was made via arc melting and appropriate amounts of this alloy were added to elemental Y to reduce the uncertainties associated with weighing errors. The constituent elements (or alloy) were placed in a 2 ml, alumina crucible and sealed in a silica tube under approximately 1/3 atmosphere of high purity Ar (used to help reduce the evaporation and migration of zinc during the growth process) and then heated up to 1000 ∘C and cooled, over a period of 80 h, to 600 ∘C, at which point the remaining liquid was decanted. Growths such as these often had only a few nucleation sites per crucible and yielded crystals with typical dimensions of at least . Residual flux and/or oxide slag on the crystal surfaces was removed by using 0.5 vol.% HCl in H2O in an ultrasonic bath for 1–2 h. The samples were characterized by room temperature powder X-ray diffraction measurements using Cu Kα radiation with Si () as an internal standard in a Rigaku Miniflex powder diffractometer(Fig. 1). The Rietica, Rietveld refinement program was employed to obtain the lattice constants, which vary linearly for . This shift can be seen in the peak position for selected values (see Fig. 1, inset). EDS measurements were made in a JEOL model 5910lv-SEM with a Vantage EDS systerm for representative samples.
In order to measure the electrical resistivity with a standard AC, four-probe technique, the samples were cut into bars using a wire saw. The bars typically had lengths of 2–4 mm parallel to the crystallographic [110] direction, and widths and thicknesses between 0.2–0.4 mm. Electrical contact was made to these bars by using Epo-tek H20E silver epoxy, with typical contact resistances of about 1 Ohm. AC electrical resistivity measurements were performed with Hz and mA in a Quantum Design PPMS-14 or PPMS-9 instrument ( K). Temperature dependent specific heat measurements were also performed by using the heat capacity option of these Quantum Design instruments, sometimes using the 3He option.
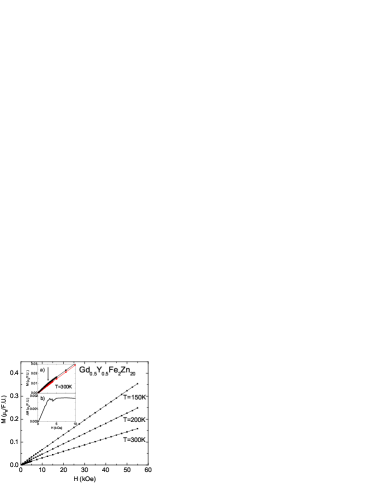
DC magnetization was measured in a Quantum Design superconducting quantum interference device (SQUID) magnetometer, in a variety of applied fields ( kOe) and temperatures (1.85 K 375 K). In some crystals, the magnetization with respect to magnetic field measurements at 300 K showed a slight non-linearity with a small slope change around 3 kOe (Fig. 2). This specific behavior is believed to be due to a small amount of ferromagnetic impurity, possibly Fe or FeOx ( /mol to /mol) on the crystal. This feature is most likely extrinsic because the extent of the slope change is sample-dependent; some samples showing no feature at all (inset of Fig. 2). This feature is most clearly seen when two samples from the same batch (one with feature, one without) are compared (Fig. 2, inset a) or even subtracted from each other (Fig. 2, inset b). Given that this small, extrinsic ferromagnetic contribution saturates by kOe (Fig. 2, inset b), the high temperature susceptibility can be determined by . In this temperature region the intrinsic magnetization is a linear function of applied magnetic field for (Fig. 2). At lower temperatures, closer to , the sample’s intrinsic magnetization become large enough that we can measure directly as for kOe.
III Experiments Results
The size of the cubic unit cell, as determined by powder X-ray diffraction measurements, shows a linear dependence on as it is varied from 0 to 1 (Fig. 3). The error bars of the lattice constants were estimated from the standard deviation determined by measurements on three samples from the same batch. These data are compliant with Vegard’s law and imply that the nominal is probably close to the actual .
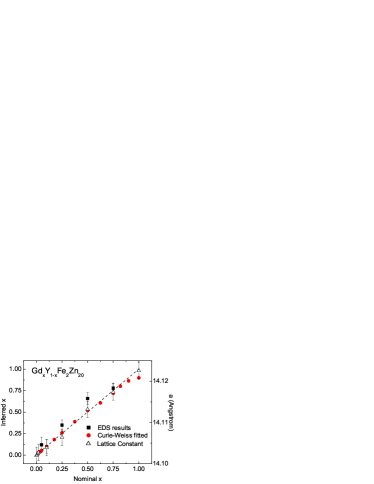
In order to check this further, EDS was used. This is a direct method to determine , although it loses some of its accuracy because of the low, total rare earth concentration ( at.%). Nevertheless, several representative members of the GdxY1-xFe2Zn20 series were measured and the inferred values are close to the nominal values within the fairly large error bars (Fig. 3).
Another way to estimate the concentration of gadolinium in the grown crystals is based on the analysis of the high temperature magnetic susceptibility data, which can be expressed as:
| (1) |
Experimentally, obeys the Curie-Weiss law above 150 K (Fig. 4a), from which the paramagnetic Curie temperature and Curie constants can be extracted. The value of can be inferred by fixing the effective moment of Gd3+ as 7.94 . These values of inferred are also plotted in Fig. 3. The agreement between each of these three different methods of determining inferred and the nominal value is good and for the rest of this paper nominal values will be used to estimate actual Gd content.
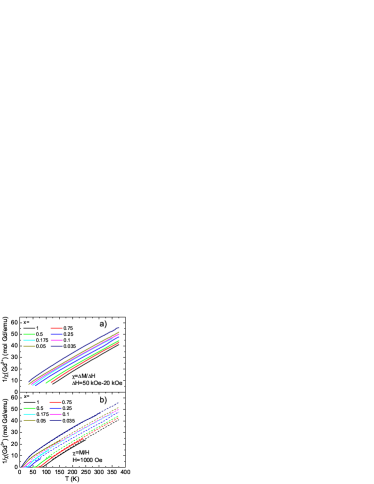
Another aspect of Fig. 4 that is noteworthy is that all data sets deviate from their high temperature Curie-Weiss behaviors as the system approaches the magnetic ordering temperature. Since high fields can shift and broaden the features associated with ferromagnetism, at lower temperatures a field of 1 kOe was used (Fig. 4b). Whereas this deviation cannot be associated with the formation of superparamagnetic clusters above (this would cause a slope change toward the horizontal rather than toward the vertical), it can be understood in terms of an increasing coupling between the Gd3+ local moments associated with the strongly temperature dependent, polarizable electronic background of the YFe2Zn20 matrixJia et al. (2007)(see discussion below).
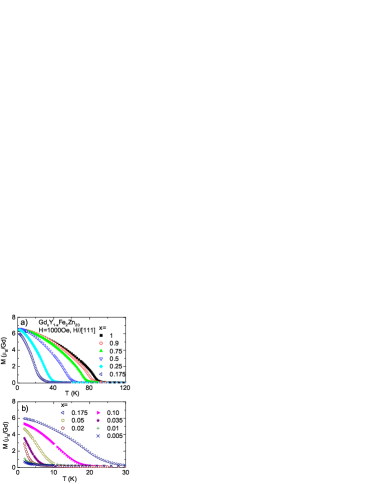
Figure 5 shows the temperature dependent magnetization in an external field Oe for the whole range of values. Ferromagnetic ordering can be clearly seen below 90 K for . This ordering temperature decreases monotonically as decreases, although the exact values of can not be unambiguously inferred from these plots. For , it becomes difficult to determine whether the compounds manifest ferromagnetism above the base temperature (1.85 K) based on the curves alone. Even at 1000 Oe, for , the low-temperature magnetization is just slightly below the Hund s ground state value 7 /Gd at the base temperature (Fig. 5a). For the low temperature, Oe, magnetization decreases with decreasing (Fig. 5b).
Field-dependent magnetization measurements were made for each sample at base temperature (Fig. 6). For compounds with , the magnetization rapidly saturates as the magnetic field increases, consistent with a ferromagnetic ground state at 1.85 K. For , the curves vary more smoothly with H and are more consistent with a paramagnetic state at 1.85 K. The data are more ambiguous and require a still more detailed analysis.
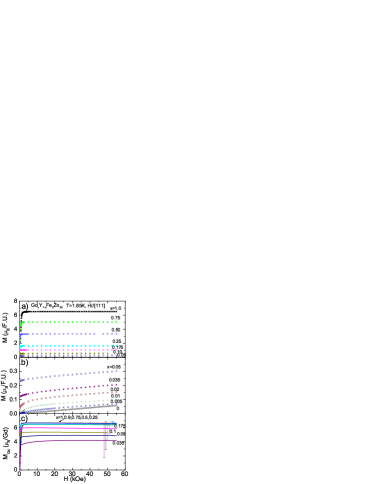
For kOe the data for vary approximately linearly with and have slopes comparable to that of YFe2Zn20.(Fig. 6b) For all values the magnetization can be thought of as a combination of the magnetization of Gd3+ ions and the highly polarizable background. In order to extract the magnetization of the Gd3+ ions, a background of was subtracted from the data. The data are plotted in Fig. 6c normalized to the nominal x values. For the saturated magnetization is essentially constant with a value slightly less than 7 /Gd.Jia et al. (2007) For there is an apparent decrease in the saturated magnetization with decreasing , but it should noted that the error bars, coming from the estimated uncertainty of , increase with decreasing . These increasing error bars make it unclear whether the saturated moment of the Gd impurities is constant or decreasing in the small limit.
A fuller analysis of data, particularly the analysis of magnetization isotherms known as Arrott plotsArrott (1957), at a set of temperatures near has been found to be a useful, and in some case even the best method to determine for the samples. The method is based on the mean field theory, in which is linear in with zero intercept at the critical temperature , where is the internal field, equal to the difference between the external, applied field and the demagnetizing field . For an ellipsoid of GdxY1-xFe2Zn20, the demagnetizing field equalsChikazumi and Graham (1997):
| (2) |
where is the magnetization (emu/mol); is a geometric factor that can range from 1 to 0, and is Avogadro number. Thus , in units of /kOe , is:
| (3) |
Using , instead of , in Arrott plots will shift the data along axis in the positive direction by , which would experimentally introduce an error in the value of for a flat shaped sample () of GdFe2Zn20. Nevertheless, even in this extreme case, this error drops as decreases due to reduction of the samples’ magnetization as Gd3+ is diluted out (notice the different scale of the axis for in Fig. 7). Due to these concerns, rod-like-shape samples were measured along their long axis for the magnetization isotherms for samples with . This shape ensures is minimized. Figures 7a and b show K for and K for respectively. For , Fig. 7c shows K, a result that helps explain the difficulty experienced in determining the base-temperature magnetic state based on the and data discussed above. The values determined for the Arrot plot analysis for all are shown below in Fig. 13.

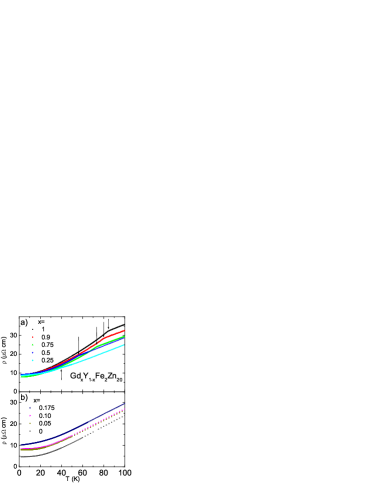
The temperature dependent electric resistivity data, (measured in zero applied magnetic field), of the GdxY1-xFe2Zn20 compounds are shown, for representative values, in Fig. 8. For , curves show a kink at due to the loss of spin disorder scattering below this temperature. In contrast, for , no clear kink can be detected. values deduced from the maximum of (not shown here) are compatible with the values obtained from the Arrott plots (see Fig. 13b below).
Further information can be extracted from the the GdxY1-xFe2Zn20 data by assuming that the total resistivity of the compound can be written as:
| (4) |
where is a temperature independent, impurity scattering term, is the scattering from phonons and is scattering associated with the interaction between conduction electrons and magnetic degrees of freedom. In this series of pseudo-ternary compounds, the high temperature () phonon contribution, , should be essentially invariant (due to the very dilute nature of the R ions). The magnetic contribution to the resistivity, , will be the combination of contributions from conduction electron scattered by (i) the 4f local moments and (ii) the spin fluctuations of 3d electrons (from Fe sites), both of which should saturate in the high temperature limit. Based on the analysis above, the high temperature resistivity of the whole series should be similar (modulo an offset) and manifest similar slopes due to the electron-phonon scattering. This is indeed the case: the data show linearity of above 250 K with the slopes differing by less than 8%; less than the estimated dimension error (10%) of these bar-like-shape samples.
The magnetic and disorder contribution to the resistivity can be estimated by (i) removing the geometric error by normalizing the high temperature slope of all plots to that of YFe2Zn20 and then (ii) subtracting the data from the normalized data.
The normalized is given as:
| (5) |
and
| (6) |
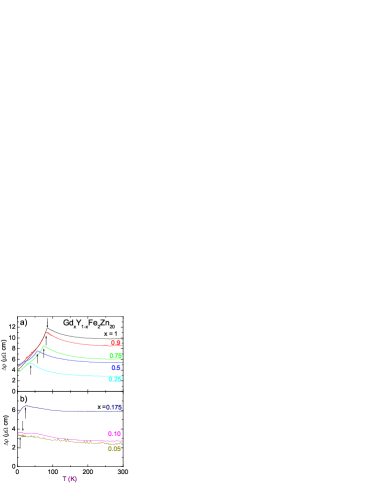
The resulting will not only show the conduction electron scattering from the 4f local moments, but will also include scattering associated with the interaction between the 4f local moment and 3d electrons, especially near . The temperature dependent curves for the GdxY1-xFe2Zn20 compounds are presented in Fig. 9. A pronounced upward cusp is centered about for . For the loss of spin disorder feature becomes harder (or even impossible) to resolve, but the enhanced scattering above persists. The decrease of with T below is a common in ferromagnetic systems and can be explained as the result of a loss of spin disorder scattering of conduction electrons. On the other hand, the behavior of above must come from a different conduction electron scattering process. A similar feature in is found in RFe2Zn20 (R = Tb-Er) for jia , but not in isostructural GdCo2Zn20 which orders antiferromagnetically at a much lower temperatureJia et al. (2007).
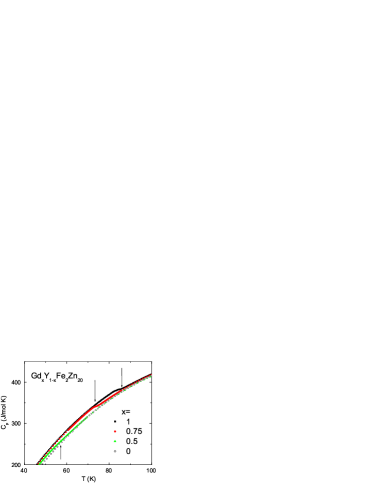
The specific heat of the GdxY1-xFe2Zn20 compounds (Fig. 10) can be thought of as the sum of the contributions from electronic, vibrational and magnetic degrees of freedom. To remove the vibrational and electronic parts (at least approximately), the specific heat of YFe2Zn20 and LuFe2Zn20 were used to estimate the background. The assumption that YFe2Zn20 and LuFe2Zn20 closely approx the non-magnetic of the GdxY1-xFe2Zn20 series is supported by the fact that the difference between the measured of YFe2Zn20, LuFe2Zn20 and GdxY1-xFe2Zn20 in the temperature region 20 K higher than is on the order of a percent. Since LuFe2Zn20 has a molar mass closer to that of GdFe2Zn20 than YFe2Zn20, the combination of is thought to be even closer to the non-magnetic background of .
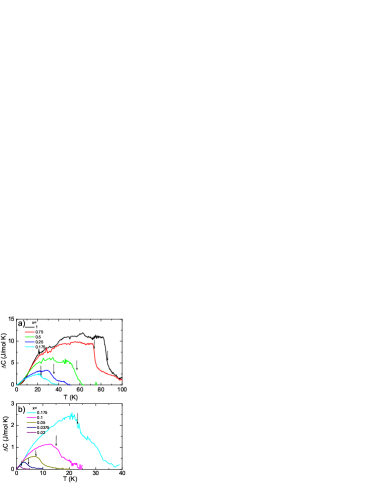
Figure 11 shows
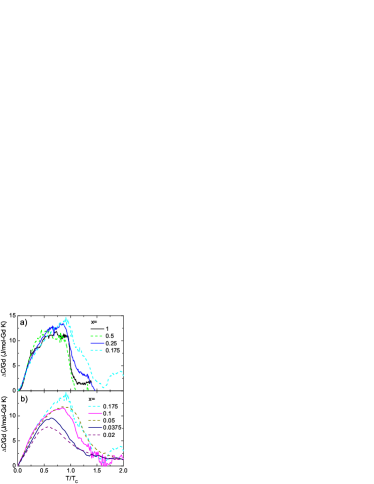
for (a) and (b), where the arrows indicate the values determined from the Arrott plot analyses. The magnetic ordering manifests itself as a broad feature in with occurring at, or near, the maximum slope. Figure 12 shows that this feature persists, relatively unchanged in shape, down to . For values of the feature broadens further, but is still distinct. This shape of is not unusual for Gd-base intermetallics with ferromagnetic order; for example, a similar feature is seen in GdPtIn ( K )Morosan et al. (2005). It should be noted that this feature is distinct from that associated with a spin-glass freezing: the maxima all occur at or below , whereas a spin glass manifests a broad peak above the freezing temperatureBinder and Young (1986).
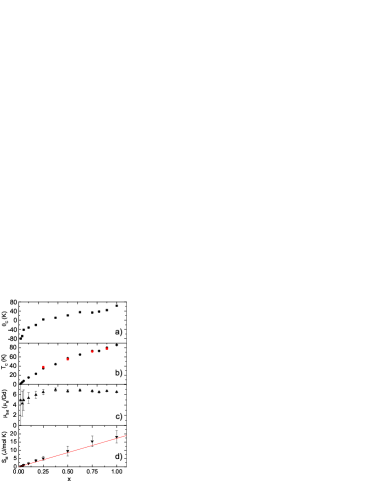
The dependence of the paramagnetic Curie temperature (), ferromagnetic ordering temperature () and saturated moments per Gd () for each are shown in Fig. 13a, b and c respectively. The values of the magnetic entropy, estimated by , are shown in Fig. 13d. Both and decrease monotonically with . At first glance, the negative values of for are unexpected and seem to be in contradiction with the existence of ferromagnetic ground state. However, the data analyses in Eq. 1 ignores, the increasingly strong, polarizable background associated with the near Stoner limit conduction electrons at intermediate temperatures. Furthermore, as shown in Fig. 4b, this low temperature effect becomes even more pronounced for small . Although, as discussed earlier, the uncertainty of makes the -variation of ambiguous for small , even the large members of the GdxY1-xFe2Zn20 series manifest reduced saturated moments. This is attributed to the induced moment on the 3d electrons, which is anti-parallel to the Gd moment.Jia et al. (2007) The magnetic entropy shown in Fig. 13d associated with the ordered state is equal to, or slightly larger than, the magnetic entropy associated with the Hund s ground state of Gd3+(). This fact indicates that the main part of the magnetic specific heat of the series of GdxY1-xFe2Zn20 is the contribution from the magnetic degrees of freedom of the Gd3+ local moments. The contribution to the magnetic specific heat from the itinerant electrons probably exists, but is, at most, comparable with the measurement uncertainty.
IV Analysis and Discussion
For rare earth bearing intermetallics, the interaction between 4f local moments is primarily mediated by means of polarization of the conduction electrons. Regardless of the details of the mechanism involved in this interactionde Gennes (1962); Campbell (1972), we emphasis that the 3d electrons from Fe sites act as important mediators of the Gd-Gd interaction in GdxY1-xFe2Zn20 system. In YFe2Zn20, the interaction between 3d electrons is not sufficient to split the conduction band but is large enough to make the compound exhibit strongly enhanced paramagnetism. When Y3+ ions are fully replaced by Gd3+ ions, these 3d electrons are polarized by the Gd3+ local moments. The interaction between 3d electrons assists in stabilizing the splitting of the conduction electron band and enhances the magnetic interaction between Gd3+ local moments, resulting in the remarkably high, ferromagnetic transition temperature for GdFe2Zn20. This physical picture is consistent with the results of the band structure calculation which predicts the Fe induced moment as in the ground state of GdFe2Zn20Jia et al. (2007); jia .
In order to perform further analysis on the magnetic properties of GdxY1-xFe2Zn20, a comparision with the binary RCo2 (R = rare earth) intermetallics is useful. YCo2 and LuCo2 show nearly ferromagnetic behavior while the series of compounds, (Gd-Tm)Co2, with 4f local moments manifest a ferromagnetic ground stateDuc and Brommer (1999); Duc and Goto (1999). In addition to these magnetic similarities, the resemblance between the crystal structure of RT2Zn20 and the so-called C-15 Laves structure of RCo2Gschneidner and Pecharsky (2006)is noticeable: both rare earth and transition metal ions occupy same unique, single crystallographic sites in same space group: . The unit cell of the RT2Zn20 compounds can be thought of as an expansion of the C-15 Laves phase unit cell via the addition of a large number of Zn ions.
Well-studied for several decades, the series of (Gd-Tm)Co2 has been treated as an example of 4f local moments embedded in a nearly ferromagnetic host: YCo2 or LuCo2. The so-called s-d model has been employed by Bloch and LemaireBloch and Lemaire (1970) and Bloch et. al.Bloch et al. (1975) to explain their magnetic properties. This model was first introduced by Takahashi and ShimizuTakahashi and Shimizu (1965) to understand the magnetic properties of alloys of the nearly ferromagnetic transition metal, Pd, with dilute Fe or Co local moment impurities. In this model, the polarization effect of the local moments on the itinerant electrons is considered in terms of a molecular field. Motivated by the similarity of the magnetic properties and the crystal structure of RFe2Zn20 and RCo2, we applied the s-d model to the GdxY1-xFe2Zn20 series.
This model considers one magnetic system consisting of two types of spins: one local moment, and the other giving rise to an exchange-enhanced paramagnetic susceptibility.Bloch and Lemaire (1970) Assuming the interaction between Gd local moments is only via the conduction electrons, we apply this model to GdxY1-xFe2Zn20. Under an applied field , for , the magnetization of the Gd local moments and the conduction electrons are:
| (8) |
| (9) |
where is the Curie constant of the Gd3+ local moments; , are molecular-field coefficient representing the interaction between itinerant electrons and Gd3+ local moments, and itinerant electrons with themselves, respectively; is the paramagnetic susceptibility without exchange enhancement. The total magnetization of GdxY1-xFe2Zn20 is the sum of and . It should be noted that when , the total susceptibility reduces to the exchange-enhanced susceptibility:
| (10) |
which is simply the Stoner enhanced susceptibility of YFe2Zn20.
Assuming that the electronic structure of the conduction band and the position of the Fermi level in the paramagnetic state are the same across the whole GdxY1-xFe2Zn20 series, from Eqs. 8–10, one gets the total susceptibility of GdxY1-xFe2Zn20
If one assumes the coupling between the pure spin moment () of the Gd3+ and the conduction electron spin () to be a Heisenberg exchange interaction, , where is the exchange parameter, then the molecular field coefficient
| (12) |
where is the number of the rare earth ions per volume.
The GdxY1-xFe2Zn20 system will become ferromagnetic when diverges. Thus,
where is the Boltzmann constant.
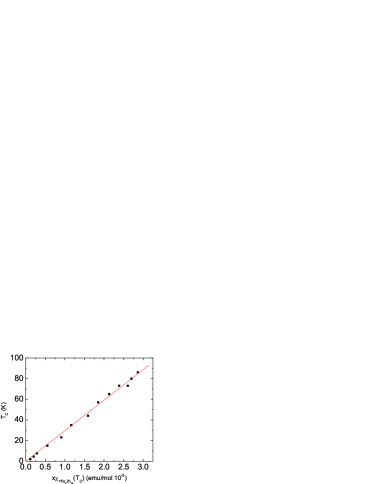
Equation IV reveals that depends on the product of and , rather than just . This is consistent with Fig. 13b showing a nonlinear dependence of on . Figure 14 shows that the values of depend linearly on the product across the whole series. From Fig. 14 the slope equals K mol/emu and thus can be extracted as meV.
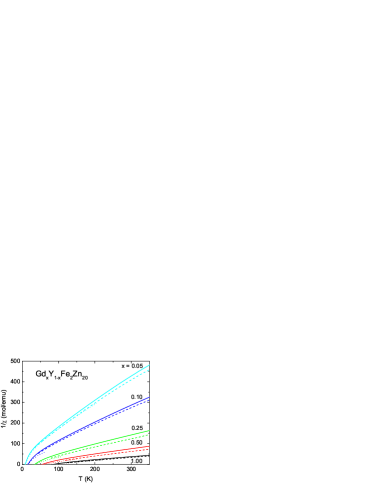
In addition to the magnetic ordering, this model can also explain the curious temperature dependence of the versus data for the GdxY1-xFe2Zn20 series. Setting meV, one obtains the temperature dependent, total susceptibility of GdxY1-xFe2Zn20. The results of for representative values are shown as the solid lines in Fig. 15; whereas the dotted lines and the dash lines present the experimental results under 1 kOe and high magnetic field, representatively. These calculated results qualitatively reproduce the experimental, temperature dependent susceptibilities, especially their deviation from the Curie-Weiss law close to . It should be noted that the data in Fig. 15 is the full without any subtraction of ”non-magnetic” background. In this sense Fig. 15, and the s-d model, appear to treat the magnetization data more fully than the simple assumption behind Eqn. 1.
In addition to the thermodynamic properties discussed above, the feature in above (Fig. 9) is also worth discussing further. The upward-pointing cusp at of is associated with the sign change of , from negative to positive as the temperature decreases. This feature is absent from simple models of Craig et al. (1967); Fisher and Langer (1968), based on the models assuming a single lattice of magnetic ions and a single band of conduction electrons. This theoretical model is over-simplified for GdxY1-xFe2Zn20, a strongly correlated electron system. Similar unusual upward cusps in at were found in the electric transport measurements of RCo2Gratz et al. (1995). They were explained by invoking an increasing, non-uniform fluctuating f-d exchange interaction, which provides an increase of spin fluctuation of 3d-electron subsystem as the temperature approaches in paramagnetic state, which in turn leads to increased conduction electron scattering. The GdxY1-xFe2Zn20 system (and indeed the other RFe2Zn20 compoundsjia ) present another, clear example of this behavior.
V Summary
We presented a set of data including magnetization, electrical transport and specific heat, measured on flux-grown single crystals of GdxY1-xFe2Zn20. We found that the series order ferromagnetically above 1.85 K for . The variation of with respect to x, as well as the curious temperature dependent magnetic susceptibilities, are well explained by a modifucation of the s-d model based on molecular field approximation. The enhanced electronic scattering found for is qualitatively consistent with this model and similar to that found for the related RCo2 compounds.
Acknowledgements.
The authors thank J. Frederich and M. Lampe for growing some of the compounds, F. Laabs for EDS measurements, E. D. Mun, A. Safa-Sefat and J. Schmalian for helpful discussions. Ames Laboratory is operated for the U.S. Department of Energy by Iowa State University under Contract No. DE-AC02-07CH11358. This work was supported by the Director for Energy Research, Office of Basic Energy Sciences.References
- Moriya (1985) T. Moriya, Spin fluctuations in itinerant electron magnetism (Springer-Verlag, Berlin, 1985).
- Brommer and Franse (1990) P. E. Brommer and J. J. M. Franse, in Ferromagnetic Materials vol 5, edited by K.H.J. Buschow and E.P. Wohlfarth (Amsterdam: North-Holland, 1990), pp. 323–396.
- Jamieson and Manchester (1972) H. C. Jamieson and F. D. Manchester, J. Phys. F: Met. Phys. 2, 323 (1972).
- de Boer et al. (1967) F. R. de Boer, C. J. Schinkel, and J. Biesterbos, Physics Letters A 25, 606 (1967).
- Matthias et al. (1978) B. T. Matthias, A. L. Giorgi, V. O. Struebing, and J. L. Smith, Physics Letters A 69, 221 (1978).
- Lemaire (1966) R. Lemaire, Cobalt 33, 201 (1966).
- Nieuwenhuys (1975) G. J. Nieuwenhuys, Advances in Physics 24, 515 (1975).
- Larkin and Mel’nikov (1972) A. I. Larkin and V. I. Mel’nikov, Soviet Physics JETP 34, 656 (1972).
- Maebashi et al. (2002) H. Maebashi, K. Miyake, and C. M. Varma, Physical Review Letters 88, 226403 (2002).
- Mydosh et al. (1968) J. A. Mydosh, J. I. Budnick, M. P. Kawatra, and S. Skalski, Physical Review Letters 21, 1346 (1968).
- Crangle (1964) J. Crangle, Physical Review Letters 13, 569 (1964).
- Jia et al. (2007) S. Jia, S. L. Bud’ko, G. D. Samolyuk, and P. C. Canfield, Nat Phys 3, 334 (2007).
- Nasch et al. (1997) T. Nasch, W. Jeitschko, and U. C. Rodewald, Zeitschrift fuer Naturforschung, B: Chemical Sciences 52, 1023 (1997).
- Torikachvili et al. (2007) M. S. Torikachvili, S. Jia, E. D. Mun, S. T. Hannahs, R. C. Black, W. K. Neils, D. Martien, S. L. Bud’ko, and P. C. Canfield, PNAS 104, 9960 (2007).
- Canfield and Fisk (1992) P. C. Canfield and Z. Fisk, Philosophical Magazine Part B 65, 1117 (1992).
- Shimizu (1981) M. Shimizu, Reports on Progress in Physics 44, 329 (1981).
- Arrott (1957) A. Arrott, Physical Review 108, 1394 (1957).
- Chikazumi and Graham (1997) S. Chikazumi and C. Graham, Physics of Ferromagnetism (Oxford University Press, 1997).
- (19) S. Jia et al. unpublished.
- Morosan et al. (2005) E. Morosan, S. L. Bud’ko, and P. C. Canfield, Physical Review B 72, 014425 (2005).
- Binder and Young (1986) K. Binder and A. P. Young, Reviews of Modern Physics 58, 801 (1986).
- de Gennes (1962) P. G. de Gennes, J. Phys. Radium 23, 510 (1962).
- Campbell (1972) I. A. Campbell, Journal of Physics F: Metal Physics 2, L47 (1972).
- Duc and Brommer (1999) N. H. Duc and P. E. Brommer, in Handbook of Magnetic Materials, Vol. 12, Edited by K.H.J. Buschow (Amsterdam: Elsevier, 1999), pp. 259–394.
- Duc and Goto (1999) N. H. Duc and T. Goto, in Handbook on the Physics and Chemistry of Rare Earths Vol. 26, edited by K.A. Gschneidner, Jr. and L. Eyring (Amsterdam: Elsevier, 1999), pp. 177–264.
- Gschneidner and Pecharsky (2006) K. A. Gschneidner, Jr. and V. K. Pecharsky, Zeitschrift für Kristallographie 221, 375 (2006).
- Bloch and Lemaire (1970) D. Bloch and R. Lemaire, Physical Review B 2, 2648 (1970).
- Bloch et al. (1975) D. Bloch, D. M. Edwards, M. Shimizu, and J. Voiron, Journal of Physics F: Metal Physics 5, 1217 (1975).
- Takahashi and Shimizu (1965) T. Takahashi and M. Shimizu, Journal of the Physical Society of Japan 20, 26 (1965).
- Craig et al. (1967) P. P. Craig, W. I. Goldburg, T. A. Kitchens, and J. I. Budnick, Physical Review Letters 19, 1334 (1967).
- Fisher and Langer (1968) M. E. Fisher and J. S. Langer, Physical Review Letters 20, 665 (1968).
- Gratz et al. (1995) E. Gratz, R. Resel, A. T. Burkov, E. Bauer, A. S. Markosyan, and A. Galatanu, Journal of Physics: Condensed Matter 7, 6687 (1995).