Accurate early positions for Swift GRBs: enhancing X-ray positions with UVOT astrometry.
The Swift Gamma Ray Burst satellite routinely provides prompt positions for GRBs and their afterglows on timescales of a few hundred seconds. However, with a pointing accuracy of only a few arcminutes, and a systematic uncertainty on the star-tracker solutions to the World Coordinate System of 3–4 arcseconds, the precision of the early XRT positions is limited to 3–4 arcseconds at best. This is significant because operationally, the XRT detects 95% of all GRBs, while the UVOT detects only the optically brightest bursts, 30% of all bursts detected by BAT; thus early and accurate XRT positions are important because for the majority of bursts they provide the best available information for the initial ground-based follow-up campaigns.
Here we describe an autonomous way of producing more accurate prompt XRT positions for GRBs and their afterglows, based on UVOT astrometry and a detailed mapping between the XRT and UVOT detectors. The latter significantly reduces the dominant systematic error – the star-tracker solution to the World Coordinate System. This technique, which is limited to times when there is significant overlap between UVOT and XRT PC-mode data, provides a factor of 2 improvement in the localisation of XRT refined positions on timescales of less than a few hours. Furthermore, the accuracy achieved is superior to astrometrically corrected XRT PC mode images at early times (for up to 24 hours), for the majority of bursts, and is comparable to the accuracy achieved by astrometrically corrected X-ray positions based on deep XRT PC-mode imaging at later times.
Key Words.:
gamma-ray: bursts – Gamma-rays, X-rays: afterglows1 Introduction
Since its launch in November 2004, the Swift Gamma-Ray Burst Explorer (Gehrels et al. 2004) has been routinely observing the prompt gamma-ray and early afterglow emission of Gamma-Ray Bursts (GRBs) in the astrophysically important minutes to hours timescale after the onset of the burst. One of the main science goals of Swift is the fast dissemination of GRB positions for dedicated ground and space-based follow-up. In this context, accuracy is of paramount importance, particularly if prompt spectroscopic observations of bright, optical afterglows is desired.
As part of its routine service to the GRB science community, the Burst Alert Telescope (hereafter BAT, Barthelmy et al. 2004), and the X-ray Telescope (hereafter XRT, Burrows et al. 2004) routinely provide, via the Gamma-Ray Burst Coordinates Network (GCN), automated on-board positions on timescales of less than a few minutes, and their respective science teams provide refined positions (after ground-based re-processing) on timescales of minutes–hours.
For the majority of GRBs the XRT is the only narrow-field instrument on board Swift to provide a localised source position, that is, the majority of Swift-detected bursts are optically-faint, being either intrinsically faint, reddened, or at high redshift (see e.g. Roming et al. 2006), and are therefore below the detector sensitivity of the UltraViolet and Optical Telescope (hereafter UVOT, Roming et al. 2005) .
The XRT prompt positions have a precision of order 3.5 arcseconds (systematic) with an additional statistical uncertainty based on the number of observed counts in the initial image (statistical error, , see Hill et al. 2004). In the high-count regime, the majority of the uncertainty derives from the uncertainty in the attitude reconstruction provided by the star-trackers and uncertainties in the alignment of the boresight to the star-tracker (see e.g. Moretti et al. 2006). Conversely, for the UVOT, knowledge of the boresight and star-tracker solutions are of lesser importance, as, for any image with long enough exposure, UVOT images may be astrometrically corrected by matching positions of detected sources relative to those in stellar catalogues (e.g. USNO-B1) and applying an astrometric correction to the image. For a single UVOT image, the typical residual mean error in source positions, after applying astrometric corrections, is of order 0.5–1.0 arcseconds, depending on the number and location of sources in the 17’x17’ field of view of UVOT. Thus it is only for those rare occasions when there are insufficent stellar matches to provide an accurate astrometric solution, that knowledge of the UVOT boresight is essential.
By contrast our inability to provide accurate astrometric corrections to early XRT observations means that the uncertainty in the XRT positions places severe limitations on the ability of large aperture ground-based telescopes to perform early (within a few hours) spectroscopic observations of the GRB afterglow and its environment.
To improve this situation, we have undertaken an investigation to ascertain whether the UVOT can be used as a Super Star-Tracker, ie. to provide the necessary aspect information to astrometrically correct XRT prompt positions, thereby providing GRB localisations with an accuracy and precision of better than a few arcseconds. This is particularly important if the GRBs are optically faint, and no obvious counterpart is seen in UVOT. Our investigation has a number of aims : (i) estimate the stability of the optical bench on which the XRT and UVOT are mounted, by determining within a single orbit, the accuracy with which XRT and UVOT track individual sources in detector coordinates, then if the tracking between XRT and UVOT proves sufficiently stable, (ii) determine an accurate mapping between XRT and UVOT detector coordinate systems, as a means of providing ultimately, (iii) XRT refined positions enhanced by UVOT astrometric solutions.
For step (i) we work in detector coordinates, and verify that drifts in source positions in detector coordinates within an orbit, caused by drift in the spacecraft attitude, are accurately tracked in both instruments. If this condition is satisfied, then in principal, XRT detector coordinates can be mapped into UVOT detector coordinates (step ii), transformed into the world coordinate system using the star-tracker solution, and then (step iii) aspect corrected with respect to a standard stellar catalogue.
Such a process is feasible, if and only if the following conditions are met :
-
•
The pointing direction of the XRT and UVOT telescopes track each other with high precision (ie. the flexure in the optical bench is minimal).
-
•
Time-dependent focusing variations in both XRT and UVOT, due to changes in the mirror optics (for example, those caused by temperature variations) are minimal.
-
•
There is sufficient temporal overlap between XRT PC mode and UVOT image mode data.
The paper is set out as follows: In §2, we investigate the accuracy with which XRT and UVOT track individual sources in detector coordinates. In §§3 & 4 we outline a method for mapping XRT–UVOT detector coordinates. In §5 we describe in detail our implementation of an automated procedure for producing UVOT-enhanced XRT positions in real-time. In §6 we provide validation of our fitting procedure, and our list of UVOT-enhanced XRT positions for 154 GRBs. Finally, the results are summarised in §7.
2 Tracking the alignment between UVOT and XRT.
In order to track the UVOT/XRT alignment during the course of an orbit, we have selected a target which has been observed in XRT PC event mode111While the XRT has a number of different observing modes, only Imaging and PC event mode data provide 2-dimensional images of the sky necessary for determining GRB positions and UVOT event mode, allowing us to time-slice the observations into short enough intervals to track any drift in the source position in detector coordinates, but with sufficient counts in the XRT to allow accurate centroiding on the source. We require that the XRT PC event mode data are not piled-up, ie. sources with count rates of less than 0.8 ct/s. The bright, radio-loud AGN, 3C 279 (), with an XRT (0.2-10 keV) count-rate of ct/s is a suitable target for this analysis.
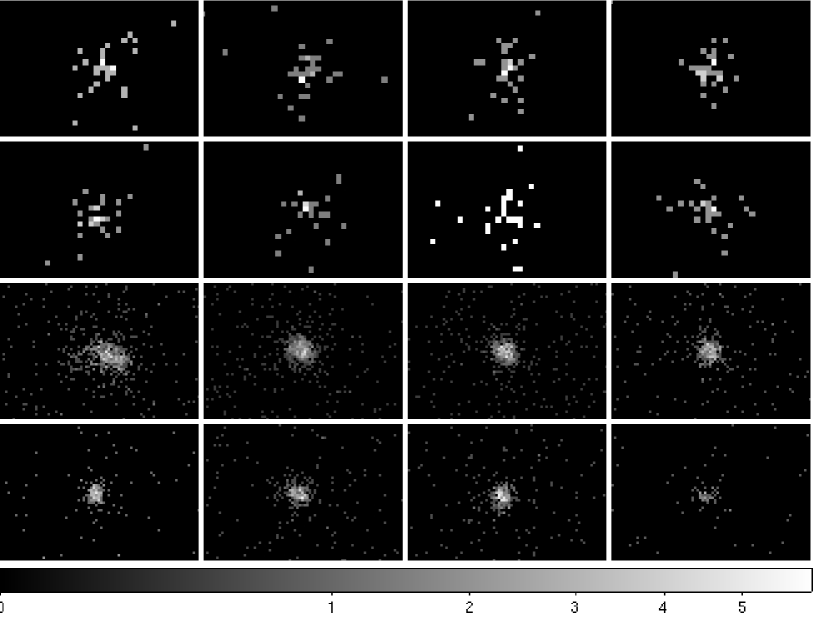
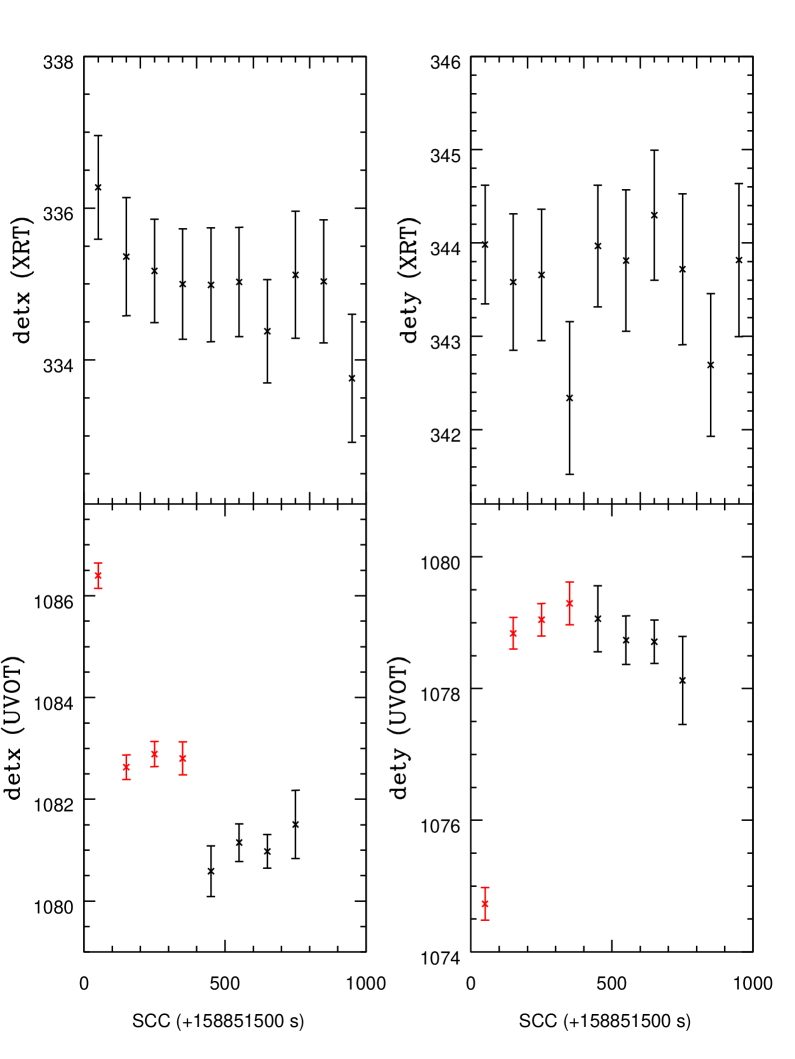
3C 279 has been observed on several occasions by Swift XRT as part of its routine calibration program. This analysis uses data taken between 2006-01-13T00:37:00 and 2006-01-13T23:37:57. With 14 orbits of usable data (15 ksec XRT PC mode), the X-ray data was time-sliced into 100 s bins, providing 10 time slices per orbit, with approximately 30 ct/bin. For each time slice we extracted an image in detector coordinates and measured the source position by fitting the model PSF (the background is negligible over a 100s exposure). A sequence of 8 images each of 100 s duration is shown in Figure 1, panels 1–8. Using the same time intervals we then accumulate images from the UVOT event list (Figure 1, panels 9-16). Because UVOT event data are taken through several different filters (in this instance 3.8 ksec in UVM2 and 5.9 ksec in UVW2), this typically allowed 7-8 images to be constructed per orbit with overlapping XRT PC mode event data, half in UVW2 and half in UVM2. Figure 1 shows that in the first UVOT detector coordinate image, the source is significantly blurred. This blurring, which is also present in the first image of subsequent orbits, is due to small residual movements in the spacecraft pointing direction immediately following the slew. As a consequence large offsets in the UVOT (and also XRT) detector coordinate positions can be recorded between images taken during and after settling (see Figure 2). We note that in some of the 3C279 UVOT event mode data there is evidence for significant (1.0”) changes in the detector coordinate position of an individual source due to filter changes within an orbit, though the occurrence of these is not easily predicted.
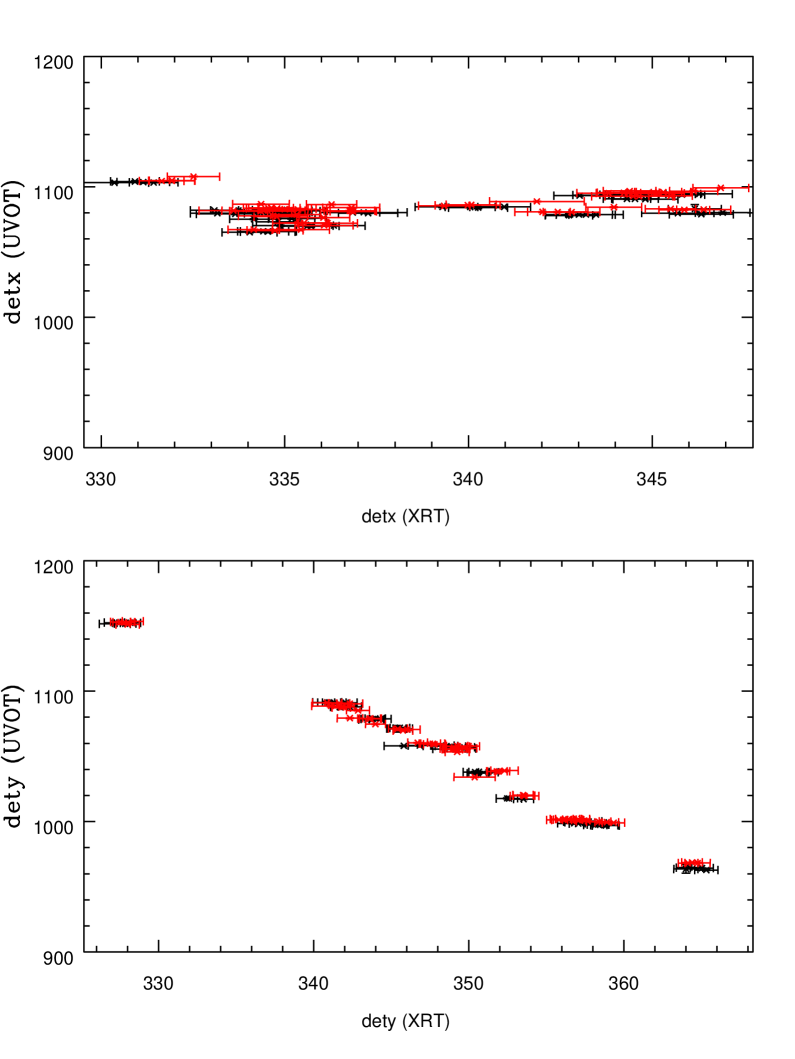
In Figure 3 we show the detector coordinate positions for the XRT and the UVOT, for each of the 14 orbits of data (except orbit 13 which is unusable) (approximately 100 positions). The corresponding positions are highly correlated, particularly in the y-direction, for this particular roll angle (121.6 degrees). The y-directions for the XRT and UVOT detector coordinates are oriented 180+28.7 degrees relative to one another and are therefore expected to show a strong negative correlation in their detector dety coordinates, as is observed in Fig 3.
The measured separation of the source position in detector coordinates between orbits 1 and 15 is 192.6 UVOT pixels and 39.4 XRT pixels respectively. For a pixel scale of 0.5 arcsec/pixel (UVOT) and 2.36 arcsec/pixel (XRT), this separation corresponds to 96.3 arcsec (UVOT) and 92.9 arcsec (XRT), i.e. a 4% error in the tracking (consistent with the accuracy to which the XRT pixel sizes are known). The difference in the angular direction is consistent with the optical bench design which has UVOT oriented 28.7 degrees relative to XRT along the y-axis, with their y-axes running in opposite directions.
The accuracy with which source positions are tracked in both detectors suggests that there is no evidence for flexure in the optical bench and that the azimuth for each of the two detector coordinate planes is aligned to very high precision.
3 Mapping XRT to UVOT detector coordinates
We start from the simplifying assumption that the detector plate scales for both instruments are linearised and both lie in the x-y plane222Any tilt in the azimuthal direction (ie. the angle between the normals to the two detector planes) can manifest itself as a change in the ratio of the plate-scales in both x and y directions. However we find no evidence for this.. We fit the mapping between XRT and UVOT detector coordinates through a combination of rotation, zero-point offset, and multiplicative plate-scale (ratio of the size of UVOT to XRT detector pixels) by minimising the detx, dety residuals between measured and predicted UVOT detector positions. That is, we minimise the difference between the predicted UVOT detector position and the measured UVOT detector position (determined by fitting the model PSF), where , are given by :
| (1) |
where is the ratio of the UVOT/XRT detector plate-scales, is the rotation angle between the two detectors, and (, ) are the zero point offsets. Note that the form of this rotation matrix accounts for the degree difference in orientation of the detector coordinate y-axes between XRT and UVOT.
Given the spacecraft pointing uncertainty (few arcminutes), the detector coordinate map relating XRT detector coordinate to UVOT coordinate positions must span a substantial fraction of the 17’x17’ field of view of UVOT. Thus we require a large number of observations covering a large fraction of the detector and spanning a large range in roll-angles (to reduce the likelihood of producing a map which is accurate along one direction only, since repeated pointings at similar roll angles tend to cover a very narrow area on the detector plane, and to verify that roll-angle effects are absent). The 3C279 UVOT event mode data used previously to determine the tracking stability is unsuitable on its own due to the restricted range in roll-angles covered by these observations. Fortunately, there are numerous (100) XRT PC-mode and UVOT V-band observations of 3C 279 taken over a large range in roll-angle and available within the public Swift data archive333The current (as of April 2006) UVOT filter wheel sequence for a new GRB is: 10 s V-band settling exposure, a 100 s White filter finding chart, 400 s V-band filter finding chart, followed by observations through all UV and optical filters in turn followed by a White filter and then V-band filter finding chart. We decided in the first instance to calibrate the map for the V-band filter only. White has not been used in the calibration as yet because although these observations begin once the as-settled flag is set, the spacecraft can still show large drifts in attitude (lasting up to a few hundred seconds after the GRB trigger), causing substantial drifts in the detector coordinate position. Since detector to sky coordinate conversions are determined for a specific instant in time, and GRBs generally fade rapidly (ie. most of the X-ray photons arrive during the first few tens of seconds of the exposure) GRB X-ray detector coordinate positions can often be inaccurate if the spacecraft has not yet come to rest. For the majority of bursts V-band observations start when drifts in the spacecraft attitude are far smaller, so the V-band filter is the earliest to give an easily interpretable position..
Based on minimising the residuals between the predicted and measured UVOT positions in detector coordinates using observations of 3C 279 taken over a broad range in spacecraft roll angle and covering the central 8 arcminutes of the XRT detector, the best-fitting model parameters are as follows : () with a 90% confidence limit of 1.3”. Both the orientation, , and ratio of the plate-scale, , are entirely consistent with the known relative detector geometries for XRT and UVOT.
4 PSF fitting of XRT PC-mode GRB prompt and early afterglow emission using the Cash-Statistic
Aside from the systematic error derived from the XRT-UVOT detector mapping, the precision with which a source position can be determined also depends upon the precision with which the XRT detector coordinate position can be determined, particularly in the low photon count regime when the statistical error on the XRT position will dominate the error budget.
In order to produce as accurate a position as possible, we have employed PSF fitting to determine GRB positions. The procedure is as follows: a list of potential sources in the XRT detector coordinate image is found using a specially written version of the celldetect algorithm (Harnden et al. 1984), which is tuned for the XRT PSF (Moretti et al. 2005), which at the same time is able to discount any potential residual hot-pixels as sources. For the exposures obtained during the UVOT/XRT data overlap intervals (see below), which are typically 100-400 s, the background level is negligible, and experience with the algorithm suggests a source can reliably be detected with as few as 10 counts with a S/N of 2.0. Once a source has been detected its position is determined using a PSF centroid fitting algorithm based on the maximum likelihood method of Cash (1979). The standard -statistic from this paper is modified so that the integral of the PSF probability distribution is renormalised in the presence of bad CCD detector columns which have no exposure. Several such columns in the centre of the CCD resulted from a micrometeoroid strike on 2005 May 27 (Abbey et al. 2005).
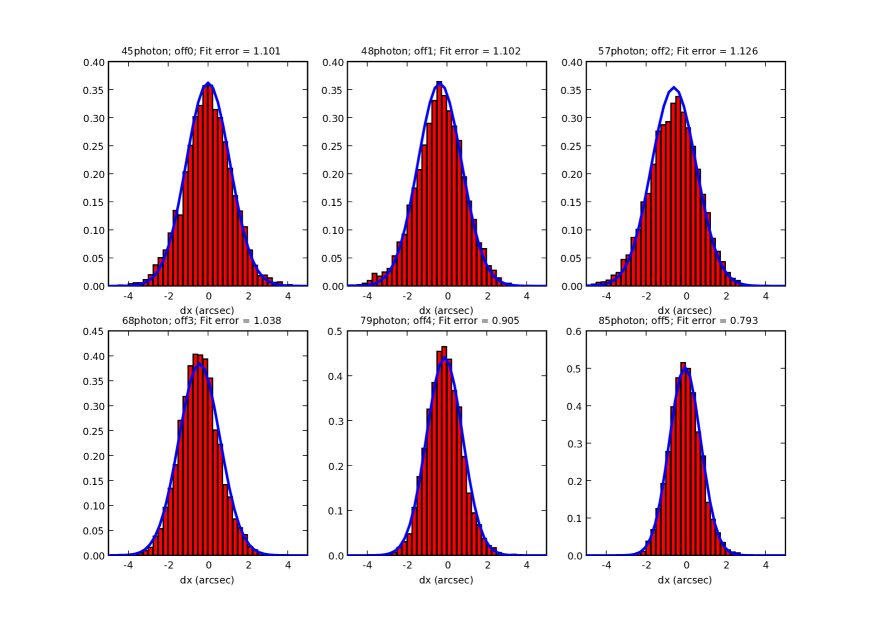
The centroiding algorithm has been tested using Monte-Carlo simulations (see Fig 4). Simulating sources with different numbers of counts, photons were drawn at random from the XRT PSF probability distribution and the centroid determined. Comparison of the distribution of position residuals obtained after 5000 simulations per run confirmed that the returned 90% statistical error, , derived from the fit for non piled-up data was accurate and followed the relation arcseconds.
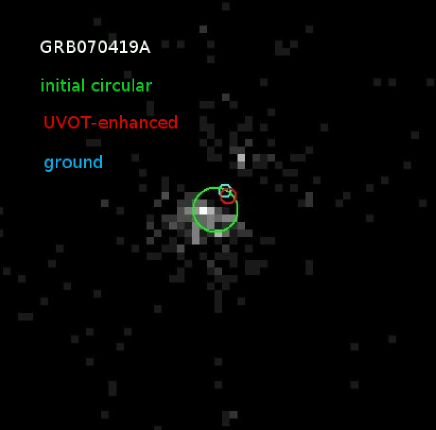
We have also verified that the centroiding performs well in the presence of bad columns. At the time of writing, standard processing of XRT PC mode data removes 5 columns centred at detector x-coordinate 292 and 3 columns at 320. Simulations were performed as before, but either 3 or 5 columns were removed from the image at various offsets from the expected PSF centre. The results showed that the centroids were unaffected by the presence of 3 bad columns, while for 5 bad columns, a worse case residual offset of 0.6 arcseconds was seen when the true source centre was placed inside the bad columns (Fig 4). For comparison, a simple barycentre centroid estimator applied to the 5 bad column simulations showed a worse case offset of 2.4 arcseconds. Based on these results, if a source centroid is found to be inside the 5 bad columns an additional systematic error of 0.6 arcseconds is included. In Figure 5 we show the XRT PC mode sky coordinate image from the first orbit of data for GRB 070419A, a burst which was severely affected by the presence of vetoed bad columns. Our UVOT-enhanced XRT position, using the PSF fitting routine, accounting for bad columns and the UVOT-XRT detector map, is a significant improvement on the XRT refined position (Stratta 2007).
During the XRT’s automated response to a GRB, the observed X-ray light curve may be piled-up in Photon Counting mode when the observed count rate is greater than . Because of this, we also tested how accurate the centroiding algorithm is when a source is piled-up. A number of observations were selected from the Swift data archive which had different levels of pile-up. For each observation a piled-up PSF profile was determined from the image. The piled-up profile was used as the input PSF probability distribution for simulating sources, which then had their centroids fitted using the non piled-up PSF. The distribution of residuals showed that the position statistical error, , is underestimated when the number of counts in an image is low and the data are piled-up. The simulations allowed a 90% confidence error correction term to be derived, to be added in quadrature to the formal fit error, equal to , where is the observed count rate when greater than the non piled-up limit of .
5 Production of UVOT-enhanced XRT positions
The publicly available on-line quick-look data area is checked every 10 minutes for data associated with a new trigger number. Once a dataset containing both PC mode XRT data and V-band UVOT imaging data is made available by the Swift Data Center (SDC), the creation of a UVOT-enhanced XRT position is initiated. The process is fully automated. The timescale for which an enhanced position is produced depends ultimately on the timescale for which SDC processed down-linked data are delivered to the Data Centre Quick-Look area. In most cases this will occur within a few hours of the burst trigger, unless the spacecraft is an orbit which does not pass over the Malindi ground station, during which time no data down-link is possible.
The automated position enhancement procedure works on the first observation of a new GRB, which is first broken down into times when PC mode X-ray data were obtained simultaneously with UVOT V-band images. Currently our automated procedure requires simultaneity of data since some drift in attitude is expected, particularly during the spacecraft settling phase. It is possible that this constraint may be relaxed in the future. In most cases444We have derived UVOT-enhanced XRT positions for 84 out of 135 GRBs observed by Swift since April 2006 when the current filter sequence was implemented, and for 154 bursts in total (see Table 3). there will be at least one V-band image that overlaps with XRT-PC event mode data during the first orbit of observations555Exceptions include : very bright bursts for which XRT remains in WT mode for the whole of the first orbit (e.g. GRB 051117A, Goad et al. 2007), delayed slews (which have a variety of causes, including Sun-Earth-Moon constraints), and bright stars in the UVOT field of view.. Such times are referred to as overlaps throughout the rest of this paper. For each interval of overlap the following steps are taken:
-
•
An XRT PC-mode detector co-ordinate image is produced from the cleaned event lists, and any sources therein are automatically detected. The position centroid of each detected source is determined using the PSF fitting routine described in §4. If no source is found within 40” of the XRT TDRSS position (if available), or in cases where there is no XRT TDRSS position, within the 3 arcminute BAT error circle, this overlap is rejected.
If an XRT TDRSS position is available, the source located closest to this position is assumed to be the GRB. Otherwise, for the first three overlaps the brightest source within the BAT position error circle is assumed to be the GRB666Experience shows that for prompt (within a few minutes) slews, the brightest source within the XRT field of view is the GRB afterglow. This is not necessarily true for delayed slews, or for XRT ToO observations of GRBs detected by other instruments.; after this the weighted mean of these three positions is calculated and the nearest source to this position is assumed to be the GRB.
-
•
If the GRB position was determined using fewer than 10 XRT photons it is deemed unreliable and the overlap is rejected.
-
•
If the source position is more than 40” away from the XRT TDRSS position (when available) or from the weighted mean position (formed from the weighted average of UVOT enhanced XRT positions determined within each of the first three overlaps) of the UVOT-enhanced XRT position otherwise, it is flagged as a non-GRB and the overlap is rejected.
-
•
The source position for the GRB in XRT detector coordinates is converted to an equivalent detector coordinate position for UVOT, using the XRT-UVOT detector coordinate mapping procedure described in §4. The UVOT detector position is then transformed into a sky coordinate position using the Swift tool swiftxform which applies the aspect information supplied by the star-trackers to the UVOT reference pixel.
-
•
Serendipitous source positions in the UVOT sky coordinate image are matched with their corresponding optical counterparts in the USNO-B1 catalogue, using the Swift tool uvotskycorr which determines the astrometric transformation required to correct UVOT sky-coordinate positions relative to USNO-B1. Overlaps containing UVOT astrometric corrections of ” resulting from drifts in the spacecraft attitude during the settling phase (which may last up to a few hundred seconds following a repointing of the telescope) are rejected as unreliable.
-
•
Finally, the derived quaternions describing the transformation from the UVOT WCS to USNO-B1 WCS are applied to the XRT position, yielding for each overlap interval, an UVOT astrometrically-enhanced XRT position for the GRB.
The precision of the final position is formed from a combination of both statistical and systematic errors. These include the statistical uncertainty associated with the PSF fitting procedure (step 1), and the residual uncertainty in the astrometric solution relating UVOT WCS to USNO-B1 WCS (steps 5–6). These uncertainties are added in quadrature. From these we determine a weighted mean position and error. Any of the individual overlap positions which lie outside of the weighted means’ 3- error circle are rejected as outliers and the weighted mean position and error re-calculated. Finally, the systematic uncertainty associated with the mapping between XRT–UVOT detector coordinates (1.3”, 90% confidence, §3) plus an additional systematic uncertainty, necessary to place 90% of optically detected GRBs within our 90% error circle (see §6), are added in quadrature at the end.
5.1 Dissemination of results
Once determined, the UVOT-enhanced XRT position is made available to the GRB community via an automated GCN circular. More detailed information is published electronically at http://www.swift.ac.uk/xrt_positions. This online material contains a list of every enhanced position produced, links to detailed results pages for individual bursts, and links to images of the UVOT filter sequence; as well as descriptions of the process of deriving these and other types of XRT position (e.g. SPER positions). The filter sequence images are a graphical representation of the UVOT observations through each filter and are provided both for completeness and diagnostic purposes.
The detailed results pages can be accessed by appending targetID777the target ID is the trigger number padded to 8 digits with leading zeroes. e.g. GRB 070531 was trigger 280958, so has target ID 00280958./image.php to the above URL, and a page exists for each burst with at least one overlap. This page gives the source position and error, the number of overlaps included in the position determination and the total amount of exposure time within those overlaps. We also provide a breakdown of the number of overlaps excluded from the final position calculation and the reason for their rejection (i.e low counts, large astrometric correction etc.). These results are tabulated at the top of each page.
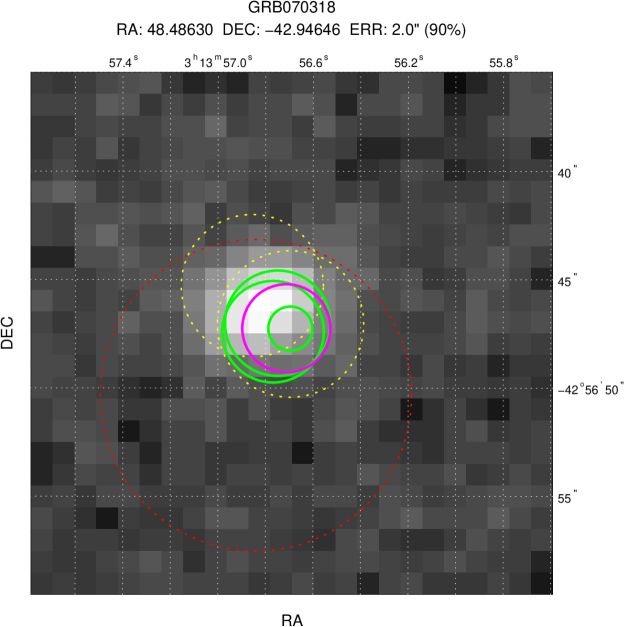
Below this, we provide two UVOT V-band images centred on the GRB position. The first image is a close up image from the summed, astrometrically corrected, UVOT V-band images overlaid with the enhanced XRT 90% confidence error circle. A larger version of this image is also provided, overlaid in this case with the position and error circle from each overlap. Those positions used to calculate the enhanced position are shown in green, positions rejected due to low counts are indicated in red, while all other rejected positions are in shown in yellow. Fig. 6 shows one example, GRB 070318.

5.2 When a position cannot be determined
An enhanced position cannot be determined for every burst. The most common reason for failure is the absence of overlapping PC-mode XRT data and V-band UVOT data. This can occur for example if the UVOT is in blocked mode, due to the presence of a bright star within the UVOT field of view. Alternatively, if the slew was delayed or the burst initially faint, the number of source counts at the location of the burst in XRT PC mode data may be less than the 10 counts required to reliably centroid on a source. Cases for which no position correction was possible are reported on the main results page. If at least one overlap exists, but no corrected position was produced, a detailed results page is also produced, and a brief explanation of the reason for the failure summarised on the main results page.
5.3 Manual Intervention
The automated procedure is not a catch-all in that incorrect positions may in principle be made. For example, if the initial XRT GCN position notice is wrong, this could lead to an enhanced position for a non-GRB being produced. The same is possible if there is no XRT position notice and the brightest source in the BAT field of view at early times is not the GRB. Both of these eventualities are very unlikely, but not impossible. Such cases will be manually corrected. Furthermore, we have found at least two occurrences of incorrect attitude reconstruction for UVOT images of GRBs out of the many thousands of UVOT images of GRBs processed to date. In such cases the XRT team will supply an XRT refined position based on telemetered XRT PC-mode data, and a UVOT-enhanced XRT position from a manual application of the automated pipeline (using the refined XRT position as the starting position) as soon as the data allow.
6 Validation of results
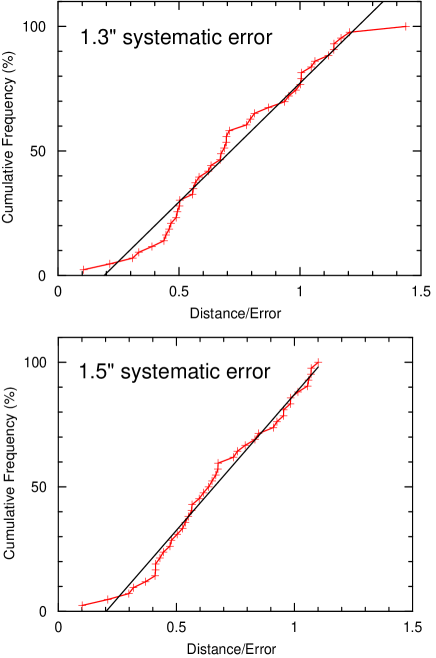
In order to validate our procedure, we ran our automated position enhancement software pipeline for every GRB observed by Swift, yielding 154 enhanced positions up to GRB 070724A, a success rate of %. 40 of these GRBS were also detected by UVOT, for these we calculated the distance between the UVOT detected position and the UVOT-enhanced XRT position. Fig. 7 shows the distribution of the offsets between our UVOT-enhanced XRT positions and UVOT detected positions obtained from the publicly available GCN notices for these 40 GRBs. 90% of the enhanced XRT positions fall within 2.5 arcseconds of the UVOT detected position. We evaluated the uncertainty in the UVOT-enhanced XRT positions by comparing these positions’ offsets from the UVOT positions divided by the errors of the UVOT-enhanced XRT and UVOT position errors added in quadrature.
Including the 1.3” uncertainty in the XRT-UVOT mapping as the only systematic uncertainty we find that the position offset for 90% of the bursts is 1.25 times the combined error, suggesting that the systematic error is too small (Fig. 8, upper panel). Increasing the systematic error888Our own analysis of UVOT positions and uncertainties for GRB optical transients does not result in any additional systematic error component to that already found. to 1.5” ensures that the positions agree within the 90% errors, 90% of the time (Fig. 8, lower panel). At present the cause of the extra uncertainty is unknown, and the increase of our systematic error is a conservative move; it assumes that the quoted UVOT positions and uncertainties are accurate. It is possible that improved estimates for the UVOT detected source position and error may reduce the magnitude of this additional systematic uncertainty999UVOT position uncertainties are in the range 0.5–1.0”, thus the bulk of the additional systematic uncertainty in the UVOT-enhanced XRT positions must originate elsewhere.. Additionally, as the number of OTs increases, improvements can be made to the UVOT V-band – XRT detector mapping (obviously, additional non-GRB pointings with simultaneous XRT PC mode and UVOT imaging data can also be used) .
Finally, while concerted effort has been made in determining an accurate map for the V-band filter, it is our intention to extend this process to other filters, particularly the White light filter which has the highest sensitivity and is used early in the filter sequence when the bursts are brighter.
The UVOT-enhanced XRT positions for 154 GRBs are shown in Table 3. 50% of the bursts have position errors below 2.1”; with the X-ray fainter bursts having larger errors, so that 90% of all bursts have position errors below 4.2”. The enhanced positions are automatically relayed to the Gamma Ray Burst community via GCN circulars, as well as being made available for public scrutiny on our web-pages located at http://www.swift.ac.uk/xrt_positions. An example UVOT V-band image with UVOT-enhanced XRT source positions overlaid is shown in Fig 6.
7 Summary
We have constructed an automated pipeline for producing Swift XRT positions enhanced by UVOT astrometry, which are made available within a few hours of a GRB trigger. Our position determinations have not only increased precision ( a factor of 2 reduction in error radius) relative to the refined XRT positions previously in use, but additionally have an accuracy relative to optically localised positions which is a factor of 2 better. The positional accuracy obtained using this technique is superior to astrometrically corrected X-ray positions (obtained by matching X-ray sources to optical counterparts) at early times (for up to 24 hours), and is comparable to the accuracy achieved using this technique at later times.
References
- (1) Abbey et al. 2005, in ESA-SP 604, ’The X-ray Universe 2005’, 943
- (2) Barthelmy, S.D. 2004 Proc. SPIE Vol 5165, 175.
- (3) Burrows, D.N. et al. 2004. SPIE 5165 201
- (4) Butler, N.R. 2007, AJ 133, 1027.
- (5) Cash, W. 1979 ApJ 228, 939.
- (6) Gehrels, N., Chincarini, G. Giommi, P. et al. 2004, ApJ 611, 1005.
- (7) Goad, M.R., Page, K.L., Godet, O., Beardmore, A. & Osborne, J.P. 2007, A&A 468, 103.
- (8) Harnden, F. R., Fabricant, D. G., Harris, D. E., & Schwartz, J. 1984, SAO Report No. 393
- (9) Hill, J.E., Burrows, D.N, Nousek, J.A., Abbey, A.F. Ambrosi, R.M. et al. 2004, SPIE 5165, 217.
- (10) Moretti, A., Campana, S., Mineo, T. et al. 2005, SPIE 5898, 360.
- (11) Moretti, A., Perri, M. Capalbi, M. Angelini, L. Hill, J.E. et al. 2006, A&A 444, L9.
- (12) Roming, P.W.A., Schady, P., Fox, D.B., Zhang, B., Liang. E. et al. 2006, ApJ 652, 1416
- (13) Roming, P.W.A., Kennedy, T.E., Mason, K.O. et al. 2005, SSR 120, 95.
- (14) Stratta, G. 2007, GCN Circular 6323.
| GRB Name | RA (J2000) | Dec (J2000) | Error† (”) |
|---|---|---|---|
| GRB 070724A | 01 51 13.98 | 18 35 39.8 | 2.2 |
| GRB 070721B | 02 12 32.84 | 02 11 39.7 | 1.8 |
| GRB 070721A | 00 12 39.21 | 28 33 00.7 | 2.2 |
| GRB 070714B | 03 51 22.29 | 28 17 52.2 | 1.7 |
| GRB 070714A | 02 51 43.37 | 30 14 36.2 | 1.9 |
| GRB 070704 | 23 38 47.82 | 66 15 11.8 | 2.7 |
| GRB 070628 | 07 41 06.02 | 20 16 45.6 | 1.6 |
| GRB 070621 | 21 35 10.14 | 24 49 03.3 | 1.7 |
| GRB 070616 | 02 08 36.60 | 56 56 43.8 | 2.3 |
| GRB 070615 | 02 57 55.21 | 04 26 56.7 | 7.3 |
| GRB 070612B | 17 26 54.48 | 08 45 03.2 | 3.6 |
| GRB 070610 | 19 55 09.61 | 26 14 06.7 | 4.1 |
| GRB 070531 | 00 26 58.48 | 74 18 46.7 | 1.9 |
| GRB 070521 | 16 10 38.57 | 30 15 21.7 | 1.8 |
| GRB 070520B | 08 07 31.07 | 57 36 28.9 | 2.5 |
| GRB 070518 | 16 56 47.83 | 55 17 43.0 | 2.2 |
| GRB 070509 | 15 51 50.51 | 78 39 07.1 | 2.5 |
| GRB 070508 | 20 51 12.02 | 78 23 05.0 | 2.0 |
| GRB 070506 | 23 08 52.34 | 10 43 20.3 | 2.9 |
| GRB 070429A | 19 50 48.91 | 32 24 17.5 | 2.5 |
| GRB 070420 | 08 04 55.13 | 45 33 21.7 | 1.6 |
| GRB 070419B | 21 02 49.79 | 31 15 48.5 | 1.6 |
| GRB 070419A | 12 10 58.83 | 39 55 31.5 | 2.3 |
| GRB 070412 | 12 06 10.11 | 40 08 37.1 | 4.6 |
| GRB 070411 | 07 09 19.78 | 01 03 50.9 | 2.6 |
| GRB 070328 | 04 20 27.60 | 34 04 00.6 | 1.8 |
| GRB 070318 | 03 13 56.69 | 42 56 47.3 | 1.7 |
| GRB 070311 | 05 50 08.21 | 03 22 29.6 | 2.7 |
| GRB 070306 | 09 52 23.25 | 10 28 55.5 | 1.6 |
| GRB 070227 | 08 01 17.00 | 46 23 27.8 | 2.0 |
| GRB 070224 | 11 56 06.65 | 13 19 49.6 | 2.0 |
| GRB 070220 | 02 19 06.86 | 68 48 16.1 | 1.7 |
| GRB 070219 | 17 20 45.91 | 69 22 15.6 | 3.2 |
| GRB 070208 | 13 11 32.76 | 61 57 55.2 | 2.4 |
| GRB 070129 | 02 28 00.89 | 11 41 03.3 | 1.8 |
| GRB 070110 | 00 03 39.30 | 52 58 28.6 | 1.7 |
| GRB 070107 | 10 37 36.49 | 53 12 47.5 | 1.6 |
| GRB 070103 | 23 30 13.74 | 26 52 33.2 | 1.8 |
| GRB 061222A | 23 53 03.47 | 46 31 57.6 | 1.6 |
| GRB 061202 | 07 02 06.03 | 74 41 54.4 | 1.7 |
| GRB 061201 | 22 08 32.23 | 74 34 49.1 | 1.7 |
| GRB 061126 | 05 46 24.67 | 64 12 40.0 | 1.6 |
| GRB 061122 | 20 15 19.79 | 15 31 02.3 | 2.0 |
| GRB 061110A | 22 25 09.81 | 02 15 27.9 | 1.9 |
| GRB 061021 | 09 40 36.17 | 21 57 05.3 | 1.6 |
| GRB 061019 | 06 06 30.92 | 29 34 12.8 | 2.3 |
| GRB 061007 | 03 05 19.70 | 50 30 02.7 | 1.9 |
| GRB 061006 | 07 24 07.88 | 79 11 53.2 | 3.2 |
| GRB 061004 | 06 31 10.80 | 45 54 24.3 | 1.7 |
| GRB 060929 | 17 32 28.93 | 29 50 06.7 | 2.0 |
| GRB 060927 | 21 58 12.01 | 05 21 49.8 | 2.1 |
| GRB 060926 | 17 35 43.75 | 13 02 14.3 | 4.5 |
| GRB 060923B | 15 52 46.64 | 30 54 14.7 | 2.5 |
| GRB 060923A | 16 58 28.12 | 12 21 38.8 | 2.1 |
| GRB 060919 | 18 27 41.76 | 51 00 52.4 | 2.3 |
| GRB 060912A | 00 21 08.09 | 20 58 19.1 | 1.7 |
| GRB 060908 | 02 07 18.43 | 00 20 32.8 | 1.6 |
| GRB Name | RA (J2000) | Dec (J2000) | Error (”) |
|---|---|---|---|
| GRB 060906 | 02 43 00.83 | 30 21 42.6 | 2.1 |
| GRB 060904B | 03 52 50.57 | 00 43 29.9 | 2.5 |
| GRB 060825 | 01 12 21.54 | 55 46 41.4 | 7.3 |
| GRB 060814 | 14 45 21.34 | 20 35 09.6 | 1.6 |
| GRB 060813 | 07 27 35.33 | 29 50 49.4 | 1.8 |
| GRB 060807 | 16 50 02.62 | 31 35 30.2 | 1.6 |
| GRB 060805A | 14 43 43.35 | 12 35 12.3 | 2.8 |
| GRB 060804 | 07 28 49.27 | 27 12 56.1 | 1.7 |
| GRB 060801 | 14 12 01.32 | 16 58 54.4 | 1.9 |
| GRB 060729 | 06 21 31.81 | 62 22 12.1 | 1.7 |
| GRB 060719 | 01 13 43.72 | 48 22 50.9 | 1.9 |
| GRB 060714 | 15 11 26.45 | 06 33 59.3 | 1.7 |
| GRB 060708 | 00 31 13.72 | 33 45 34.1 | 1.9 |
| GRB 060707 | 23 48 19.11 | 17 54 17.6 | 1.7 |
| GRB 060614 | 21 23 32.06 | 53 01 36.2 | 1.9 |
| GRB 060607A | 21 58 50.46 | 22 29 47.3 | 1.6 |
| GRB 060605 | 21 28 37.32 | 06 03 30.7 | 1.7 |
| GRB 060604 | 22 28 55.36 | 10 54 55.4 | 5.2 |
| GRB 060526 | 15 31 18.31 | 00 17 06.2 | 1.8 |
| GRB 060522 | 21 31 44.86 | 02 53 10.1 | 1.8 |
| GRB 060512 | 13 03 05.70 | 41 11 26.5 | 1.9 |
| GRB 060510B | 15 56 29.37 | 78 34 11.6 | 2.0 |
| GRB 060507 | 05 59 50.41 | 75 14 56.0 | 2.6 |
| GRB 060502B | 18 35 44.79 | 52 37 55.7 | 6.3 |
| GRB 060502A | 16 03 42.58 | 66 36 01.5 | 1.8 |
| GRB 060428B | 15 41 25.77 | 62 01 29.8 | 2.4 |
| GRB 060428A | 08 14 10.77 | 37 10 11.7 | 1.7 |
| GRB 060427 | 08 17 04.29 | 62 40 17.0 | 2.3 |
| GRB 060418 | 15 45 42.70 | 03 38 21.0 | 2.0 |
| GRB 060413 | 19 25 07.82 | 13 45 30.1 | 1.6 |
| GRB 060319 | 11 45 32.91 | 60 00 39.2 | 2.0 |
| GRB 060313 | 04 26 28.41 | 10 50 41.2 | 2.0 |
| GRB 060306 | 02 44 22.74 | 02 08 55.1 | 3.5 |
| GRB 060223A | 03 40 49.50 | 17 07 48.7 | 4.2 |
| GRB 060218 | 03 21 39.65 | 16 52 01.0 | 2.1 |
| GRB 060211A | 03 53 32.70 | 21 29 19.2 | 4.1 |
| GRB 060210 | 03 50 57.31 | 27 01 33.8 | 1.6 |
| GRB 060130 | 15 16 30.53 | 36 50 07.4 | 2.1 |
| GRB 060206 | 13 31 43.51 | 35 03 02.0 | 2.7 |
| GRB 060204B | 14 07 15.05 | 27 40 36.9 | 2.0 |
| GRB 060203 | 06 54 04.00 | 71 48 39.3 | 3.5 |
| GRB 060202 | 02 23 22.92 | 38 23 03.6 | 1.8 |
| GRB 060123 | 11 58 47.75 | 45 30 51.4 | 4.4 |
| GRB 060121 | 09 09 52.14 | 45 39 47.7 | 2.4 |
| GRB 060116 | 05 38 46.24 | 05 26 13.9 | 3.0 |
| GRB 060115 | 03 36 08.27 | 17 20 41.8 | 2.5 |
| GRB 060111B | 19 05 42.55 | 70 22 32.2 | 2.2 |
| GRB 060111A | 18 24 49.22 | 37 36 15.7 | 4.6 |
| GRB 060109 | 18 50 43.65 | 31 59 27.2 | 2.3 |
| GRB 060105 | 19 50 00.74 | 46 20 56.6 | 1.7 |
| GRB 051221A | 21 54 48.24 | 16 53 22.7 | 3.6 |
| GRB 051211B | 23 02 41.13 | 55 04 48.8 | 2.5 |
| GRB 051109B | 23 01 50.29 | 38 40 47.2 | 2.3 |
| GRB 051109A | 22 01 15.30 | 40 49 22.7 | 1.7 |
| GRB 051028 | 01 48 14.99 | 47 45 10.0 | 4.2 |
| GRB 051021A | 01 56 36.25 | 09 04 01.0 | 2.2 |
| GRB 051016B | 08 48 27.97 | 13 39 19.7 | 2.4 |
| GRB Name | RA (J2000) | Dec (J2000) | Error (”) |
|---|---|---|---|
| GRB 051016A | 08 11 16.93 | 18 17 55.4 | 4.3 |
| GRB 051012 | 18 02 28.59 | 52 36 49.0 | 1.8 |
| GRB 051008 | 13 31 29.45 | 42 05 52.7 | 2.0 |
| GRB 050922C | 21 09 32.97 | 08 45 30.6 | 1.7 |
| GRB 050922A | 18 04 21.99 | 32 10 51.1 | 4.6 |
| GRB 050922B | 00 23 13.68 | 05 36 17.0 | 2.6 |
| GRB 050918 | 17 51 12.14 | 25 34 39.0 | 3.3 |
| GRB 050915A | 05 26 45.14 | 28 01 01.1 | 2.8 |
| GRB 050908 | 01 21 50.92 | 12 57 17.8 | 4.6 |
| GRB 050904 | 00 54 51.13 | 14 05 06.0 | 1.9 |
| GRB 050827 | 04 17 09.59 | 18 12 02.0 | 2.6 |
| GRB 050826 | 05 51 01.65 | 02 38 34.9 | 4.7 |
| GRB 050822 | 03 24 27.37 | 46 02 00.8 | 2.2 |
| GRB 050820A | 22 29 38.12 | 19 33 37.1 | 1.8 |
| GRB 050819 | 23 55 01.53 | 24 51 41.2 | 3.5 |
| GRB 050815 | 19 34 22.98 | 09 08 46.6 | 5.1 |
| GRB 050814 | 17 36 45.30 | 46 20 21.6 | 2.1 |
| GRB 050813 | 16 07 56.77 | 11 14 56.3 | 1.7 |
| GRB 050803 | 23 22 37.91 | 05 47 09.4 | 1.7 |
| GRB 050802 | 14 37 05.80 | 27 47 11.5 | 2.3 |
| GRB 050730 | 14 08 17.21 | 03 46 19.3 | 1.6 |
| GRB 050724 | 16 24 44.07 | 27 32 26.5 | 2.9 |
| GRB 050717 | 14 17 24.49 | 50 32 00.8 | 2.3 |
| GRB 050716 | 22 34 20.40 | 38 41 07.0 | 3.7 |
| GRB 050714B | 11 18 47.66 | 15 32 48.4 | 3.6 |
| GRB 050713A | 21 22 09.34 | 77 04 29.6 | 1.8 |
| GRB 050712 | 05 10 48.29 | 64 54 48.6 | 2.4 |
| GRB 050603 | 02 39 56.96 | 25 10 54.2 | 1.7 |
| GRB 050509C | 12 52 21.03 | 44 26 00.9 | 2.5 |
| GRB 050505 | 09 27 03.30 | 30 16 23.8 | 1.6 |
| GRB 050504 | 13 24 01.29 | 40 42 14.7 | 3.6 |
| GRB 050502B | 09 30 10.13 | 16 59 47.5 | 1.9 |
| GRB 050416A | 12 33 54.55 | 21 03 27.0 | 1.9 |
| GRB 050408 | 12 02 17.31 | 10 51 09.5 | 2.1 |
| GRB 050319 | 10 16 47.93 | 43 32 55.3 | 1.8 |
| GRB 050318 | 03 18 50.95 | 46 23 44.7 | 2.2 |
| GRB 050315 | 20 25 54.07 | 42 36 01.5 | 2.0 |
| GRB 050306 | 18 49 14.58 | 09 09 06.9 | 5.3 |
| GRB 050219B | 05 25 16.02 | 57 45 27.8 | 2.8 |
| GRB 050124 | 12 51 30.70 | 13 02 41.3 | 4.7 |
All errors 90% confidence radius.