Chandra View of DA 530: A Sub-energetic Supernova Remnant with a Pulsar Wind Nebula?
Abstract
DA 530 (G93.3+6.9) is a high Galactic latitude supernova remnant with a well-defined shell-like radio morphology and an exceptionally low X-ray to radio luminosity ratio. Based on a Chandra ACIS observation, we report the detection of an extended X-ray feature close to the center of the remnant with above the background within a circle of radius. The spectrum of this feature can be characterized by a power-law with the photon index . This feature, spatially coinciding with a nonthermal radio source, most likely represents a pulsar wind nebula. We have further examined the spectrum of the diffuse X-ray emission from the remnant interior with a background-subtracted count rate of counts in 0.3-3.5 keV. The spectrum of the emission can be described by a thermal plasma with a temperature of 0.3–0.6 keV and a Si over-abundance of solar. These spectral characteristics, together with the extremely low X-ray luminosity, suggest that the remnant arises from a supernova with an anomalously low mechanical energy (). The centrally-filled thermal X-ray emission of the remnant may indicate an early thermalization of the SN ejecta by the circum-stellar medium. Our results suggest that the remnant is likely the product of a core-collapsed SN with a progenitor mass of 8-12 M⊙. Similar remnants are probably common in the Galaxy, but have rarely been studied.
1 Introduction
X-ray observations of Galactic supernova remnants (SNRs) help us to explore how stars end their lives and what the end-products are. Existing studies have concentrated on X-ray-bright SNRs, which tend to be energetic and to be located in relatively dense interstellar environments. The conclusions we drew from such studies may thus be biased. Indeed, recent observations of supernovae (SNe) show a broad range of explosion characteristics; some SNe appear to be substantially sub-luminous with very small expansion velocities of the ejecta, indicating low explosion energies (e.g., 1997D-like SNe, Zampieri et al. 2003, Pastorello et al. 2004; the 2002cx-like SNe, Jha et al. 2006). Naturally, one expects that such SNe should lead to sub-energetic SNRs. Therefore, from the study of nearby sub-energetic SNRs, we may learn about the explosion processes and their dependence on progenitor stellar masses and binary properties, for example.
DA 530 (G93.3+6.9) is probably the best known example of a sub-energetic SNR. It has a well-defined shell-like morphology in radio (Roger & Costain 1976; Landecker et al. 1999, hereafter L99) and is extremely faint in X-ray (L99). It is one of the rare SNRs observed at high Galactic latitudes: only 7 of 265 Galactic SNRs have in the Green Catalog 111Green D. A., 2006, ‘A Catalogue of Galactic Supernova Remnants (2006 April version)’, Astrophysics Group, Cavendish Laboratory, Cambridge, United Kingdom (available at “http://www.mrao.cam.ac.uk/surveys/snrs/”).; the other 6 are all well-known nearby SNRs, typically with large angular sizes. X-ray emission from DA 530 was first reported by L99, based on an 8-ksec ROSAT PSPC observation. This observation shows that the remnant has a centrally-filled X-ray morphology and a total luminosity of ergs/s in the 0.12-2.4 keV band (assuming a distance of kpc). But the very limited counting statistics and energy/spatial resolutions of the observation did not allow for any tight constraints on the thermal properties of the SNR. Nevertheless, L99 suggested that DA 530 is probably created by a sub-energetic Type Ia SN in a very tenuous ambient environment. The total estimated X-ray-emitting gas mass is only about 4. Based on 21-cm HI data, Foster and Routledge (2003) later improved the distance estimate to be kpc (adopted hereafter), which would reduce the X-ray luminosity and the gas mass. L99 further argued that the low ambient density is probably a result of a preexisting stellar wind bubble indicated by the presence of a “necklace”-like HI shell located at the outer boundary of the radio continuum shell. A Type Ia SN scenario is proposed because of the remnant’s relatively large vertical height (264 pc) above the Galactic plane; but paradoxically, the presence of the wind bubble is indicative of a massive progenitor (L99). DA 530 is so far not detected in infrared and optical, consistent with a relatively low density environment expected at this vertical height. Kaplan et al. (2004) did not find any suitable candidates for a potential stellar remnant of DA530 from a Chandra ACIS-I observation and optical/IR follow-ups. No pulsed emission has been detected in DA 530 (Lorimer, Lyne & Camilo 1998).
In this paper, we report a re-analysis of the same Chandra observation as obtained by Kaplan et al. (2004). Our initial motivation is to understand why DA530 is so faint in its X-ray emission, as shown in the ROSAT study. If indeed a remnant of a Type Ia SN, it is expected to show enhanced iron lines in the Chandra X-ray spectrum. While we find no indication for this enhancement, our analysis (§ 2) leads to several quite unexpected results, which are presented in § 3. In § 4, we discuss the implications of these results on the nature of the SN and its environment. We quote statistical error bars at the 90% confidence level throughout this work.
2 Observation and Data Reduction
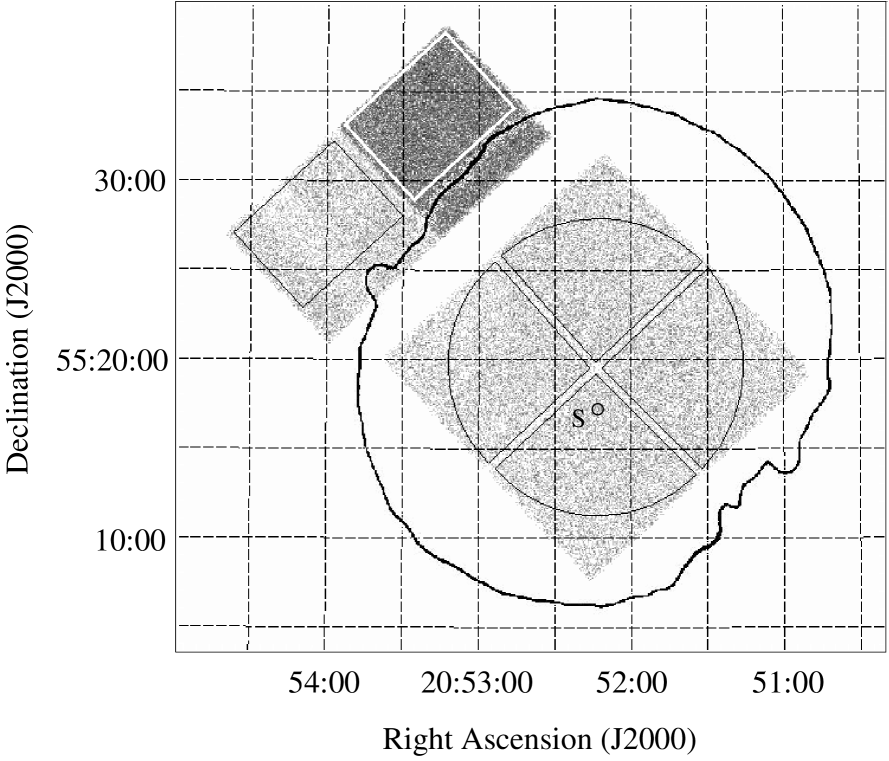
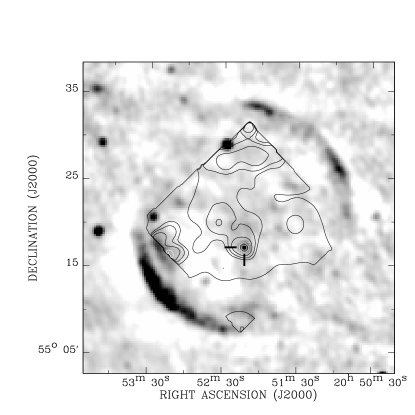
The Chandra ACIS-I observation of DA 530 was performed on 17 December 2001 in a faint mode (Obs. ID 2808). The target center (, ) was placed at the aiming point of the I3 chip. We reprocessed the data using the Chandra Interactive Analysis of Observations (CIAO) software package (version 3.2.2), following the ACIS data analysis guide. The lightcurve of the observation indicates no significant background flares and the effective exposure is 16.4 ks. The Chandra field of view (FoV) is shown in Fig. 1, in comparison with DA 530’s extent in radio continuum.
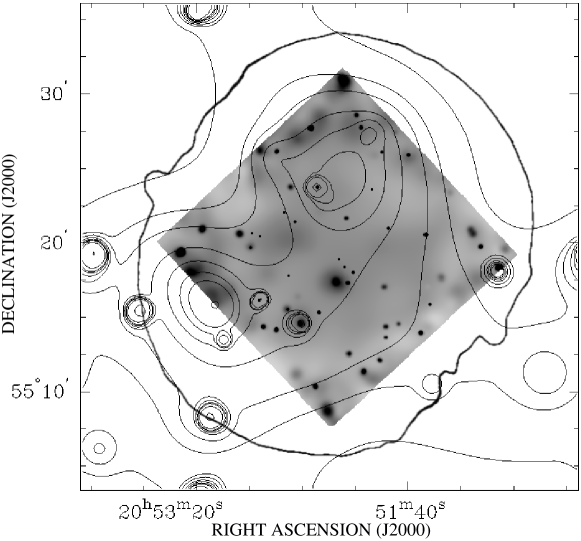
For imaging analysis, counts images and exposure maps are generated in the four bands: (S1), (S2), (H1), and (H2) keV. We subtract the non-X-ray contribution, using the ACIS stowed background database 222available at http://cxc.harvard.edu/contrib/maxim/acisbg/. All the data are corrected for CTI and gain variations. The Chandra 0.5-8 keV intensity image is shown in Fig. 2. Since ACIS-I chips do not cover the entire field of DA 530, we also show ROSAT PSPC intensity contours for comparison.
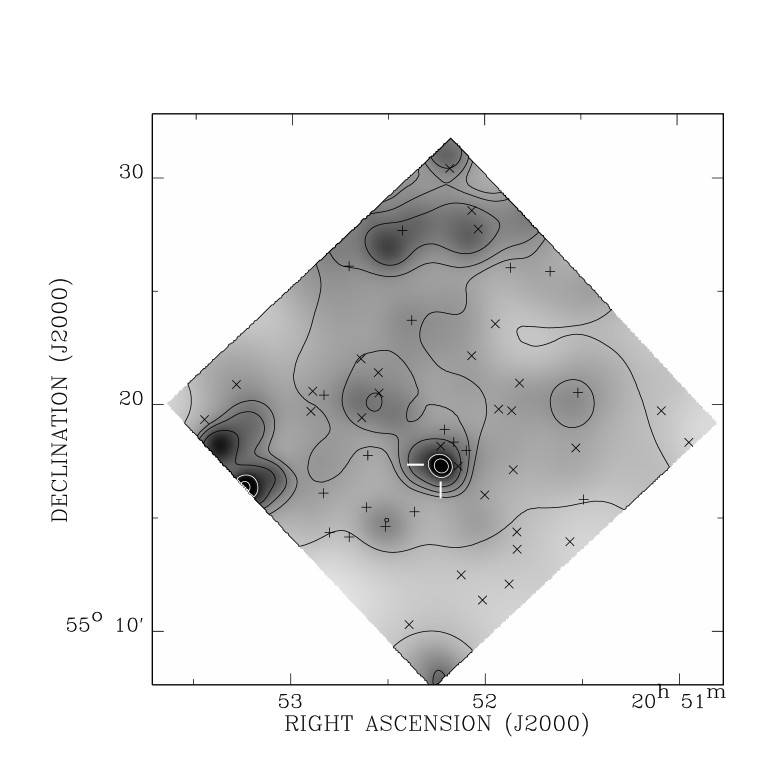
Our main interest here is the diffuse emission from the remnant’s interior. Thus we need to subtract the irrelevant point sources from the image. The source detection by Kaplan et al. (2004) is designed for finding the putative neutral star with a select criteria of counts and within only radius from the center of the remnant. Following the procedures detailed in Wang (2004), we search for discrete sources over the entire FoV of the I-array in the soft (S=S1+S2), hard (H=H1+H2) and broad (S+H) bands. The detection is based on a combined set of algorithms: wavelet, sliding box, and maximum likelihood centroid fitting, which are optimized for detecting point-like sources. The map detection and the maximum likelihood analysis use a detection aperture of the 70% energy-encircled radius. The threshold of the local false detection probability is , based on the Poisson statistics. We detect all the 18 sources listed in Kaplan et al. (2004), plus 30 additional ones, which are all marked in Fig. 3.
To study the diffuse X-ray emission, we remove from the data a circle of 1.5 times the detection radius for each source. We then produce a broad band (H) intensity image of the diffuse X-ray emission (Fig. 3).
3 Data Analysis and Results
The PSPC image contours show a clear enhancement of the “diffuse” X-ray intensity in the field of DA 530 and exhibits no indication for any rim-brightening associated with the outer radio shell (Fig. 2; L99). Using the NED/SIMBAD database, we find that all the bright point sources around the rim are background sources (L99). The ACIS-I image further reveals a faint large-scale diffuse emission in the interior (Fig. 3). The morphology appears to be centrally-filled with clumps of enhancements.
3.1 Diffuse emission
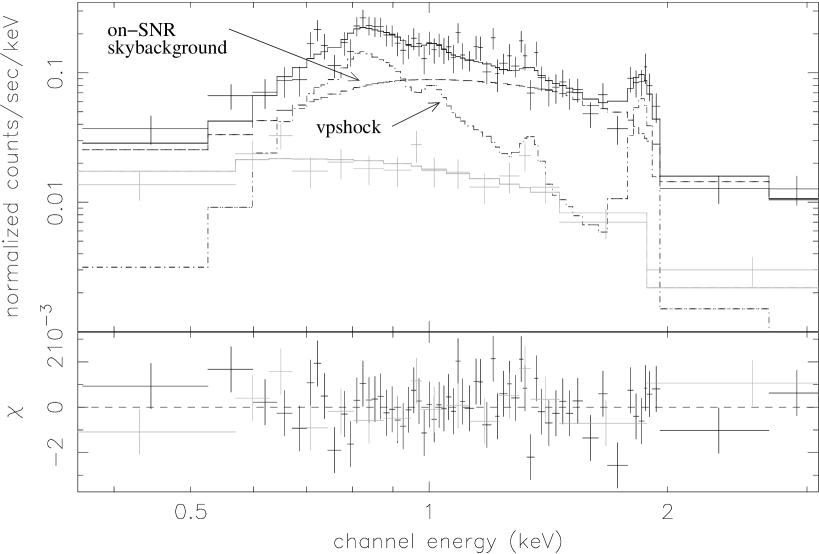
We perform a spectral analysis of the large-scale diffuse X-ray emission associated with DA 530 using the Chandra observation. We extract the on-SNR spectrum from the four sectors (radius ) on the ACIS-I chips, which are projected entirely within the boundary of the SNR, and the off-SNR spectrum from the two rectangular regions on the ACIS-S2 and S3 chips (see Fig. 1). We subtract from the on- and off-SNR spectra the respective non-X-ray background contributions estimated from the same regions. After being adaptively grouped to achieve a in each bin, the two spectra are jointly fitted (see Fig. 4), in which the on-SNR sky background is determined by the fit to the off-SNR spectrum, which is well described by a power-law with a photon index . This double background subtraction method accounts for the position dependence of the background, effective area, and energy response of the instruments. Although the counting statistics of the data are limited, the on-SNR spectrum with a net background-subtracted count rate of counts shows a distinct Si He ( keV) line. The feature at keV may represent the He-like Mg K line, but this line is too weak to be certain.
The net on-SNR spectrum of the diffuse X-ray emission is well characterized with a non-equilibrium ionization thermal plasma model (vpshock in XSpec). We present in Table 1 the fit results with or without fixing the column density to , an estimate of the total column density based on observations of atomic and molecular gas in the field (L99). This independent estimate represents an upper limit to the true X-ray absorption column density along the sight line to DA 530, depending on its distance. If the remnant is indeed at the distance of kpc (or 300 pc above the Galactic plane), beyond the bulk of the neutral gas disk, the estimate should be close to the true absorption column density. The column density from the direct fit to the X-ray spectrum is, however, considerably smaller than the estimate, which may indicate that the remnant is much closer than the adopted distance. But there are uncertainties in the X-ray data calibration (e.g., background subtraction) and modeling. We hence present the results based on these two different absorption column density estimations. There is no significant evidence for an enrichment in Fe (a fit indicates an iron abundance close to the solar value), while the abundance of Si is clearly super-solar. The large ionization parameter ( s) indicates that the plasma is close to the collision ionization equilibrium. An equilibrium ionization plasma model (vmekal) is then applied and the fitted parameters, as well as the confidence ranges, are similar to those from vpshock.
3.2 The central extended hard X-ray feature
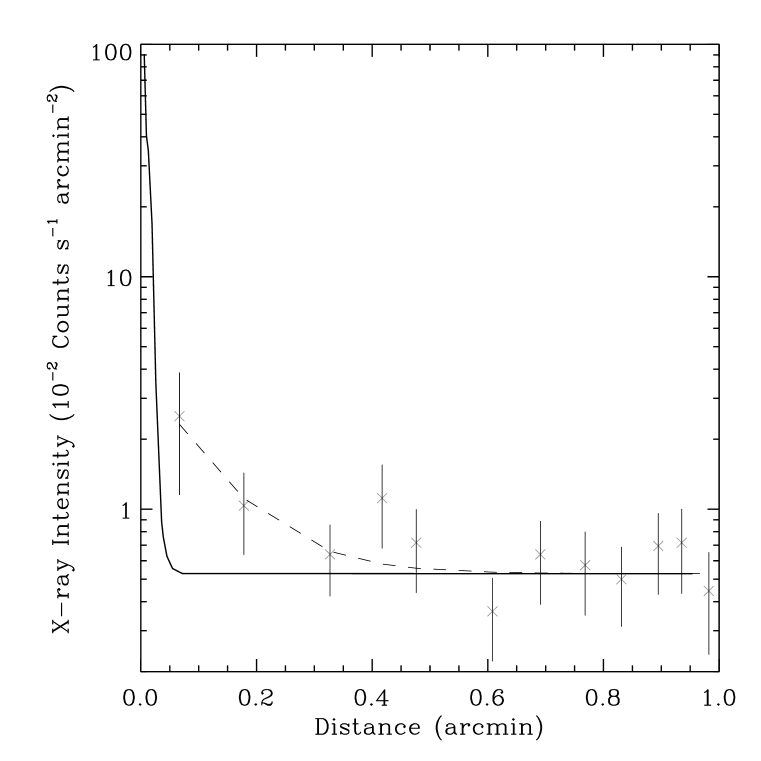
Fig. 3 shows a remarkable small-scale X-ray feature at , , near the center of the remnant. This central feature is present chiefly in the range of keV. The radial intensity profile of the feature (Fig. 5) clearly shows that it is an extended source. A fit with an exponential function () plus a local background gives a scale-length of . We further extract a spectrum of the feature (Fig. 6) in a circle of radius (marked with “S” in Fig. 1), which includes about 96% net counts according to the best-fit exponential function. The total number of counts in 0.3-7 keV band is 50, compared to a local background contribution of 24 counts, estimated from an annulus between to around the feature. Therefore, the significance of the feature above the local background is 5.3. Accounting for the overall FoV () of the ACIS-I and the size ( radius) of the feature, the statistical probability for it to be due to the random fluctuation of the background is on the order of . Of course, there are systematic effects (e.g., the non-uniformity of the diffuse emission; see §4.1 for further discussion), which cannot be adequately quantified here. Indeed, there are a few other peaks in Fig. 3. But they are all at large off axis angles and may at least partly due to confusions among adjacent weak sources because of the large PSF. No peak in the central region has a significance close to the above feature or is associated with a radio source (§ 4.1). We conclude that the feature is most likely real and is truly extended.
With the very limited counting statistics, the spectrum of the feature (after the local background subtraction) can be well fitted with a variety of models, assuming the hydrogen column density of . For example, the power-law model gives a photon index of and an unabsorbed flux of . Alternatively, an optically-thin thermal plasma would indicate a temperature keV, substantially higher than that found for the surrounding diffuse X-ray emission ( keV; Table 1). With a lower value assumed (e.g. ), the temperature would be even higher, while the photon index in the power-law model would be smaller () with nearly the same unabsorbed flux.
The central extended hard X-ray feature is not seen in the ROSAT PSPC observation, which had a low spatial resolution and was sensitive only to X-rays below . The feature was also not detected in the ACIS observation, based on the CIAO wavdetect program with a maximum wavelet scale of (Kaplan et al. 2004). However, with larger scales of 32, 64, 128 pixels, we do detect the feature, using the same program.
4 Discussion
We now discuss the implications of the above results, together with those from previous studies.
4.1 Pulsar Wind Nebula Candidate
We have shown the evidence for the presence of a central extended X-ray feature in DA 530. This feature is characterized by an angular extent of and a hard spectrum. This hard X-ray feature, with its small extent, could conceivably represent a distant () cluster of galaxies projected in the field. However, such clusters are very rare (only X-ray-emitting clusters have been detected at ; Stanford et al. 2006). The observed spectrum (Fig. 6) also seems to be a too hard to be consistent with the expected relatively steep (after the redshift) thermal emission from the intracluster medium. Alternatively, the feature might just be an enhancement of the X-ray emission from DA 530 due to a density increase, for example. But assuming a rough pressure balance, one would expect that such density enhancement tends to have a lower temperature than the surrounding, inconsistent with the hard spectrum of the feature (§3.2).
We propose that the hard X-ray feature most likely represents a pulsar wind nebula (PWN). This interpretation naturally explains the location near the center of DA 530, the spatial extension, and the apparently hard spectrum. In this case, the X-ray emission represents the synchrotron radiation from relativistic electrons/positrons in the nebula. The observed spectrum in particular, characterized by a power law with the photon index , is consistent with the typical range for a PWN (Gotthelf 2003; Gaensler & Slane 2006).
The PWN scenario of the X-ray feature is further supported by its positional coincidence with an extended radio source. It is detected in the 1.4 GHz NRAO VLA Sky Survey (Condon et al. 1998; Fig. 7) and is listed as “J205213+551721” in the online database (http://www.cv.nrao.edu/nvss/NVSSlist.shtml). Fig. 7 also includes a radio image of DA 530, extracted from the 325 MHz Westerbork Northern Sky Survey (Rengelink et al. 1997) with a radio intensity enhancement apparent at the source position. The source is also present in the 408 MHz and 1.42 GHz continuum maps of DA 530 (L99). The radio fluxes of the source are mJy at 325 MHz and mJy at 1.4 GHz, which give an approximate estimate of the power law spectral slope as , comparable to the typical value of known PWNe. But sensitive radio observations with a higher spatial resolution is needed to further the test of the PWN scenario. No obvious optical or near-IR counterpart is found within a few arc-seconds around the centroid of the X-ray feature. This is expected for the PWN interpretation. The extension of the radio source (, deconvolved FWHM source sizes in NVSS Source catalog) is larger than that of the X-ray feature. This is consistent with the short synchrotron cooling time scale of the X-ray-emitting particles.
Of course, the PWN nature of the X-ray feature and the radio peak can be established only when pulsed radiation is detected. While such radiation has not been observed, either due to the limited sensitivity of the existed radio searches (Lorimer et al. 1998) or to the possibility that the pulsed radiation is beamed away from the Earth, we proceed here with the hypothesis that the X-ray/radio feature represents a PWN in DA 530.
Using the empirical relationship given for PWNe (Seward & Wang 1988) and the 0.2-4 keV luminosity of the feature ( ergs s-1 obtained from the spectral analysis), we infer the spin-down power of the putative pulsar as . According to the estimated of 17 pulsars in 2-10 keV (Gotthelf 2004) the ratio seems to be around 1 among the pulsars with low . Then the X-ray luminosity for the pulsar will be . The deduced values, both the X-ray luminosity and , are much smaller than that of other PWN/PSR systems (Gotthelf 2003, 2004). However, the pulsar PSR B1929+10 has an even smaller luminosity () and ) with its faint nebula () (Wang, Li & Begelman 1993; Yancopoulos, Hamilton & Helfand 1994; Becker et al. 2006).
4.2 Energetics of the SNR
From the results on the diffuse X-ray emission associated with DA 530 (Table 1), we estimate various physical parameters of the hot gas enclosed in DA 530 (Table 2). The estimation of the total mass () and mean density () of the X-ray-emitting plasma is based on the volume emission measure (Table 1) and the remnant’s radio size ( pc). A volume filling factor () of the hot gas is included. The mass estimation adopts a correction factor of 2, accounting for the partial spatial field of the on-SNR spectrum within the radio shell. This correction assumes no particular enhancement associated with the rims of the remnant, as indicated by the PSPC observation. We also estimate the total Si mass (MSi) and thermal energy () of the hot gas, using the abundance and temperature values from the spectral fits.
We may further infer the age and explosion energy of DA 530 by applying the canonical Sedov (1959) blastwave model. If the temperature measured from the vpshock model is adopted as the post-shock temperature , we can then estimate the blastwave velocity , the dynamic age and the explosion energy (see Table 2), where the mean atomic weight , is the mass of a hydrogen atom, and is the pre-shock medium mass density which is assumed to approximately be the mean swept-up gas density. The low temperature ( keV) of the gas is consistent with the inferred relatively large age () of the remnant. The explosion energy is very low , about two orders of magnitude lower than the nominal value () of a SN. Of course, in the Sedov solution; the ACIS-I field covers a combination of the remnant’s physical interior and projected outer shock regions. In the Sedov phase, the inner gas is hotter than the outer gas (i.e., ). Therefore, the above estimates represent the upper limits to the thermal and explosion energies and the lower limit to the age. Considering the uncertainty on distance ( kpc), if the remnant is closer than 2.2 kpc, the mass, age, and energy would be even smaller than the values we obtained here; if we take the high end of the distance (2.7 kpc), these parameters would be scaled up a bit,at most with a factor of , which would not dramatically affect the final results. Furthermore, the forward shock may have already entered a radiative phase (i.e., K), consistent with the lack of significant rim-brightened X-ray emission (L99; § 3). This requires the pre-shock density , i.e., , where is the explosion energy in units of . An age of yr is then expected in this case. Since the preshock gas density may be similar to the mean density of the hot gas inside the SNR (, Table 2), should then be smaller than ergs. In conclusion, the SN responsible for DA 530 appears to be sub-energetic.
4.3 X-ray Morphology
The X-ray results from both ROSAT and Chandra suggest that DA 530 is a so-called thermal composite/mixed-morphology SNR. Whereas the radio continuum emission shows a well-defined shell-like structure, there is little evidence for any associated enhancement in X-ray. This lack of the X-ray emission associated with the forward shock is consistent with the large ionization timescale of the remnant interior and low temperature, as discussed above.
The formation mechanisms for thermal composite SNRs in general are still very much uncertain (e.g., Shelton et al. 2004; Chen et al. 2004; Kawasaki et al. 2006). These SNRs most likely represent a heterogeneous population, depending on the ambient medium density distribution as well as the remnant ages. Known thermal composites tend to be in dense environments (see Table 7 in Lazendic & Slane 2006). This may partly be due to observational selection effects, because such remnants tend to be brighter. With more sensitive observations, fainter ones have been detected in less dense environments (Lazendic & Slane 2006). None of the proposed mechanisms (e.g, evaporation of clouds, thermal conduction effect, and ejecta enrichment) seem to give satisfactory explanations for the observed properties of such thermal composites. This is even more difficult for DA 530, which appears to represent an extreme case. DA 530 seems to belong to the group of thermal composites that show enhanced metal abundances in their interior. The number of such remnants is now up to of the total thermal composites (Lazendic & Slane 2006). Detailed studies of the abundances and their distribution are needed to investigate their effect on the central brightness.
We find that the morphology and other X-ray properties of DA 530 can be explained if the SN ejecta were thermalized early from the interaction with a dense circum-stellar medium (CSM). Without this early thermalization, the current low density would not be consistent with the large of the interior hot gas (Table 1). The required average density needs to be as high as for an age of 5000 yr. Such a high density can probably only be realized in a dense CSM surrounding the progenitor. The required total mass of the CSM does not need to be very high (e.g., a few ), since the ejecta mass should be small as indicated by the low hot gas mass (Table 2). Similar phenomena are also found in the LMC SNRs DEM L238 and DEM L249 (Borkowski et al. 2006).
4.4 Nature of the Explosion
Let us now examine what SN progenitor may have the inferred properties: 1) the production of a pulsar, 2) the low mechanical energy and ejecta mass, and 3) the presence of a dense CSM. A pulsar may be produced in a core-collapsed (CC) SN of a star with a main-sequence mass , an accretion-induced collapse (AIC) of a white dwarf, or a merger-induced collapse (MIC) of two white dwarfs with a combined mass greater than the Chandrasekhar mass. The latter two scenarios, though plausible, may work only for white dwarfs with O/Ne/Mg cores and with fine-tuned accretion rates. The expected explosion rate is low in the Galaxy (e.g., Saio & Nomoto 1985; King et al.2001). Also no dense CSM is expected from the progenitor of an AIC or MIC SN. While a wind may be present during the accretion, it is expected to be as fast as 1000 - 1500 (Hachisu & Kato 2003), producing no dense CSM. We thus consider the massive star CC SN to be the most probable scenario for DA 530. In this case, the CSM can naturally arise from a massive slow wind in a post-main sequence evolutionary stage (e.g., red supergiant). Such a CC SN typically yields a mechanical energy of , empirically. As mentioned in § 1, this empirical expectation may be strongly biased. Type II-P SNe such as 1997D have been observed to be sub-energetic events (Zampieri et al. 2003, Pastorello et al. 2004). There are two plausible progenitor models for them, a massive star (e.g. for SN 1997D), which is likely accompanied by the formation of a black hole (Zampieri et al. 1998), and an intermediate-mass star () (Chugai & Utrobin 2000; Smartt et al. 2004). When examining the two models, we found that SNRs Crab and 3C58 may have provided proper evidence for the nature of the DA530 case. Both the plerionic SNRs were observed to have pre-SN mass loss or the CSM and their kinetic energy is (Rudie & Fesen 2007), much lower than the canonical and similar to the value obtained in DA 530. Such subenergetic SNRs are suggested to result from the “electron capture” SNe, which are thought to be the end stage of intermediate mass stars (8–12), because the SNe collapse with timescales determined by electron capture rate rather than dynamical timescale and thus the released kinetic energy is lower (Nomoto 1987; Rudie & Fesen 2007). On the other hand, recent hydrodynamic simulations incoporating electron capture also show that CC SNe of stars in the mass range of with O-Ne-Mg cores can be substantially sub-energetic (Kitaura et al. 2006). Therefore, in view of the small ejecta mass (Table 2), the pre-SN CSM, the low explosion energy, and the presence of the PWN (hence the presence of a neutron star), we favor the low mass CC explosion for DA 530.
The interpretation of an 8–12 main-sequence progenitor for the DA 530 SN is also consistent with the observed pre-existing stellar wind bubble (L99). Before evolving to the red supergiant stage, the star is expected to undergo a fast stellar wind period with a mass loss rate of (Snow 1982), which can naturally lead to the formation of a surrounding stellar wind bubble. A wind bubble can reach a stall radius: pc, where is the wind luminosity in units of , is the undisturbed ambient interstellar medium density, and is the isothermal sound speed of the medium in units of (eg., Brighenti & D’Ercole 1994). If is taken to be the H I “necklace” radius pc, then the stall time yr (assuming ), reasonably smaller than the lifetime of the progenitor. From , we require , where is the velocity of the stellar wind. The wind power of a 8–12 main-sequence progenitor is high enough to generate such a bubble.
In short, we have constructed a plausible scenario for DA 530. The progenitor could be a star with its main-sequence progenitor mass in the range of 8–12 . The fast wind in the main-sequence stage produces a wind bubble ( pc), which is responsible for the observed HI “necklace”-like structure. The massive slow wind in the later red supergiant stage generates a dense CSM, which explains the large ionization time scale of the interior hot gas. The SN apparently has a substantially low mechanical energy and a small ejecta mass and leaves a neutron star as the stellar remnant.
If DA 530 indeed represents a typical SNR produced by stars in the main-sequence mass range of , we should then expect a substantial number of similar remnants in the Galaxy; stars in this mass range account for about one quarter of the total number of stars with masses (assuming the Salpeter initial mass function) for which CC SNe are expected. Because of the sub-energetics of these remnants, they are generally difficult to detect. Possible known candidates include the Crab Nebula (Nomoto et al. 1982) and VRO 42.05.01 (G166.0+4.3, Burrows & Guo 1994) at relatively high Galactic latitudes, 3C 58 (Rudie & Fesen 2007), and those low-surface brightness SNRs at low latitudes (Bamba et al. 2003). Those latter SNRs show primarily hard non-thermal X-ray emission, which can be understood if the soft thermal radiation from low temperature shock-heated gas has largely been absorbed by the intervening cool interstellar medium. Therefore, more detailed studies with improved data on high-latitude Galactic SNRs as well as those in the LMC are essential to the understanding of their true nature and their implications for the evolution of the Galaxy. Meanwhile, deeper observations in both radio and X-ray are needed for a detailed investigation of the PWN candidate of DA 530.
5 Summary and Conclusion
We have conducted the spatial and spectral analysis of the X-ray faint SNR DA 530, based chiefly on a Chandra ACIS-I observation. We have detected a small-scale, extended, hard X-ray feature near the remnant center. Its X-ray characteristics, as well as the spatial coincidence with a radio continuum emission peak, strongly suggests that the feature is a PWN associated with DA 530.
DA 530 appears to be a SNR with a well-defined radio continuum shell and an apparently centrally-filled thermal X-ray morphology, i.e. the so-called thermal composite SNR. The diffuse X-ray emission from the interior of the remnant is weak and shows spectral characteristics of an optically-thin thermal plasma over-abundant in silicon. The inferred low mass and energy in this plasma suggest that the explosion energy is . The near collisional ionization equilibrium of the plasma further suggests that the SN ejecta have been thermalized early in the evolution of the remnant, probably due to the presence of a dense CSM produced by the SN progenitor.
The presence of the PWN and the dense CSM, as well as the low explosion energy, suggest a stellar progenitor with a mass probably in the range of , consistent with the observed HI bubble (L99). As such, DA 530 provides evidence for a nearby sub-energetic SN, which generates a pulsar and a remnant both of X-ray faint.
References
- (1)
- (2) Bamba, A. Ueno, M., Koyama, K., & Yamauchi, S. 2003, ApJ, 589, 253
- (3) Becker, W., Kramer, M., Jessner, A., Taam, R. E., Jia, J. J., Cheng, K. S., Mignani, R., Pellizzoni, A., de Luca, A., Slowikowska, A., & Caraveo, P. A., 2006, ApJ, 645, 1421
- (4) Borkowski, K., Hendrick, S. P., & Reynolds, S. P. 2006, ApJ, 652, 1259
- (5) Brighenti, F.,& D’Ercole, A. 1994, MNRAS, 270, 65
- (6) Burrows, D. N., & GPO, Z. 1994, ApJ, 421, L19
- (7) Cash, W. 1979, ApJ, 228, 939
- (8) Chen, Y., Su, Y., Slane, P., & Wang, Q.-D. 2004, ApJ, 616, 885
- (9) Chugai, N. N., & Utrobin, V. P., 2000, A&A, 354, 557
- (10) Condon, J. J., Cotton, W. D., Greisen, E. W., Yin, Q. F., Perley, R. A., Taylor, G. B., & Broderick, J. J. 1998, AJ, 115, 1693
- (11) Feigelson, E., et al. 2002, ApJ, 574, 258
- (12) Foster, T., & Routledge, D. 2003, ApJ, 598, 1005
- (13) Gaensler, B. M., & Slane, P. 2006 ARA&A, 44, 17
- (14) Gotthelf, E. V. 2003, ApJ, 591, 361
- (15) Gotthelf, E. V. 2004, Young Neutron Stars and Their Environments, IAU Symposium no. 218
- (16) Hachisu, I., Kato, M., & Nomoto, K., 1996, ApJ, 470, 97L
- (17) Hachisu, I., & Kato, M. 2003, ApJ, 598, 527
- (18) Jha, S., Branch, D., Chormock, R., Foley, R. J., Li, W., Swift, B. J., Casebeer, D., & Filippenko, A. V. 2006, AJ, 132, 189
- (19) Kaplan, D. L., Frail, D. A., & Gaensler, B. M. 2004, ApJS, 153, 269
- (20) Kawasaki, M., Ozaki, M., Nagase, F., Inoue, H., & Petre, R. 2005, ApJ, 631, 935
- (21) King, A. R., Pringle, J. E., & Wickramasinghe, D. T. 2001, MNRAS, 320, L45
- (22) Kitaura, F. S., Janka, H.-Th., & Hillebrandt, W. 2006, A&A, 450, 345
- (23) Landecker, T. L., Routledge, D., Reynolds, S. P., Smegal, R. J., Borkowski, K. J., & Seward, F. D. 1999, ApJ, 527, 866 (L99)
- (24) Lazendic, J. S., & Slane, P. O. 2006, ApJ, 647, 350
- (25) Lorimer, D. R., Lyne, A. G., & Camilo, F. 1998, A&A, 331, 1002
- (26) Nomoto, K., Spars, W.M., Fesen, R.A., et al. 1982, Nature, 299, 803
- (27) Nomoto, K., 1987, ApJ, 322, 206
- (28) Pastorello, A., Zampieri, L., Turatto, M., Cappellaro, E., Meikle, W.P.S., Benetti, S., Branch, D., Baron, E., Patat, F., Armstrong, M., Altavilla, G., Salvo, M., & Riello, M. 2004, MNRAS, 347, 74
- (29) Roger, R. S., & Costain, C. H. 1976, A&A, 51, 151
- (30) Rengelink, R.B., Tang, Y., A.G. de Bruyn, Miley, G.K., Bremer, M.N., R篓ttgering, H.J.A., & Bremer, M.A.R., 1997, A&A Supplement Ser., 124, 259
- (31) Rudie, G. C, & Fesen, R. A., 2007, astro-ph/0704.2780
- (32) Saio, H., & Nomoto, K. 1985, ApJ, 150, L21
- (33) Sedov, L. I. 1959, Similarity and Dimensional Methods in Mechanics (New York: Academic)
- (34) Seward, F. D. & Wang, Z.-R. 1988, ApJ, 332, 199
- (35) Shelton, R. L., Kuntz, K. D. & Petre, R. 2004a, ApJ, 611, 906
- (36) Smartt, S. J., Maund, J. R., Hendry, Margaret, A., Tout, C. A., Gilmore, G. F., Mattila, S., & Benn, C. R., 2004, Science, 303, 499
- (37) Snow, T.P.Jr. 1982, ApJ, 253, L39
- (38) Stanford, S. A., Romer, A. K., Sabirli, K., Davidson, M., Hilton, M., Viana, P. T. P., Collins, C. A., Kay, S. T., Liddle, A., R., Mann, R. G., Miller, C. J., Nichol, R. C., West, M. J., Conselice, C., J., Spinrad, H., Stern, D., Bundy, K., 2006, ApJ, 646, L13
- (39) Wang, Q. D. 2004, ApJ, 612, 159
- (40) Wang, Q. D., Li, Z. Y., & Begelman, M. C., 1993, Nature, 364, 127
- (41) Yancopoulos, S., Hamilton, T. T., & Helfand, D. J., 1994, ApJ, 429, 832
- (42) Zampieri, L., Pastorello, A, Turatto, M., Cappellaro, E., Benetti, S., Altavilla, G., Mazzali, P., & Hamuy, M. 2003, MNRAS, 338, 711
- (43)
| parameter | free | fixed |
|---|---|---|
| () | ||
| (keV) | ||
| [Si/H] | ||
| () | ||
| ()b | ||
| () | ||
| d.o.f | 73/72 | 83/73 |
Note. — Based on the spectral fits to the interior diffuse X-ray emission of DA 530 with an absorbed vpshock model. Parameter errors are quoted at the 90% confidence.
| parameter | free (1.5) | fixed |
|---|---|---|
| ()a | ||
| M | ||
| M | ||
| () | ||
| (ergs) | ||
| (ergs)b | ||
| ()b |
Note. — The parameters are estimated from the spectral fit results in Table 1. Errors are propogated from the confidence ranges of the temperature, the abundance, and the emission measure.