Characteristic Energy of the Coulomb Interactions and the Pileup of States
Abstract
Tunneling data on crystals confirm Coulomb interaction effects through the dependence of the density of states. Importantly, the data and analysis at high energy, E, show a pileup of states: most of the states removed from near the Fermi level are found between and 130 meV, from which we infer the possibility of universal behavior. The agreement of our tunneling data with recent photoemission results further confirms our analysis.
pacs:
71.20.-b,71.55.Ak,71.27.+aCoulomb interactions (CI’s) between electrons can play a dominant role in strongly correlated systems and metal-to-insulation transitions. These include Mott insulators, complex oxidesHigashiya et al. (2007); Rienks et al. (2007); Sarma et al. (1998), colossal magnetoresistive materialsMitra et al. (2003), and other novel metallic materials like grapheneDas Sarma et al. (2007). Coulomb interactions have also been studied as a possible mechanism of the pseudogapEmery and Kivelson (1995); Maly et al. (1996); Millis (2006) in the density-of-states (DOS) of high-temperature superconductors. The Coulomb repulsion pushes some states near Fermi level, , to higher energies, as described by Al’tshuler and Aronov (AA) Altshuler and Aronov (1985). Despite years of study, however, the essential implication of the theory, the conservation of states, has never been shown. In superconductivity most of the states depleted from pile up just above the energy scale gap, , but a few extend out as far as several times the Debye energy. The only upper limit for CI’s is the band edge, but one may anticipate that most states will pile up just above some characteristic energy scale (see right-hand inset of Fig. 1).
The AA theory predicts the energy dependence for the DOS of correlated 3D metals to be for low energy, E, measured relative to , and this dependence was confirmed by several tunneling studiesMitra et al. (2003); Sarma et al. (1998); Dynes and Garno (1981); McMillan and Mochel (1981). Photoemission spectroscopy (PES) showed a depressed spectral weight in metallic perovskitesSarma et al. (1998) near , and recently the dependence was observedKobayashi et al. (2007) in PES spectra of . Our measurements on bilayer manganite single crystals, (LSMO) for x=0.36, complement all these studies by also addressing conservation of states, a fundamental feature of electron-electron correlations, which has not been addressed in the literature to date.
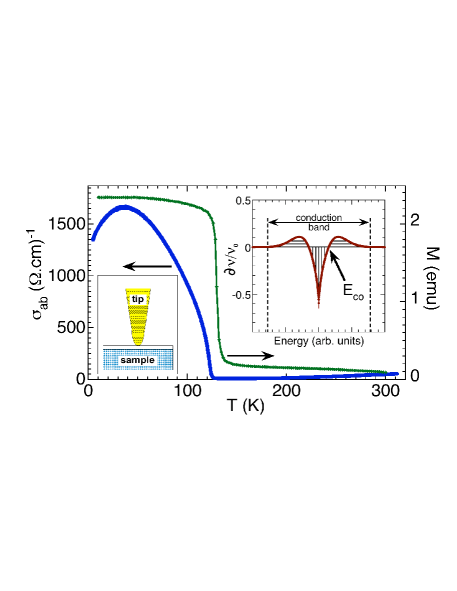
Certain properties of LSMO make it ideal to study CI’s. Low-temperature LSMO conductivity data (see Fig. 1) exhibit a dependence that is consistentOkuda et al. (1999) with AA theory. The bilayered LSMO is a strongly correlated system, which is readily cleaved along the crystal -plane. This enabled detailed Fermi surface studies using angle-resolved photoemission (ARPES), which showSun et al. (2006); Mannella et al. (2005) renormalized Fermi velocities, , of 13 cm/s and electron scattering times, , of 57 fs. Such small values define a poor metal, and one might expect them to be due to CI’s in the DOS, .
The effects of electron correlations on , are directly observable in the tunneling conductance, G(V). A systematic analysis of the tunneling data yielded the values of , and an observation of a pileup of states within 23 times a characteristic energy in analogy with superconductivity. Extracted values of and agree with the published ARPES results, and they are consistent with an intuitive model that estimates , effectively verifying that model.
Our tunneling data were taken on cleaved crystals of (i.e., x=0.36) at low temperatures, where they are metallic. Crystals were melt-grownMitchell et al. (1997) in an optical image furnace. The LSMO (x=0.36) crystals were characterised by measuring the temperature-dependent magnetization, , as displayed in Fig. 1 (conductivity data are from a different crystal). Crystals (110.5 mm3) were cleaved in air along the easy -plane, immediately mounted in the cryostat and cooled down to 4.2 K. Then the gold tip was brought into contact with the cleaved -axis-normal crystal face to create junctions. Details of the apparatus are described elsewhereOzyuzer et al. (1998).
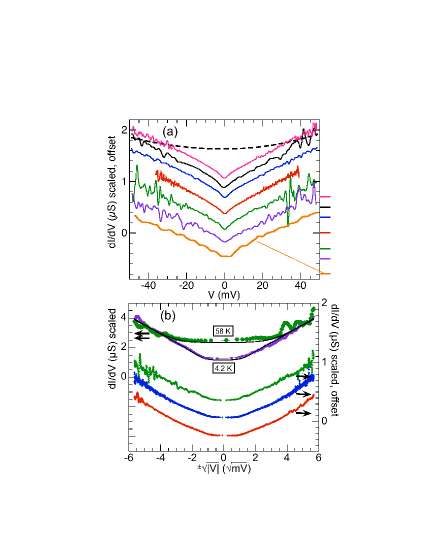
For coherent tunneling, the reduced density of states, is G(V)/G0(V) in the low temperature limit, where G0(V) is the barrier conductance that is independent of interaction effects and is approximately constant for barrier height, V. In Fig. 2a we present low-bias, G(V)dI/dV, for several junctions measured at 4.2 K. The data are scaled and offset (bars on the right show zeros for each curve) to show the excellent reproducibility of the zero-bias cusp feature across two orders of magnitude of junction resistances. These curves have the approximate shape expected from the DOS effect of electron-electron interactions, , as can be seen in the plot of Fig. 2b versus that shows an extended linear region from 210 mV. However, our G(V) data represent the DOS convoluted with the barrier conductance G0(V), which must be determined. A parabolic approximation to G0(V) (see procedure below) is shown for the topmost G(V) dataset of Fig. 2a.
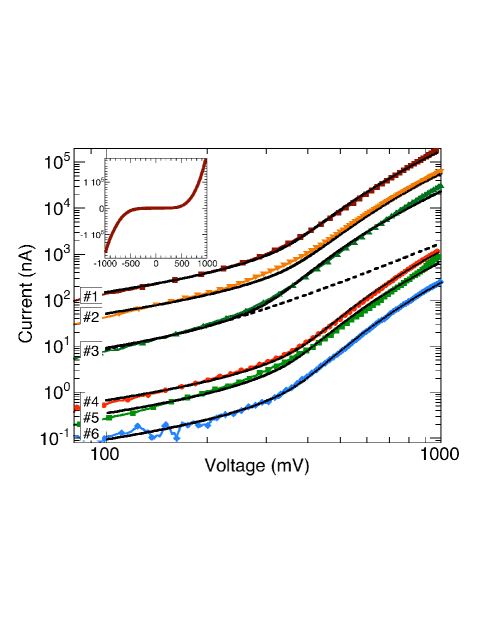
Comparing our I(V) data with the WKB approximation allows us to prove that tunneling is their origin, to determine the barrier height and width, and to justify the parabolic approximation to G0(V). Freeland et al.Freeland et al. (2005) discovered that a non-ferromagnetic, insulating bilayer occurs naturally on the surface of LSMO (x0.40) crystals and the extended I(V)’s shown in Fig. 3 for x0.36 closely follow the earlier data. The reasonable agreement over four orders-of-magnitude of current and three orders-of-magnitude of nominal junction resistance shown in Fig. 3 confirms that tunneling is the primary conductance mechanism. Using the collected results of over 50 junctions we determine that =280380 meV and t0=1.11.8 nmfno (b). The values of reasonably approximate the full first surface bilayer thickness. Importantly, the excellent agreement with WKB tunneling model implies a high quality, uniform tunnel barrier.
However, the data over the full range of V necessarily include the higher-voltage effects of barrier rounding by image forces, barrier changes due to electrostriction, etc. that cannot be captured by our simple two-parameter WKB calculation. Thus we approximate the WKB model at V with a parabolic correction to a constant conductance, that is a current-voltage form +, where V0 is the voltage shift of the parabola to account for a slight barrier asymmetryBrinkman et al. (1970). This approximation is shown by the dashed line in Fig. 3 and is within 3% precision for V0.7, imposing a justifiable upper limit of 230 mV for use of fno (c).
We have fit the to our data over a variety of voltage intervals within the range 0230 mV and found that the is essentially independent of the interval choice, when the limits lie within 130230 mV range. This is demonstrated in Fig. 4a, where we highlighted the difference between I(V) data and its ’s using the deviation curves, . The spread of the deviation curves is small and not systematic with the interval.
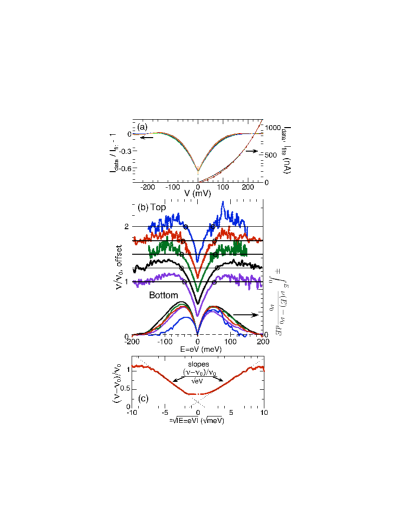
In the top part of Fig. 4b we present a series of G(V)/G0(V)= curves, and at the bottom of Fig. 4b we show the integral of the corresponding to the top curves. Depletion of states occurs in the rising part and pileup in the falling part of the integral curves. The curves show that states depleted near are recovered by 200 meV. However, we should consider only data below 130 meV (lower limit of fit intervals) as a reasonably reliable representation of the state recovery. The pileup of states in plots between and 130 meV accounts for 8020% of the states depleted below , with the remainder presumably extending out to the band edge as anticipated from the theory. The high-voltage noise, inherent to tunneling, could lead to the apparent asymmetry in the curves, but we have not detected a systematic asymmetry in the values. From data shown in Fig. 4b we determine experimentally the characteristic energy scale, , for the CI’s in LSMO (x0.36) and demonstrate that a most states pile up within a few , in close analogy to the well-known superconducting case.
The theories of interactions (AA) and quantum interferenceAbrikosov (2000) in quasi 2D metals in the low temperature limit, allow us to estimate the electron scattering time, , in LSMO. The can be found using Eqs. (2931) of Ref. Abrikosov (2000) as
| (1) |
where is the tight-binding coefficient for -axis transport, and refers to -plane Fermi energy. The last term in Eq. (1) is the square of the slopes of the linear regions of the plot vs. , see Fig. 4c. The parameters and were determined by quantum interferenceLi et al. (2000) as 2.9 and 0.15, respectively, for the bilayered LSMO (x0.40). The same experiment gave an estimate of the mean free path 1.4 nm. We have analyzed 20 junctions using the normalization procedure described above and Eq. (1). The resulting values of exhibited a Gaussian distribution, with =163 fs.
Using this result we can test another, intuitive approach to CI’s. If one considers the time limits on the diffusive motion of electrons in the same quasi 2D model as used aboveAbrikosov (1988), the result for small E is
| (2) |
where = is the quasi 2D electron diffusion coefficient. The crossover points (see Fig. 1 inset and Fig. 4b) between depleted states near and the pile-up at higher energies is defined by =. Then using from Eq. (1) we determine = from Eq. (2) and compare it with the experimental values shown in Fig 4b. The AA theory above predicts 418 meV, which matches with the values obtained from Fig. 4b, i.e., 3355 meV. This verifies the intuitive formula (2).
The theory of interactions has been developed as a perturbation theory for small corrections to the DOS, in the limit of 1, where = is the mean free path, and is Fermi wavelength. The DOS effect we present in Fig. 4 is not so small, and the stated assumption is barely satisfied, as =2.9. The values of determined by our analysis, therefore, are not rigorously correct. Nonetheless, they are in a reasonable agreement with recent ARPES resultsSun et al. (2006); Mannella et al. (2005). Using =16 fs and the 1.4 nm, we find a Fermi velocity, 107 cm/s. This is close to the published ARPES results, =13107 cm/s. Note that ARPES experiments measure the Fermi velocity along selected directions in the -space, whereas our tunneling experiment measures averaged over the -states, weighted by their contribution to tunneling.
In summary, we find that 80% of states near depleted by Coulomb interactions are found in the range of 40130 meV from . This presents an analogy with superconductivity, where a large fraction of depleted states reappear within two or three times the characteristic energy. However, the characteristic energies, , are not universal, e.g., they depend on in LSMO and on the energy gap, , in superconductors. Our analysis yields elastic scattering time, fs, and Fermi velocity, 107 cm/s, that are not too far from recently published ARPES results. We accomplished this by a consistent procedure to normalize the tunneling conductance. This appears to be the first experiment to address an essential implication of the AA theory of CI’s, the conservation of states.
Acknowledgements.
The authors would like to thank Dr. Konstantin Matveev for valuable consultations on the theory of Coulomb interactions. This research was supported by the US Department of Energy, Basic Energy SciencesMaterials Sciences under Contract No. DE-AC02-06CH11357 at the Argonne National Laboratory operated by UChicago Argonne, LLC.References
- Higashiya et al. (2007) A. Higashiya, S. Imada, A. Yamasaki, A. Irizawa, A. Sekiyama, S. Suga, Y. Taguchi, M. Iwama, K. Ohgushi, and Y. Tokura, Phys. Rev. B 75, 155106 (2007).
- Rienks et al. (2007) E. D. Rienks, N. Nilius, L. Giordano, J. Goniakowski, G. Pacchioni, M. P. Felicissimo, T. Risse, H.-P. Rust, and H.-J. Freund, Phys. Rev. B 75, 205443 (2007).
- Sarma et al. (1998) D. D. Sarma, A. Chainani, S. R. Krishnakumar, E. Vescovo, C. Carbone, W. Eberhardt, O. Rader, C. Jung, C. Hellwig, W. Gudat, et al., Phys. Rev. Lett. 80, 4004 (1998).
- Mitra et al. (2003) J. Mitra, A. K. Raychaudhuri, Y. M. Mukovskii, and D. Shulyatev, Phys. Rev. B 68, 134428 (2003).
- Das Sarma et al. (2007) S. Das Sarma, E. H. Hwang, and W.-K. Tse, Phys. Rev. B 75, 121406 (2007).
- Emery and Kivelson (1995) V. J. Emery and S. A. Kivelson, Phys. Rev. Lett. 74, 3253 (1995).
- Maly et al. (1996) J. Maly, K. Levin, and D. Z. Liu, Phys. Rev. B 54, R15657 (1996).
- Millis (2006) A. J. Millis, Science 314, 1888 (2006).
- Altshuler and Aronov (1985) B. L. Altshuler and A. G. Aronov, in Modern Problems in Condensed Matter Sciences, edited by A. L. Efros and M. Pollak (North-Holland, Amsterdam, 1985), vol. 10, pp. 1–154.
- Dynes and Garno (1981) R. C. Dynes and J. P. Garno, Phys. Rev. Lett. 46, 137 (1981).
- McMillan and Mochel (1981) W. L. McMillan and J. Mochel, Phys. Rev. Lett. 46, 556 (1981).
- Kobayashi et al. (2007) M. Kobayashi, K. Tanaka, A. Fujimori, S. Ray, and D. D. Sarma, Phys. Rev. Lett. 98, 246401 (2007).
- Okuda et al. (1999) T. Okuda, T. Kimura, and Y. Tokura, Phys. Rev. B 60, 3370 (1999).
- Sun et al. (2006) Z. Sun, Y.-D. Chuang, A. V. Fedorov, J. F. Douglas, D. Reznik, F. Weber, N. Aliouane, D. N. Argyriou, H. Zheng, J. F. Mitchell, et al., Phys. Rev. Lett. 97, 056401 (2006).
- Mannella et al. (2005) N. Mannella, W. L. Yang, X. J. Zhou, H. Zheng, J. F. Mitchell, J. Zaanen, T. P. Devereaux, N. Nagaosa, Z. Hussain, and Z.-X. Shen, Nature 438, 474 (2005).
- Mitchell et al. (1997) J. F. Mitchell, D. N. Argyriou, J. D. Jorgensen, D. G. Hinks, C. D. Potter, and S. D. Bader, Phys. Rev. B 55, 63 (1997).
- Ozyuzer et al. (1998) L. Ozyuzer, J. F. Zasadzinski, and K. E. Gray, Cryogenics 38, 911 (1998).
- Abrikosov (2000) A. A. Abrikosov, Phys. Rev. B 61, 7770 (2000).
- fno (a) Data collected in magnetic field up to 6 T show no change in the zero-bias anomaly.
- Freeland et al. (2005) J. W. Freeland, K. E. Gray, L. Ozyuzer, P. Berghuis, E. Badica, J. Kavich, H. Zheng, and J. F. Mitchell, Nature-Mater. 4, 62 (2005).
- fno (b) Fitting data using asymmetrical, trapezoidal barrier gave very similar curves with 050 meV.
- Brinkman et al. (1970) W. F. Brinkman, R. C. Dynes, and J. M. Rowell, J. Appl. Phys. 41, 1915 (1970).
- fno (c) The characteristic energy scale is 100 meV (using ARPES value of ). If state conservation occurs above 230 meV, the low-voltage parabolic fit of data would not go through the origin. That option gives a value of 0.1 that is far too small to be reconciled with the mild low-temperature decrease of the bulk conductivity (Fig. 1).
- Li et al. (2000) Q. Li, K. E. Gray, and J. F. Mitchell, Phys. Rev. B 63, 24417 (2000).
- Abrikosov (1988) A. A. Abrikosov, Fundamentals of the Theory of Metals (Elsevier Science Publishing B. V., Amsterdam, 1988).