Starbursts in the Local Universe: new HST/ACS observations of the irregular galaxy NGC 4449111Based on observations with the NASA/ESA Hubble Space Telescope, obtained at the Space Telescope Science Institute, which is operated by AURA, Inc., for NASA under contract NAS5-26555.
Abstract
We present photometry with the Advanced Camera for Surveys (ACS) on the Hubble Space Telescope (HST) of stars in the Magellanic starburst galaxy NGC 4449. The galaxy has been imaged in the F435W (B), F555W (V) and F814W (I) broad-band filters, and in the F658N (H) narrow-band filter. Our photometry includes 300,000 objects in the (B, V) color-magnitude diagram (CMD) down to V 28, and 400,000 objects in the (V, I) CMD, down to I 27 . A subsample of 200,000 stars has been photometrized in all the three bands simultaneously. The features observed in the CMDs imply a variety of stellar ages up to at least 1 Gyr, and possibly as old as a Hubble time. The spatial variation of the CMD morphology and of the red giant branch colors point toward the presence of an age gradient: young and intermediate-age stars tend to be concentrated toward the galactic center, while old stars are present everywhere. The spatial variation in the average luminosity of carbon stars suggests that there is not a strong metallicity gradient ( dex). Also, we detect an interesting resolved star cluster on the West side of the galaxy, surrounded by a symmetric tidal or spiral feature consisting of young stars. The positions of the stars in NGC 4449 younger than 10 Myr are strongly correlated with the H emission. We derive the distance of NGC 4449 from the tip of the red giant branch to be Mpc. This result is in agreement with the distance that we derive from the luminosity of the carbon stars.
1 Introduction
Starbursts are short and intense episodes of star formation (SF) that usually occur in the central regions of galaxies and dominate their integrated light. The associated star-formation rates (SFR) are so high that the existing gas supply can sustain the stellar production only on timescales much shorter than a cosmic time ( Gyr).
The importance of the starburst phenomenon in the context of cosmology and galaxy evolution has been dramatically boosted in recent years by deep imaging and spectroscopic surveys which have discovered star-forming galaxies at high redshift: a population of dusty and massive starbursts, with SFRs as high as 100 – 1000 M⊙ yr-1, has been unveiled in the submillimeter and millimeter wavelengths at z2 (Blain et al., 2002; Scott et al., 2002) and star-forming galaxies at 3 have been discovered with the Lyman break selection technique (Steidel et al., 1996; Pettini et al., 2001) and through Lyman- emission surveys (e.g., Rhoads et al. (2000), see also Le Fèvre et al. (2005) for a more recent independent approach).
In the local Universe, starbursts are mostly found in dwarf irregular galaxies, and contribute 25% of the whole massive SF (Heckman, 1998). Both observations and theoretical models (Larson & Tinsley, 1978; e.g., Genzel et al., 1998; e.g., Noguchi & Ishibashi, 1986) show that strong starbursts are usually triggered by processes such as interaction or merging of galaxies, or by accretion of gas, which probably played an important role in the formation and evolution of galaxies at high redshift. Thus, nearby starbursts can serve as local analogs to primeval galaxies to test our ideas about SF, evolution of massive stars, and physics of the interstellar medium (ISM) in ”extreme” environments. The high spatial resolution and high sensitivity of Hubble Space Telescope offer the possibility to study the evolution of nearby starbursts in details. This is fundamental in order to address many of the still open questions in cosmological astrophysics: What are the main characteristics of primeval galaxies? What is the nature of star-forming galaxies at high redshift? How important are accretion and merging processes in the formation and evolution of galaxies?
The Magellanic irregular galaxy NGC 4449 (, , and ), at a distance of Mpc (see Section 5), is one of the best studied and spectacular nearby starbursts. It has been observed across the whole electromagnetic spectrum and displays both interesting and uncommon properties. It is one of the most luminous and active irregular galaxies. Its integrated magnitude makes it 1.4 times as luminous as the Large Magellanic Cloud (LMC) (Hunter, 1997). Thronson et al. (1987) estimated a current SFR of M⊙ yr-1. NGC 4449 is also the only local example of a global starburst, in the sense that the current SF is occurring throughout the galaxy (Hunter, 1997). This makes NGC 4449 more similar to Lyman break Galaxies (LBGs) at high redshift (), where the brightest regions of SF are embedded in a more diffuse nebulosity and dominate the integrated light also at optical wavelengths (Giavalisco, 2002).
Abundance estimates in NGC 4449 were derived in the HII regions by Talent (1980), Hunter et al. (1982) and Martin (1997), and for NGC 4449 nucleus by Böker et al. (2001). The published values are in good agreement with each other, and provide 12 + log(O/H) . Adopting the oxygen solar abundance from Grevesse & Sauval (1998), 12 + log(O/H) 8.83, we obtain [O/H] -0.52, i.e. NGC 4449 oxygen content is almost one third solar, as in the LMC. New solar abundance estimates, based on 3D hydrodynamic models of the solar atmosphere, accounting for departures from LTE, and on improved atomic and molecular data, provide 12 + log(O/H) 8.66 (Asplund et al., 2005). However, the new lower abundances seem to be inconsistent with helioseismology data, unless the majority of the inputs needed to make the solar model are changed (Basu, 2007). Thus, we will adopt the old abundances from Grevesse & Sauval (1998) throughout the paper.
Radio observations of NGC 4449 have shown a very extended HI halo ( kpc in diameter) which is a factor of larger than the optical diameter of the galaxy and appears to rotate in the opposite direction to the gas in the center (Bajaja et al., 1994). Hunter et al. (1998, 1999) have resolved this halo into a central disk-like feature and large gas streamers that wrap around the galaxy. Both the morphology and the dynamics of the HI gas suggest that NGC 4449 has undergone some interaction in the past. A gas-rich companion galaxy, DDO 125, at the projected distance of kpc, could have been involved (Theis & Kohle, 2001).
NGC 4449 has numerous () star clusters with ages up to 1 Gyr (Gelatt et al., 2001) and a young ( 6-10 Myr) central cluster (Böker et al., 2001), a prominent stellar bar which covers a large fraction of the optical body (Hunter et al., 1999), and a spherical distribution of older (3-5 Gyr) stars (Bothun, 1986). The galaxy has also been demonstrated to contain molecular clouds from CO observations (Hunter & Thronson, 1996) and to have an infrared (10-150 ) luminosity of erg s-1 (Thronson et al., 1987). The ionized gas shows a very turbulent morphology with filaments, shells and bubbles which extend for several kpc (Hunter & Gallagher 1990, 1997). The kinematics of the HII regions within the galaxy is chaotic, again suggesting the possibility of a collision or merger (e.g., Valdez-Gutiérrez et al., 2002). Some 40% of the X-ray emission in NGC 4449 comes from hot gas with a complex morphology similar to that observed in H, implying an expanding super-bubble with a velocity of km s-1 (Summers et al., 2003).
All these observational data suggest that the late-type galaxy NGC 4449 may be changing as a result of an external perturbation, i.e., interaction or merger with another galaxy, or accretion of a gas cloud. A detailed study of the star-formation history (SFH) of this galaxy is fundamental in order to derive a coherent picture for its evolution, and understand the connection between possible merging/accretion processes and the global starburst. With the aim of inferring its SFH, we have observed NGC 4449 with the Advanced Camera for Surveys (ACS) on the Hubble Space Telescope (HST) in the F435W, F555W, F814W and F658N filters. In this paper we present the new data and the resulting color–magnitude diagrams (CMDs) (Sections 2, 3 and 4). We derive a new estimate of the distance modulus from the magnitude of the tip of the red giant branch (TRGB) and the average magnitude of the carbon stars in Section 5. In Section 6, the empirical CMDs are compared with stellar evolutionary tracks. With the use of the tracks, we are able to derive the spatial distribution of stars of different age in the field of NGC 4449. The Conclusions are presented in Section 7. The detailed SFH of NGC 4449 will be derived through synthetic CMDs in a forthcoming paper.
2 Observations and data reduction
The observations were performed in November 2005 with the ACS Wide Field Camera (WFC) using the F435W (B), F555W (V) and F814W (I) broad-band filters, and the F658N (H) narrow-band filter (GO program 10585, PI Aloisi). We had two different pointings in a rectangular shape along the major axis of the galaxy. Each pointing was organized with a 4 - exposure half integer pixel dither pattern with the following offsets in arcseconds: (0,0) for exposure 1, (0.12, 0.08) for exposure 2, (0.25, 2.98) for exposure 3, and (0.37, 3.07) for exposure 4. This dither pattern is suitable to remove cosmic rays and hot/bad pixels, fill the gap between the two CCDs of the ACS/WFC, and improve the PSF sampling. The exposure times in the different broad-band filters were chosen to reach at least one magnitude fainter than the TRGB, at I 24, with a photometric error below 0.1 mag (S/N 10). Eight exposures of 900 s, 600 s, 500 s and 90 s were acquired for each of the B, V, I and H filters, respectively.
For each filter, the eight dithered frames, calibrated through the most up-to-date version of the ACS calibration pipeline (CALACS), were co-added into a single mosaicked image using the software package MULTIDRIZZLE (Koekemoer et al., 2002). During the image combination, we fine-tuned the image alignment, accounting for shifts, rotations, and scale variations between images. The MULTIDRIZZLE procedure also corrects the ACS images for geometric distortion and provides removal of cosmic rays and bad pixels. The total field of view of the resampled mosaicked image is 380 200 arcsec2, with a pixel size of 0.035 ″(0.7 times the original ACS/WFC pixel size).
To choose the optimal drizzle parameters, we experimented with different combinations of the MULTIDRIZZLE parameters pixfrac (the linear size of the “drop” in the input pixels) and pixscale (the size of output pixels). One must choose a pixfrac value that is small enough to avoid degrading the final image, but large enough that, when all images are dropped on the final frame, the flux coverage of the output image is fairly uniform. Statistics performed on the final drizzled weight image should yield an rms value which is less than 20% of the median value. In general, the pixfrac should be slightly larger than the scale value to allow some of the ’drop’ to spill over to adjacent pixels. Following these guidelines, we find that pixfrac0.8 and pixscale0.7 provide the best resolution and PSF sampling for our dithered images.
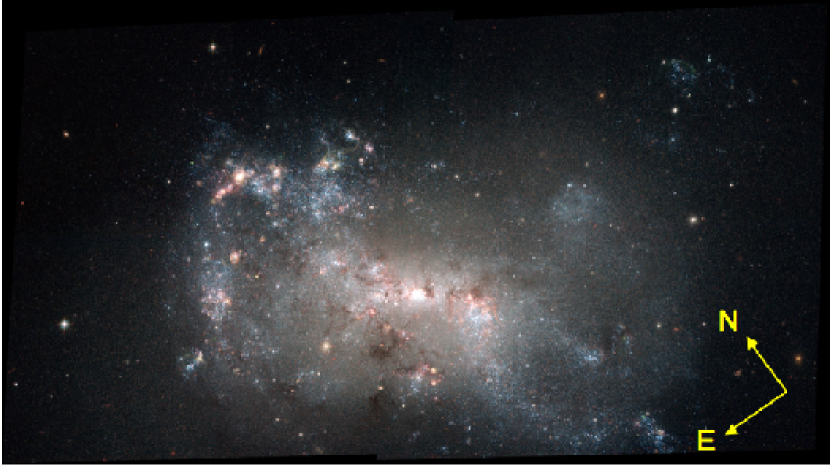
The total integration times are 3600 s, 2400 s, 2000 s and 360 s for the B, V, I and H images, respectively. Only in a small region of overlap between the two pointings ( 30 200 arcsec2) the integration times are twice as those listed above. Figure 1 shows the mosaicked true-color image created by combining the data in the four filters.
The photometric reduction of the images was performed with the DAOPHOT package (Stetson, 1987) in the IRAF environment222IRAF is distributed by the National Optical Astronomy Observatories, which are operated by AURA, Inc., under cooperative agreement with the National Science Foundation. The instrumental magnitudes were estimated via a PSF-fitting technique. We constructed a PSF template for each of the four ACS chips (2 CCDs at 2 pointings) contributing to the final mosaicked image. To derive the PSF, we selected the most isolated and clean stars, uniformly distributed within each chip. The PSF is modeled with an analytic moffat function plus additive corrections derived from the residuals of the fit to the PSF stars. The additive corrections include the first and second order derivatives of the PSF with respect to the X and Y positions in the image. This procedure allows us to properly model the spatial variation of the PSF in the ACS/WFC field of view.
The stars were detected independently in the three bands, without forcing in the shallowest frames the detection of the objects found in the deepest one. For comparison, we also ran the photometry on a list of stars detected on the sum of the B, V and I images. The luminosity functions (LFs) obtained in the various bands with the two different approaches are presented in Fig. 2. We notice that the forced search pushes the detection of stars 0.5 magnitude deeper than the independent search. On the other hand, upon closer inspection the majority of the “gained” objects turn out to be spurious detections or stars with large photometric errors. Furthermore, the deeper photometry is not deep enough to detect the next features of interest in the CMD (the horizontal branch, the red clump or the asymptotic giant branch (AGB) bump, see Section 3), and thus it does not provide any additional information for our study. In the following we thus use the photometry obtained with the independent search on the three bands.
Aperture photometry with PHOT, and then PSF-fitting photometry with the ALLSTAR package, were performed at the position of the objects detected in the B, V and I images. The instrumental magnitudes were measured adopting the appropriate PSF model to fit the stars according to their position in the frame. The B,V and I catalogs were then cross-correlated with the requirement of a spatial offset smaller than 1 pixel between the positions of the stars in the different frames. This led to 299,115 objects having a measured magnitude in both B and V, 402,136 objects in V and I, and 213,187 objects photometrized in all the three bands simultaneously.
The conversion of the instrumental magnitudes to the HST VEGAMAG system was performed by following the prescriptions in Sirianni et al. (2005). The HST VEGAMAG magnitudes are derived according to the equation:
| (1) |
where is the DAOPHOT magnitude () within a circular aperture of 2–pixel radius, and with the sky value computed in an annulus from 8 to 10 pixels; is the aperture correction to convert the photometry from the 2 pixel to the conventional radius aperture, and with the sky computed at “infinite”; we computed from isolated stars selected in our images; is taken from Sirianni et al. (2005) and is an offset to convert the magnitude from the 0.5 ″radius into a nominal infinite aperture; ZP is the HST VEGAMAG zeropoint for the given filter. Corrections for imperfect charge transfer efficiency (CTE) were calculated from each single expousure, and then averaged, following the formulation of Riess & Mack (2004) (Eq. 2), which accounts for the time dependence of the photometric losses:
| (2) |
where SKY is the sky counts per pixel per exposure, FLUX is the star counts per exposure within our adopted photometry aperture (r2 pixel in the resampled drizzled image, corresponding to 1.4 pixel in the original scale), Y is the number of charge transfers, and MJD is the Modified Julian Date. The coefficients of equation (2) were extrapolated from a r3 pixel aperture to a r1.4 pixel aperture (in the original scale), and are , , and . The computed CTE corrections are negligible for the brightest stars, but can be as high as 0.1 mag for the faintest stars. We did not transform the final magnitudes to the Johnson-Cousins B, V, I system, since this would introduce additional uncertainties. However, such transformations can be done in straightforward manner using the prescriptions of Sirianni et al. (2005). The ACS VEGAMAG magnitudes were not corrected for Galactic foreground extinction (, (Schlegel et al., 1998)) and internal reddening. Concerning the internal reddening, Hill et al. (1998) derived 0.18 from the /H ratio measured in NGC 4449 HII regions. This value can be considered an upper limit to the average internal extinction, since the nebular gas is usually associated with young star forming regions, which tend to be inherently more dusty than the regions in which older stars reside (as demonstrated explicitly for the case of the LMC; Zaritsky (1999)).
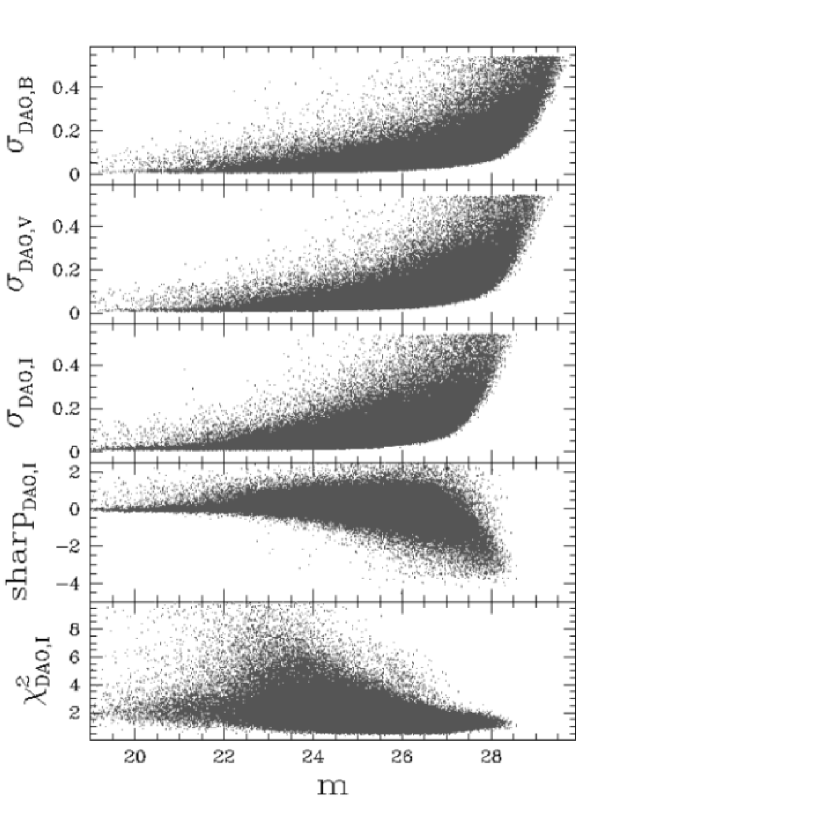
Because of both the large number of dithered exposures and the conservative approach of the independent search on the three images, our catalog is essentially free of instrumental artifacts such as cosmic rays or hot pixels. The distribution of the DAOPHOT parameters , and sharpness is shown in Fig. 3. The parameter measures the uncertainty on the magnitude, the is the residual per degree of freedom of the PSF-fitting procedure, and the sharpness provides a measure of the intrinsic size of the object with respect to the PSF. Notice that the DAOPHOT/ALLSTAR package automatically rejects the objects with . The obtained distributions for , and sharpness suggest that the vast majority of the detected sources are stars in the galaxy with a small contamination from stellar blends and background galaxies. There are some objects with very bright magnitudes () and sharpness 0.5 in Fig. 3 (this is also observed in the F435W and F555W filters, for which we do not show the and sharpness distributions). Their sharpness values imply that they have a larger intrinsic size than the PSF, and thus may not be individual stars. By visually inspecting these objects in all the images, we recognized several candidate star clusters and background galaxies. Some of the candidate star clusters look like fairly round but extended objects; some others present a central core, and are partially resolved into individual stars in the outskirts. We detect at least 42 clusters in our data, some of which look like very massive globular clusters. The candidate clusters and the galaxies that were identified by eye were rejected from the photometric catalog. We are left with 299,014 objects in the (B, V) catalog, 402,045 objects in the (V, I) catalog, and 213,099 objects photometrized in all the three bands. We experimented with many other cuts in , and sharpness, but none of them affected the global appearance of the CMDs and the detected evolutionary features. A detailed study of the cluster properties will be presented in a forthcoming paper (Aloisi et al., in preparation).
3 Incompleteness and blending
To evaluate the role of incompleteness and blending in our data, we performed artificial star experiments on the drizzle-combined frames, following the procedure described by Tosi et al. (2001). These tests serve to probe observational effects associated with the data reduction process, such as the accuracy of the photometric measurements, the crowding conditions, and the ability of the PSF-fitting procedure in resolving partially overlapped sources. We performed the tests using to the following procedure. We divided the frames into grids of cells of chosen width (50 pixels) and randomly added one artificial star per cell at each run. This procedure prevents the artificial stars to interfere with each other, and avoids to bias the experiments towards an artificial crowding not really present in the original frames. The position of the grid is randomly changed at each run, and after a large number of experiments the stars are uniformly distributed over the frame. In each filter, we assign to the artificial star a random input magnitude between and , with 3 mag brighter than the brightest star in the CMD, and 3 mag fainter then the faintest star in the CMD. At each run, the frame is re-reduced following exactly the same procedure as for the real data. The output photometric catalog is cross-correlated with a sum of the original photometric catalog of real stars and the list of the artificial stars added into the frame. This prevents cross-correlation of artificial stars in the input list with real stars recovered in the output photometric catalog. We simulated about half a million stars for each filter. At each magnitude level, the completeness of our photometry is computed as the ratio of the number of recovered artificial stars over the number of added ones. The completeness levels in the color magnitude diagrams (see Section 4) are the product of the completeness factors in the two involved passbands.
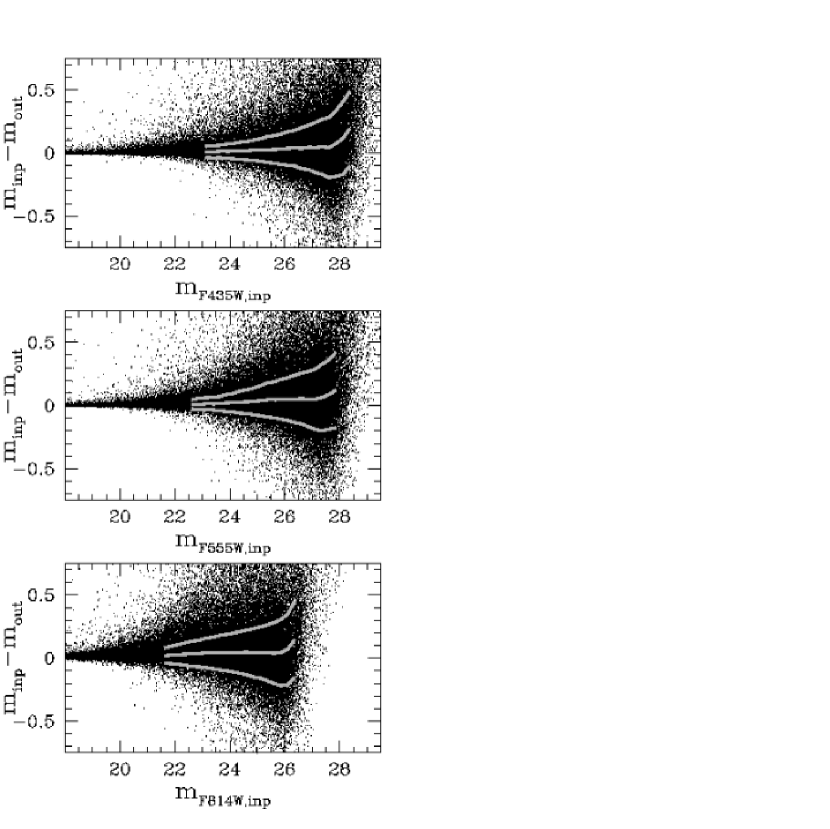
We show in Fig. 4 the difference between the input and output magnitudes of the artificial stars as a function of the input magnitude, for the F435W, F555W and F814W filters. The solid lines superimposed on the artificial star distributions correspond to the mean (central line), and the values around the mean. The plotted distributions provide a complete and statistically robust characterization of the photometric error as a function of magnitude, for each filter. By comparing the with the DAOPHOT errors in Fig. 3, it is apparent that the DAOPHOT package increasingly underestimates the actual errors toward fainter magnitudes. For instance, for a star with V 25.5 and I 24, (tip of the red giant branch, see Section 5), the mean DAOPHOT error is 0.05 mag in both bands, while the from the artificial star tests is 0.15 and 0.1 in V and I, respectively. The systematic deviation from 0 of the mean indicates the increasing effect of blending, i.e. faint artificial stars recovered brighter than in input because they happen to overlap other faint objects.
4 Color-magnitude diagrams
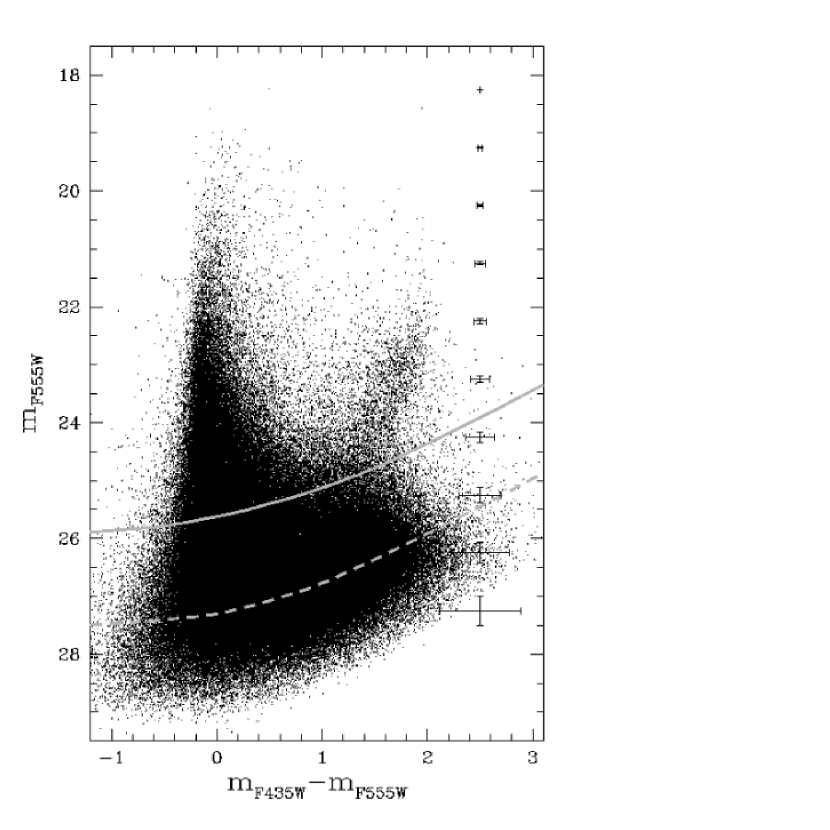
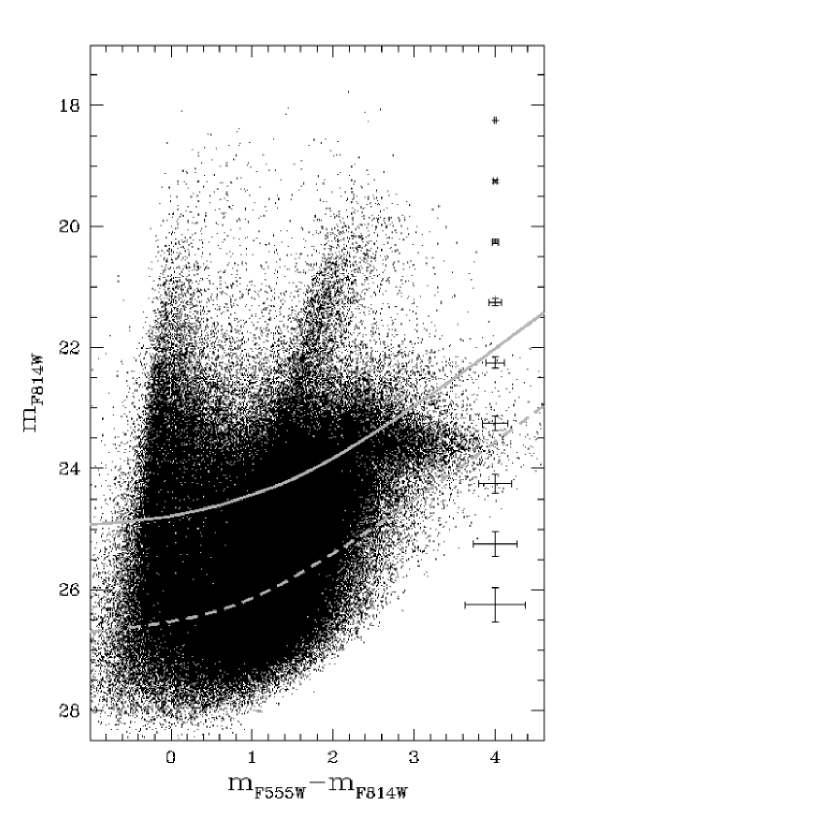
The CMDs are shown in Figures 5 and 6. We plot the versus CMD of the 299,014 stars matched between the B and V catalogs in Fig. 5, and we plot the versus CMD of the 402,045 stars matched between the V and I catalogs in Fig. 6. We indicate the 90 % (solid line) and 50 % (dashed line) completeness levels as derived from the artificial star experiments on the two CMDs. The average size of the photometric errors at different magnitudes, as derived from artificial star tests, is indicated as well.
The two CMDs show all the evolutionary features expected at the magnitudes sampled by our data: a well defined blue plume and red plume, the red horizontal tail of the carbon stars in the versus CMD, and a prominent red giant branch (RGB). The blue plume is located at and 0.1 in the two diagrams, with the brightest stars detected at , 18. It samples both stars in the main-sequence (MS) evolutionary phase and evolved stars at the hot edge of the core helium burning phase. The blue plume extends down to the faintest magnitudes in our data, at . The red plume is slightly inclined with respect to the blue plume, with and colors extending from to 1.8 in the , CMD, and and colors extending from to 2.2 in the versus CMD. It is populated by red supergiants (RSGs) at the brighter magnitudes, and AGB stars at fainter luminosities. At intermediate colors, below and , we recognize the blue loops of intermediate-mass stars in the core helium burning phase. The concentration of red stars at and , corresponds to low-mass old stars in the RGB evolutionary phase. Finally, a pronounced horizontal feature, at , and with colors extending from to as much as , is observed in the , CMD. This red tail is produced by carbon stars in the thermally pulsing asymptotic giant branch (TP-AGB) phase.
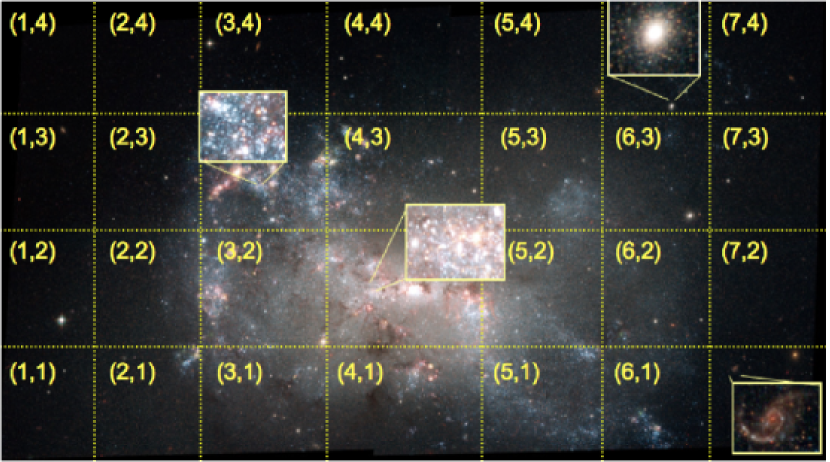
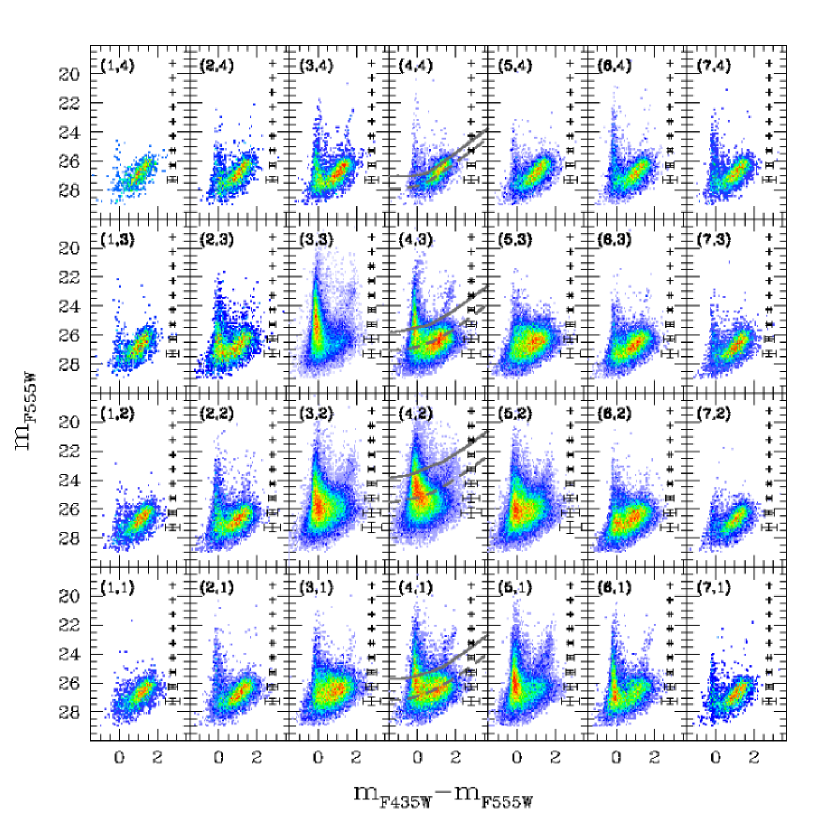
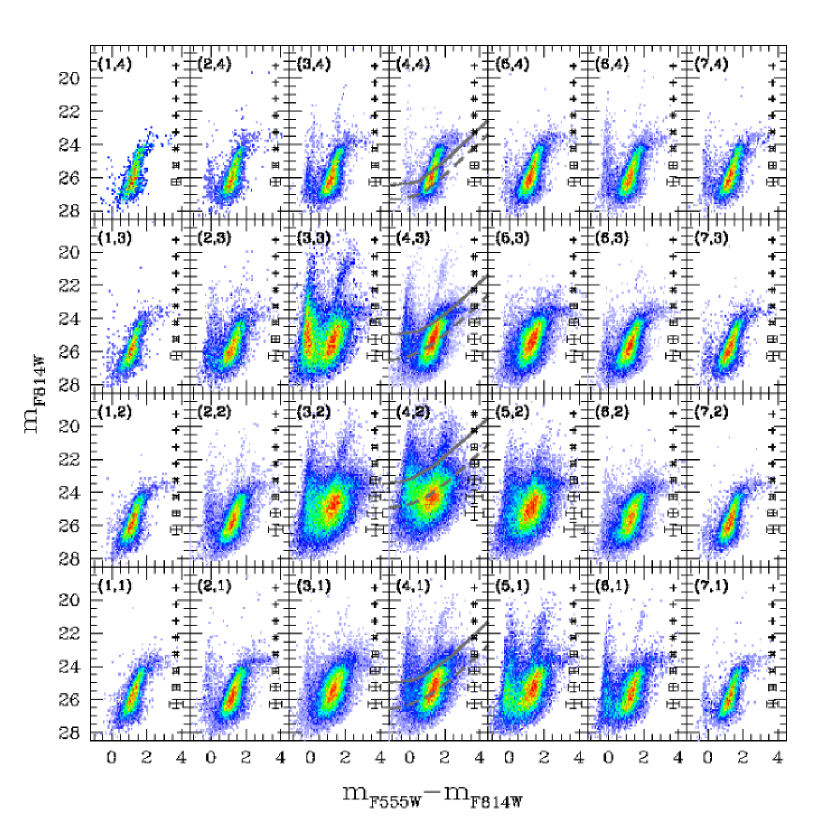
In order to reveal spatial differences in the stellar population of NGC 4449, we have divided the galaxy’s field of view into 28 (7 4) rectangular regions, as shown in Fig. 7. The size of the regions ( 55 55 , corresponding to at the distance of NGC 4449) allows us to follow spatial variations at the kpc scale, being at the same time large enough to provide a good sampling. The , , and , CMDs derived for the different regions are shown in Fig. 8 and 9, respectively. The completeness levels plotted on the CMDs of the central column show that the photometry is deeper in the external regions than in the galaxy center, where the high crowding level makes the detection of faint objects more difficult. The errors, as estimated from the artificial star experiments, increase toward the galaxy center, as an effect of the higher crowding level and the higher background. Bright stars are mostly concentrated toward the galaxy center, and only a few of them are present at large galactocentric distances, in agreement with what was already observed in other dwarf irregular galaxies, (e.g., Tosi et al. (2001)). The external region (6,4) makes the exception to this observed global trend, showing a prominent blue plume in both the CMDs. The luminous blue stars observed in these CMDs correspond in the image of Fig. 1 to a symmetric structure. This structure is more clearly visible in the top right of Fig. 19, which will be discussed in Section 6 below. This structure could be due to tidal tails or spiral–like feature associated with a dwarf galaxy that is currently being disrupted. The structure is centered on a resolved cluster-like object that could be the remnant nucleus of this galaxy. Fig. 7 shows a blow-up of this object.
4.1 Carbon stars
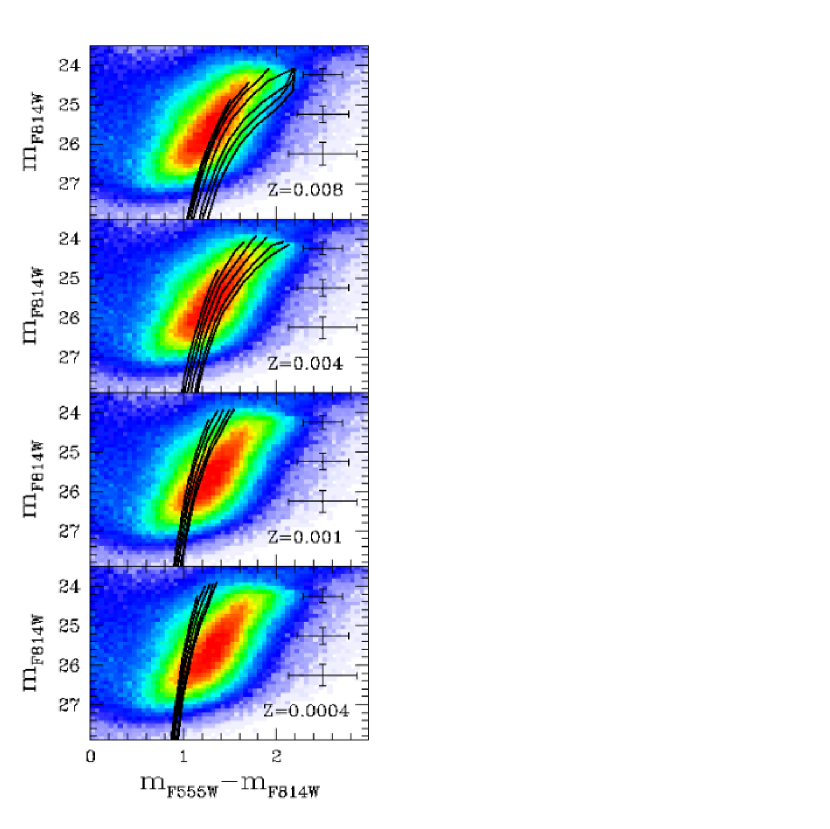
In the , CMD of Fig. 6, the horizontal red tail, at magnitudes brighter than the TRGB, is due to carbon-rich stars in the TP-AGB phase. Since AGB stars trace the stellar populations from 0.1 to several Gyrs, this well defined feature is suitable to investigate the SFH from old to intermediate ages (Cioni et al., 2006). Recently, theoretical models of TP-AGB stars have been presented by Marigo & Girardi (2007) for initial masses between 0.5 and 5.0 and for different metallicities. Their Fig. 20 shows that the position of the carbon–star tracks in the vs plane depends on both mass and metallicity. Higher-mass stars exhibit larger luminosities for a given metallicity. On the other hand, lower metallicities imply both a wider range of masses undergoing the C-rich phase, and higher luminosities for the more massive carbon stars.
From an empirical aspect, we can get the dependence of the carbon–star luminosity on age and metallicity from the work of Battinelli & Demers (2005) (hereafter BD05). The authors provide the following relation for the dependence of the carbon–star I band magnitude on metallicity:
| (3) |
which was derived through a least-square fit of the mean absolute I band magnitude of carbon stars in nearby galaxies with metallicities . According to (3), a drop of 1 dex in metallicity results in a decrease of 0.3 in the average magnitude of carbon stars. The age dependence of the carbon–star luminosity is more difficult to quantify since it requires a detailed knowledge of the SFH in galaxies. BD05 do not study such a dependence, but some qualitative considerations can be obtained from examination of their Fig. 4. The scatter of the versus relation is of the order of 0.1 mag (excluding AndII and AndVII from the fit), i.e. 20 % of the variation in spanned by the data. We also notice that at fixed metallicity, galaxies with current star formation (empty dots in Fig. 1 of BD05) tend to have brighter values, while galaxies with no current star formation preferentially lie below the relation. This suggests that at least part of the scatter of relation (3) is due to a spread in age, with younger stellar populations having brighter carbon stars than older stellar populations. This age dependence is consistent with the Marigo & Girardi (2007) models, where more massive (younger) carbon stars tend to be more luminous.
Carbon stars were selected in NGC 4449 at , for each of the 28 regions shown in Fig. 7. The color limit was chosen to avoid a significant contribution of RGB and oxygen-rich AGB stars. For each region, we fitted the -band LF with a Gaussian curve, and adopted the peak of the best-fitting Gaussian as the average in that region. The errors on the results of the Gaussian fits can be approximated as , where is the width of the Gaussian and N is the number of stars. We experimented with different cuts in color (up to ) and different binnings of the data, and found that none of them significantly affects the final results of the analysis. The results presented in Fig. 10 were obtained by binning the stellar magnitudes in bins of 0.2 mag. The quantity along the ordinate is the difference between the carbon–star magnitude measured in a specific region, and the carbon–star magnitude averaged over the whole field of view of NGC 4449. Along the abscissa is the X coordinate in pixels. From top to bottom, the panels refer to regions of decreasing Y coordinate. Fig. 10 shows that the observed carbon–star luminosity is reasonably constant over almost the whole galaxy, within the errors. The only significant variation is observed in the central regions (, panel c), where the carbon stars appear to be up to 0.25 mag brighter than the average value.
We performed Monte Carlo simulations to understand if the observed variation of the C star LF is intrinsic, i.e. due to stellar population gradients present in NGC 4449 field, or if it is an effect of the photometric error and completeness level variations across the field. We adopted an estimated intrinsic LF for the C stars, that we assumed to be constant all over the field. Then we investigated how the intrinsic LF is transformed into the observed one after completeness and photometric errors were applied at different galacto-centric distances. For simplicity, we assumed that the intrinsic distribution of the C stars is Gaussian, with parameters (, ) derived from the Gaussian fit to the observed LF in the most external regions ((1,1:4), (1:7,4), (7,1:4); where this notation will indicate the some of these regions). We also assumed that the C stars are not homogeneously distributed in color, but follow a power law in . The power law’s parameters were derived by fitting the observed C star color distribution in the same external regions. Our assumption that the observed outer LF is a good description of the intrinsic one in those regions is reasonable, since the most external , CMDs are more than 90 % complete at the average C star luminosity, and the errors are only a few hundreds of magnitudes there (see Fig. 9). Monte Carlo extractions of (, ) pairs were drawn from the assumed magnitude and color distributions. A completeness and a photometric error were then applied to each extracted star, for both an external and an internal region of NGC 4449. The effect of incompleteness and photometric errors on the distribution is shown in the bottom panel of Fig. 11. In the top panel we show instead the observed LFs for an external region ((1,1:4), (1:7,4), (7,1:4)), and for the most internal one (4,3), which displays the largest shift of the distribution peak with respect to the external region. Our simulations in the bottom panel show that the C star LF is mostly unaffected by incompleteness and photometric errors in the most external regions. This result testifies that the observed LF is very close to the intrinsic one in the periphery, and that we adopted a reasonable input distribution for the Monte Carlo simulations. In the most internal region, instead, the LF is shifted toward brighter magnitudes by an amount () comparable to the shift between the observed LFs. The resulting internal distribution also has a larger width () than the intrinsic one, due to the larger photometric errors.
Our results show that the detected change in the C star brightness over NGC 4449 field can be largely attributed to differences in completeness between the center and the most external regions. Accounting for this effect, the average magnitude of the C stars is constant within the errors ( mags). From the BD05 relation 333 BD05 use the Johnson-Cousins I-band. This is very similar to (Sirianni et al., 2005), and the small difference can be ignored for the purpose of the differential argument presented here., a change in magnitude of 0.05 corresponds to [Fe/H] . We interpret this as an upper limit to the metallicity variation over the field of view. This is consistent with studies of metallicity gradients in other magellanic irregulars. For example, Cole et al. (2004) derive a metallicity gradient of 0.05 dex kpc-1 in the LMC by comparing the abundances in the inner disk and in the outer disk/spheroid (Olszewski, 1993), while Grocholski et al. (2006) find no metallicity gradients from spectroscopic studies of cluster stars in the LMC.
4.2 RGB stars
In the CMD of Fig. 6, the morphology of the RGB, at and , is connected to the properties of the stellar content older than 1 Gyr. Despite the poorer time resolution with increasing look-back time, and the well known age-metallicity degeneracy, some constraints on the properties of the old stellar population can be inferred from an analysis of the RGB morphology.
We derived the average RGB color as a function of by selecting stars with , and then performing a Gaussian fit to the color distribution at different magnitude bins. The peak of the Gaussian fit is as red as at the RGB tip, and it is at , one magnitude below the tip. As expected, the RGB is significantly redder than in more metal-poor star-forming galaxies that we have previously studied with HST/ACS (Aloisi et al., 2005, 2007).
In order to reveal the presence of age/metallicity gradients in NGC 4449, we performed a spatial analysis of the RGB morphology, following the same procedure as in Section 4.1. For each of the 28 rectangular regions identified in Fig. 7, we performed a Gaussian fit to the RGB color distribution for bins of . Then we averaged for each region the colors derived in the four brightest bins, at , i.e. one magnitude below the TRGB. The results of our analysis are presented in Fig. 12. We plot along the ordinate the difference between the RGB color in each region and the average RGB color in the total field of view of NGC 4449; along the abscissa is the X coordinate in pixels. From top to bottom, the panels refer to regions of decreasing Y coordinate. Fig. 12 shows that the RGB is bluer in the center than in the periphery of NGC 4449, with variations up to 0.3 mag in the color.
This effect is also shown in the top panel of Fig. 13, where we plotted the observed color distributions of stars with , for an external region ((1,1:4), (1:7,4), (7,1:4)), and for an internal region (3:5,2) of NGC 4449. The peaks of the Gaussian fits to the external and internal distributions differ by 0.26 mag, and their errors are very small ( 0.001 mag) due to the large number of stars in each distribution (). The Gaussian fit is broader for the internal region () than for the external region (). Also, the central region has a much broader tail of stars towards blue colors, due to the contamination from younger blue-loop and MS stars. The contribution from the MS blue–loop stars at the hot edge of the core He-burning phase is recognizable as a bump at VI .
As was done for the C stars in Section 4.1, we performed Monte Carlo simulations to understand if the observed difference in the color distributions is intrinsic, or if it can be attributed to the larger crowding in the central regions of NGC 4449. We assumed an initial distribution, and drew Monte Carlo extractions from it with application of photometric errors and incompleteness. As a first guess for the initial distribution, we adopted a Gaussian with parameters and . This has the same mean but somewhat smaller than the observed color distribution in the most external regions. The simulated color distributions for the external and internal regions were generated by applying the photometric errors and the completeness levels derived from artificial star experiments in the considered regions of NGC 4449. The results are presented in the central panel of Fig. 13. As observed, the width of the simulated distribution in the internal region is larger than in the external one because of the higher photometric errors. While the peak of the external simulated distribution is the same as that of the initial distribution, the peak of the internal distribution is blueshifted by an amount of 0.06 mags. However, this is much less than the observed shift of 0.3 mags. The simulations therefore show that the completeness and the photometric error variations over NGC 4449 field of view can account only in part ( 20 % ) for the shift between the observed internal and external distributions. Thus the observed shift must be mainly due to an intrinsic variation of the stellar population properties.
As a test, we performed a new simulation starting from a Gaussian with a peak as blue as and with . The result for the internal region is shown in the bottom panel of Fig. 13. Here we plot also the observed color distribution, for comparison. Both the peaks and the widths of the simulated and observed distributions are in good agreement. The only discrepancy is observed at the bluest color, where of course we do not reproduce the tail of the MS and post-MS stars. Our simulations suggest that the peak of the color distribution toward the center is intrinsically bluer than in the periphery. Assuming that the bluer peak in the center is due to a bluer RGB, the possible interpretations are 1) younger ages; 2) lower metallicities; or 3) lower reddening. If differential reddening is present within NGC 4449, we expect the central regions to be more affected by dust extinction than the periphery, and this would cause an even redder RGB in the center. Lower metallicities in NGC 4449 center are also very unlikely, since abundance determinations in galaxies show that metallicity tends to decrease from the center outwards or to remain flat (see Section 4.1). Thus, a bluer RGB would most likely indicate a younger population in the center of NGC 4449. Alternatively, the bluer peak observed in the center could be due to “contamination” by intermediate-age blue loop stars at the red edge of their evolutionary phase. But this too would imply the presence of a younger stellar population in the center than in the periphery of NGC 4449. More quantitative results on age/metallicity in NGC 4449 gradients will be derived through fitting of synthetic CMDs, and presented in a forthcoming paper (Annibali et al. 2008, in preparation).
5 A new distance determination
The magnitude of the TRGB can be used to determine the distance of NGC 4449. The top panel of Fig. 14 shows the I-band LF of those stars in our final catalog that have VI in the range –. Here V and I are Johnson-Cousins magnitudes, obtained from our magnitudes in the ACS filter system using the transformations of Sirianni et al. (2005) and applying a foreground extinction correction of (Schlegel et al., 1998). The TRGB is visually identifiable as the steep increase towards fainter magnitudes at . At this magnitude, RGB stars start to contribute with a LF that increases roughly as a power law towards faint magnitudes. By contrast, the stars in the LF at brighter magnitudes are exclusively red supergiants and AGB stars. The drop at magnitudes fainter than is due to incompleteness.
To determine the TRGB magnitude we used the software and methodology developed by one of us (R.P.v.d.M) and described in detail in Cioni et al. (2000). A discontinuity produces a peak in all of the higher-order derivatives of the LF. We use a so-called Savitzky-Golay filter on the binned LF to obtain the first- and second-order derivatives. These are shown in the middle and bottom panel of Fig. 14, respectively. Peaks are indeed visible at the expected position of the TRGB. We fit these with Gaussians and find that the first derivative has a peak at , while the second derivative has a peak at . The reason for the difference between these magnitudes is the presence of photometric errors and binning in the analysis. This smooths out the underlying discontinuity. As shown in Fig. A.1 of Cioni et al. (2000), this causes the first derivative to overestimate the magnitude of the TRGB, and the second derivative to underestimate the magnitude of the TRGB. These biases can be explicitly corrected for as in Fig. A.2 of Cioni et al. (2000), using a simple model for the true underlying LF and the measured width of the Gaussian peaks in the first- and second-order derivatives of the LF. After application of this correction we obtain the final estimates and for the underlying TRGB magnitude, based on the first and second derivatives, respectively. The good agreement between these independent estimates shows that the systematic errors in the method are small, in agreement with Cioni et al. (2000) who adopted a systematic error . The additional systematic error introduced by the uncertainties in photometric zeropoints, transformations, and aperture corrections (Sirianni et al., 2005) is . The random error on is very small due to the large number of stars detected in NGC 4449. It can be estimated using bootstrap techniques to be .
Our estimate of the TRGB magnitude, (random) (systematic), can be compared to the absolute magnitude of the TRGB, which was calibrated as a function of metallicity by, e.g., Bellazzini et al. (2004). Adopting for NGC 4449 (based on the oxygen abundance given in Section 1) their calibration (top panel of their Fig. 5) predicts . Comparison of different studies suggests that the systematic uncertainty in this prediction is . This takes into account also the possibility that the RGB star metallicity is actually lower than that of the HII regions (see discussion in Section 6). The implied distance modulus for NGC 4449 is therefore , where we have added all sources of uncertainty in quadrature. This corresponds to Mpc.
An alternative method for estimating the distance of NGC 4449 is through the average I-band magnitude of the carbon stars. Fig. 15 shows the I-band luminosity function of those stars in our final catalog that have VI in the range –. There is a well-defined peak, due to the horizontal “finger” of carbon stars seen in the CMD of Fig. 6. A Gaussian fit to the peak yields , corrected for foreground extinction. Adopting for NGC 4449 (based on the oxygen abundance given in Section 1, and assuming for simplicity that oxygen traces the iron content), the BD05 calibration in (3) predicts . The systematic uncertainty in this prediction is difficult to quantify. This is because carbon–star magnitudes are not well understood on the basis of stellar evolution theory (by contrast to the TRGB), because the dependence on stellar age or star formation history is poorly quantified, and because only a few empirical studies exist. We therefore adopt an uncertainty of mag, consistent with the discussion of Section 4.1 The implied distance modulus for NGC 4449 is then , where we have added all sources of uncertainty in quadrature. This corresponds to Mpc. This is in agreement with the TRGB result, given the uncertainties.
We can compare our result of Mpc to the previous estimate of NGC 4449 distance by Karachentsev et al. (2003), who inferred Mpc. This result was derived by applying the TRGB-luminosity method to HST/WFPC2 data. The extinction-corrected magnitude at which they detected the TRGB is , which is consistent with our somewhat lower value of (random) (systematic). Their somewhat larger distance is also due to the different value adopted for the absolute magnitude of the TRGB. They adopt (as appropriate for metal-poor systems), while we adopt from the more recent Bellazzini et al. (2004) calibration (which takes into account the metallicity dependence of the TRGB luminosity).
6 Comparison with models
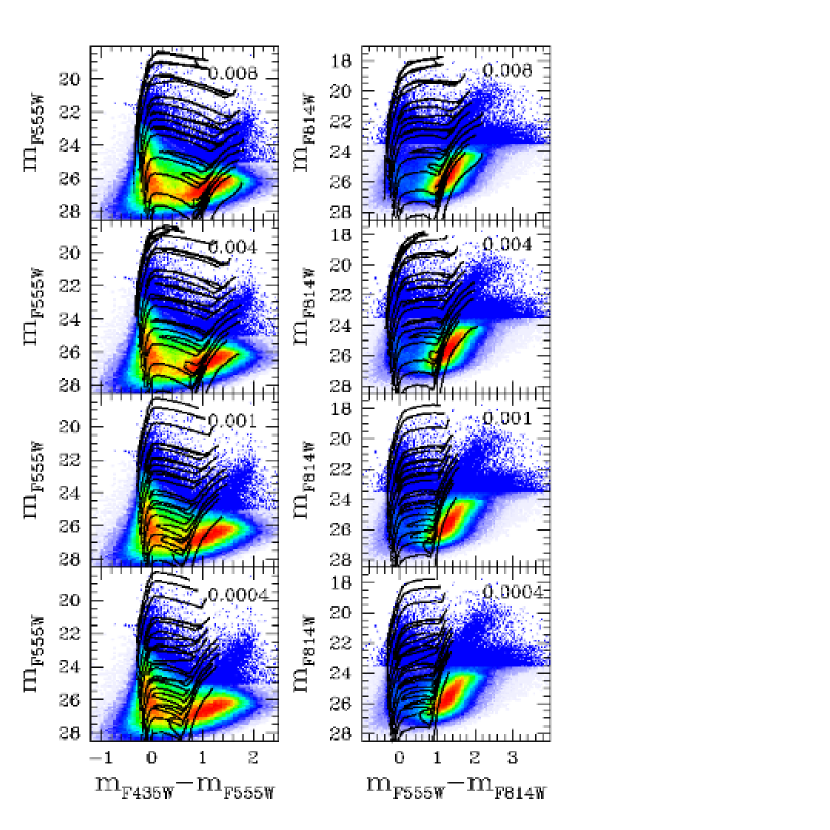
For a direct interpretation of the CMDs in terms of the stellar evolutionary phases, we have superimposed stellar evolutionary tracks for different metallicities on the , , and , CMDs (Figs. 16 and 17). The tracks at Z0.008, Z0.004, and Z0.0004 are the Padua stellar evolutionary tracks (Fagotto et al. 1994a, 1994b) transformed into the ACS Vegamag system by applying the Origlia & Leitherer (2000) code, and corrected for Galactic extinction (, Schlegel et al. (1998)) and distance modulus (, see Section 5). The Z0.001 tracks were obtained from the Padua tracks through interpolation in metallicity (Angeretti et al., 2007).
The metallicity range covered by the plotted tracks can account for the different populations potentially present in NGC 4449. The Z0.008 and Z0.004 tracks are suitable to account for the more metal rich population, given that the abundances derived in the nucleus and disk of NGC 4449 are almost one third of the solar value (see Section 1). The plotted tracks are for masses in the range 0.9–40 . Lower mass stars would not have the time to reach visible phases within a Hubble time at the distance of NGC4449 (in these sets a 0.8 star reaches the TRGB in 19 Gyr). The tracks are divided into three groups, namely low-mass stars (), intermediate-mass stars () and high-mass stars (). The subdivision is made according to the critical mass at which the ignition of the central fuel (either helium or carbon) starts quietly depending on the level of core electron-degeneracy. In the adopted tracks, the value of depends slightly on metallicity, being equal to 1.7, 1.8 and 1.9 for Z0.0004, Z0.004 and Z0.008, respectively. The value of is between 5 and 6 . For low-mass stars, we have displayed in Figs. 16 and 17 only the phases up to the TRGB in order to avoid excessive confusion.
At the distance of NGC 4449, the MS is sampled only for stars with , and corresponds to the vertical lines whose , colors go from 0.3 to 0 from the 40 to the 3 track. The turnoff is recognizable as a small blue hook on each evolutionary track of Fig. 16. The almost horizontal blue loops correspond to the later core helium-burning phase for intermediate- and high- mass stars, while the bright vertical lines in the red portion of the CMD describe the AGB phase. For low-mass stars, our data sample only the brighter red sequences of the RGB, all terminating at the TRGB with approximately the same luminosity. The models considered here do not include the horizontal feature of the carbon stars in the TP-AGB phase, recognizable in the CMD at , but see Marigo & Girardi (2007) for new appropriate models.
The comparison of the CMDs with the tracks in Fig. 16 shows that the blue plume is populated by high- and intermediate-mass stars on the MS, and high-mass stars at the hot edge of the core helium-burning phase. The red plume samples bright red SGs and AGB stars. The faint red sequence at , featured in Fig. 17, is due to low-mass stars in the RGB phase.
The presence of high-, intermediate- and low-mass stars in the CMD testifies that young, intermediate-age and old stars (several Gyrs) are present at the same time in NGC 4449. In particular, the fact that we sample stars as massive as 40 implies that the SF was active 5 Myr ago. Furthermore, the absence of significant gaps in the CMD suggests that the SF has been mostly continuous over the last 1 Gyr. The time resolution gets significantly poorer for higher look-back times because of both the intrinsic degeneracy of the tracks and the large photometric errors at faint magnitudes; thus small interruptions in the SF can be easily hidden in the CMD for ages older than Gyr.
The metallicity derived in Section 1 for NGC 4449 corresponds to a metal fraction Z0.005, adopting Z 0.017 (Grevesse & Sauval, 1998). However this value refers to abundance determinations in HII regions, thus it is likely to reflect the metallicity of the youngest stars. Fig. 16 and 17 show that the Z0.004 tracks are in good agreement with all the phases of the empirical CMDs. The Z0.0004 and Z0.001 tracks are too blue to account for the observed RGB feature. So, if there is no significant extinction intrinsic to NGC 4449, then stars with such low metallicities do not account for a significant fraction of the stellar population in NGC 4449. Allowing for an age spread from 1 Gyr to a Hubble time, the Z0.004 tracks are in good agreement with both the color and the width of the observed RGB. Hill et al. (1998) derived an internal reddening 0.18 from the /H ratio measured in NGC 4449 HII regions. Adopting this value, the RGB is consistent with metallicities as low as Z0.001. However, this extinction value is appropriate for the young star forming regions, and we expect a lower extinction in the regions where older stars reside (as demonstrated for the LMC by Zaritsky (1999)). Either way, the Z0.008 models seem slightly too red, especially in the AGB phase. Although there are some uncertainties in the models of this phase, we do believe that this discrepancy indicates that metallicities higher than Z0.008 are ruled out for this galaxy.
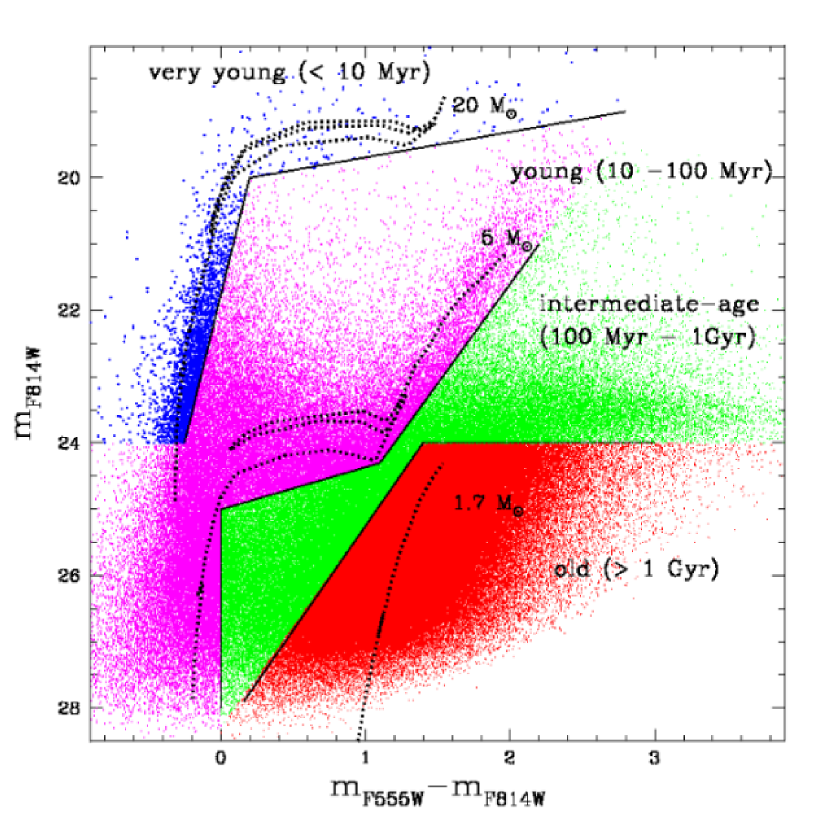
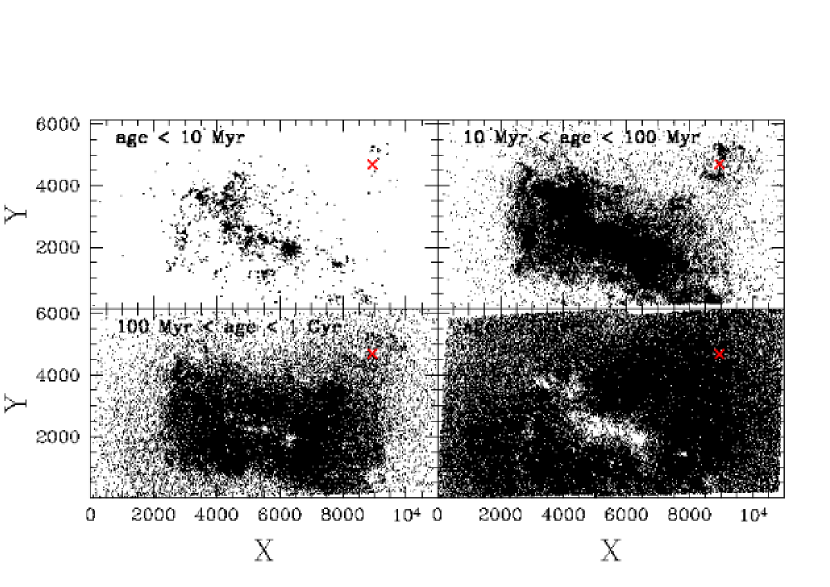
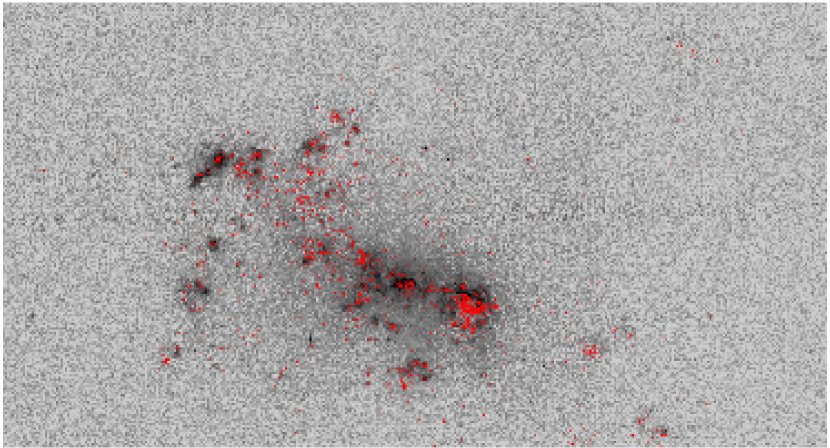
By superimposing the stellar tracks on the empirical CMDs, we can attempt a selection of the photometrized stars according to their age. In Fig. 18 we show the four regions selected on the CMD that correspond to different stellar masses, namely M, , , and . These regions roughly define the loci of very young stars, with ages 10 Myr, young stars, with , intermediate-age stars, with ages between 100 Myr and 1 Gyr, and old stars, with ages 1 Gyr. The spatial distribution of the four groups of stars is shown in Fig. 19. We notice that old stars are homogeneously distributed over the galaxy, except for the central regions, where the high crowding level makes their detection more difficult. As we approach younger ages, the distribution becomes more and more concentrated. Stars with ages between 10 and 100 Myr are highly clustered in an S shaped structure centered on the galaxy nucleus. This could be a bar, which is a common feature among Magellanic irregular galaxies. Stars with ages between 10 and 100 Myr also clearly outline the symmetric structure around the resolved cluster-like object (see Fig. 7) that was already discussed in Section 4. The same structure is visible to a lesser extent in the spatial distribution of stars with ages 100 Myr – 1 Gyr. The resolved cluster-like object itself has a clear RGB (not shown here), and it is therefore not a young super star cluster. Very young stars, with ages younger than 10 Myr, are strongly clustered and detected only in the very central regions of NGC 4449. Such young stars should be able to ionize the surrounding interstellar medium and produce HII regions. Indeed, Fig. 20, where we plotted the F658N (H) image together with the positions of the stars younger than 10 Myr, shows that this is the case, with a strong correlation between the position of the stars younger than 10 Myr and the HII regions. This indicates that most of the emission is due to photoionization rather than to shocks, due to, e.g., supernovae explosions.
7 Conclusions
We have acquired HST/ACS imaging in the F435W (B), F555W (V), F814W (I) and F658N () filters of the Magellanic starburst galaxy NGC 4449 in order to infer its star formation history and understand the properties of the observed global starburst. In this paper we present the B, V and I photometry of the resolved stars. We detect 299,014 objects in the (B,V) CMD, 402,045 objects in the (V,I) CMD, and 213,099 objects with a measured magnitude in all the three bands. The derived CMDs span a magnitude range of 10 mag, and sample both the young and the old resolved stellar population in NGC 4449. We also detected several candidate clusters (at least 40, some of which look like very massive globular clusters) and background galaxies in our images.
We derived a new distance from the TRGB method. The TRGB is detected at a Johnson-Cousins I magnitude of . At the metallicity of NGC 4449, the TRGB is expected at an absolute magnitude of , with a systematic error of mag. This provides a distance modulus of , i.e. a distance of Mpc. We used also the alternative method of the carbon–star luminosity, and found a distance of Mpc, which is consistent with the result from the TRGB method. Our distance determinations are consistent within the errors with the value of D Mpc previously provided by Karachentsev et al. (2003).
In the CMDs of NGC 4449 we observe a well defined blue plume (MS and post-MS stars) and red plume (red SGs and AGB stars), the horizontal tail of the carbon stars in the TP-AGB phase (in the I, VI CMD), and a prominent RGB. The presence of all these evolutionary features implies ages up to at least 1 Gyr and possibly as old as a Hubble time. The comparison of the observed CMDs with the Padua stellar evolutionary tracks, corrected for the derived distance modulus and foreground extinction, shows that stars as massive as 40 are present in NGC 4449. Such high masses imply that the star formation was active 5 Myr ago, and possibly it is still ongoing. The absence of significant gaps in the CMDs suggests also that the star formation has been mostly continuous over the last 1 Gyr. However, interruptions in the star formation can be easily hidden in the CMD for ages older than Gyr, because of the intrinsic degeneracy of the tracks and the large photometric errors at faint magnitudes. The presence of a prominent RGB testifies that NGC 4449 hosts a population possibly as old as several Gyrs or more. However, the color-age degeneracy of the tracks with increasing look-back time (at a given metallicity, large age differences correspond to small color variation in the RGB), and the well known age-metallicity degeneracy, prevent us from establishing an exact age for the galaxy. We will derive a better age estimate with the synthetic CMD method, when we’ll study the detailed SFH (Annibali et al. 2008, in preparation).
Abundance estimates in NGC 4449 HII regions provide 12 + log(O/H) (Talent, 1980; Martin, 1997), which corresponds to [O/H] if we assume a solar abundance of 12 + log(O/H) 8.83 (Grevesse & Sauval, 1998). These measures are biased toward regions where the interstellar medium has been significantly reprocessed, and thus are likely to reflect the metallicity of the youngest generation of stars. We expect lower metallicity for the oldest stars in NGC 4449. Interestingly, though, the Z0.004 stellar evolutionary tracks (the closest in the Padua set to the metallicity of NGC 4449), corresponding to if we adopt (Grevesse & Sauval, 1998), seem to be in very good agreement with all the features observed in the empirical CMDs, if we assume that there is not significant extinction intrinsic to NGC 4449. In particular, the next lower metallicity tracks (at ) are definitively too blue to account for the observed RGB colors, implying that the bulk of the stellar population older than 1 Gyr was already enriched in metals.
We investigated the presence of age and metallicity gradients in NGC 4449. To this purpose, we divided the total galaxy’s field of view into 28 rectangular regions of 1 kpc2 area, and derived the CMDs for the different regions. The CMD morphology presents a significant spatial dependence: while the RGB is detected over the whole field of view of the galaxy, the blue plume, red plume and blue-loop stars are present only in the more central regions, indicating that the stellar population is younger in the center than in the periphery of NGC 4449.
We also studied the spatial behavior of the carbon–star luminosity and of the RGB color. Once the effect of incompleteness and photometric errors is taken into account, the average magnitude of the C stars turns out to be constant within the errors ( 0.05 mags). This gives an upper limit of 0.2 dex on the metallicity variation over the field of view of NGC 4449. On the other hand, we find that the RGB is intrinsically bluer in the center than in the periphery of the galaxy. Bluer RGB colors can be due to younger and/or more metal poor stellar populations. However, as spectroscopic-based abundance determinations in galaxies show that metallicity tends to decrease from the center outwards, or to remain constant, we interpret this as the result of a younger, and not more metal poor, stellar population in the center of NGC 4449.
With the help of the Padua tracks, we identified in the observed CMD four different zones corresponding to different stellar masses, namely M, , , and . These regions roughly define the loci of stars with age 10 Myr, , 100 Myr age 1 Gyr, and age 1 Gyr. Low-mass old stars are homogeneously distributed over the galaxy’s field of view, with the exception of the central regions, where the high crowding level makes their detection more difficult. As we approach younger ages, the spatial distribution of the stars becomes more and more clustered. Intermediate-age stars (100 Myr age 1 Gyr) are mostly found within 1 kpc from the center. Stars with ages between 100 Myr and 10 Myr are found in an S–shaped structure centered on the galaxy nucleus, and extending in the North-South direction up to 1 kpc away from the center. This could be a bar, which is a common feature among Magellanic irregular galaxies. Stars younger than 10 Myr are very rare, and found only in the galaxy nucleus and in the North arm of the S shape structure. The comparison with the H image shows a tight correlation between the position of the stars younger than 10 Myr and the HII regions, indicating that we have identified the very massive and luminous stars that ionize the surrounding interstellar medium.
One of the many star clusters visible in our image is of particular interest. This cluster on the West side of the galaxy is surrounded by a symmetric structure that is particularly well outlined by stars with ages in the range of 10–100 Myr (see Fig. 19). This structure could be due to tidal tails or spiral–like feature associated with a dwarf galaxy that is currently being disrupted by NGC 4449. The cluster could be the remnant nucleus of this galaxy. It is resolved into red stars, and it has a significant ellipticity (see Fig. 7). This is reminiscent of the star cluster Cen in our own Milky Way, which has also been suggested to be the remnant nucleus of a disrupted dwarf galaxy (Freeman & Rodgers, 1975). More details about this object will be presented in a forthcoming paper (Aloisi et al. 2008, in preparation).
Quantitative information on the star formation history of NGC 4449 is fundamental in order to understand the connection between the global starburst observed and processes such as merging, accretion and interaction. The star formation history of NGC 4449 will be derived in a forthcoming paper through the synthetic CMD method, which is based on stellar evolutionary tracks, and is able to fully account for the effect of observational uncertainties, such as photometric errors, blending and incompleteness of the observations.
References
- Aloisi et al. (2005) Aloisi, A., van der Marel, R. P., Mack, J., Leitherer, C., Sirianni, M., & Tosi, M. 2005, ApJ, 631, L45
- Aloisi et al. (2007)
- Aloisi et al. (2007) Aloisi, A., et al. 2007, IAU Symposium, 241, 310
- Angeretti et al. (2007) Angeretti, L., Fiorentino, G., & Greggio, L. 2007, IAU Symposium, 241, 41
- Annibali et al. (2007) Annibali, F., Bressan, A., Rampazzo, R., Zeilinger, W. W., & Danese, L. 2007, A&A, 463, 455
- Asplund et al. (2005) Asplund, M., Grevesse, N., & Sauval, A. J. 2005, Cosmic Abundances as Records of Stellar Evolution and Nucleosynthesis, 336, 25
- Bajaja et al. (1994) Bajaja, E., Huchtmeier, W. K., & Klein, U. 1994, A&A, 285, 385
- Basu (2007) Basu, S. 2007, American Astronomical Society Meeting Abstracts, 210, #111.05
- Battinelli & Demers (2005) Battinelli, P., & Demers, S. 2005, A&A, 442, 159
- Bellazzini et al. (2004) Bellazzini, M., Ferraro, F. R., Sollima, A., Pancino, E., & Origlia, L. 2004, A&A, 424, 199
- Blain et al. (2002) Blain, A. W., Smail, I., Ivison, R. J., Kneib, J.-P., & Frayer, D. T. 2002, Physics Reports, 369, 111
- Böker et al. (2001) Böker, T., van der Marel, R. P., Mazzuca, L., Rix, H.-W., Rudnick, G., Ho, L. C., & Shields, J. C. 2001, AJ, 121, 1473
- Bothun (1986) Bothun, G. D. 1986, AJ, 91, 507
- Cioni et al. (2006) Cioni, M.-R. L., Girardi, L., Marigo, P., & Habing, H. J. 2006, A&A, 452, 195
- Cioni et al. (2000) Cioni, M.-R. L., van der Marel, R. P., Loup, C., & Habing, H. J. 2000, A&A, 359, 601
- Cole et al. (2004) Cole, A. A., Smecker-Hane, T. A., Tolstoy, E., & Gallagher, J. S. 2004, Origin and Evolution of the Elements, Carnegie Observatories Astrophysics Series, ed. A. McWilliam and M. Rauch, 2004.
- Freeman & Rodgers (1975) Freeman, K. C., & Rodgers, A. W. 1975, ApJ, 201, L71
- Gelatt et al. (2001) Gelatt, A. E., Hunter, D. A., & Gallagher, J. S. 2001, PASP, 113, 142
- e.g., Genzel et al. (1998) Genzel, R., Lutz, D., & Tacconi, L. 1998, Nature, 395, 859
- Giavalisco (2002) Giavalisco, M. 2002, ARAA, 40, 579
- Grevesse & Sauval (1998) Grevesse, N., & Sauval, A. J. 1998, Space Science Reviews, 85, 161
- Grocholski et al. (2006) Grocholski, A. J., Cole, A. A., Sarajedini, A., Geisler, D., & Smith, V. V. 2006, AJ, 132, 1630
- Heckman (1998) Heckman, T. M. 1998, in ASP Conf. Ser. 148, Origins, ed. C. E. Woodward, J. M. Shull, & H. A. Thronson, Jr. (San Francisco: ASP), 127
- Hill et al. (1998) Hill, R. S., et al. 1998, ApJ, 507, 179
- Hunter & Gallagher (1990) Hunter, D. A., & Gallaghger, J. S. 1990, ApJ, 362, 480
- Hunter et al. (1982) Hunter, D. A., Gallagher, J. S., & Rautenkranz, D. 1982, ApJS, 49, 53
- Hunter & Thronson (1996) Hunter, D. A., & Thronson, H. A., Jr 1996 ApJ, 461, 202
- Hunter (1997) Hunter, D. A. 1997, PASP, 109, 937
- Hunter & Gallaghger (1997) Hunter, D. A., & Gallaghger, J. S. 1997, ApJ, 475, 65
- Hunter et al. (1998) Hunter, D. A., Wilcots, E. M., van Woerden, H., Gallagher, J. S., & Kohle, S. 1998, ApJ, 495, L47
- Hunter et al. (1999) Hunter, D. A., van Woerden, H., & Gallaghger, J. S. 1999, AJ, 118, 2184
- e.g., Kalirai et al. (2006) Kalirai, J. S., et al. 2006, ApJ, 648, 389
- Karachentsev et al. (2003) Karachentsev, I. D., Sharina, M. E., Dolphin, A. E., Grebel, E. K., Geisler, D., Guhathakurta, P., Hodge, P. W., Karachentseva, V. E., Sarajedini, A., & Seitzer, P. 2003, A&A, 398, 467
- Kobulnicky & Skillman (1997) Kobulnicky, H. A., & Skillman, E. D. 1997, ApJ, 489, 636
- Koekemoer et al. (2002) Koekemoer, A. M., Fruchter, A. S., Hook, R. N., & Hack, W. 2002, The 2002 HST Calibration Workshop, 2002. Edited by Santiago Arribas, Anton Koekemoer, and Brad Whitmore. Baltimore, MD: Space Telescope Science Institute, 2002., p.337, 337
- Kurucz (1993) Kurucz, R. L. 1993, VizieR Online Data Catalog, 6039
- Larson & Tinsley (1978) Larson, R. B., & Tinsley, B. M. 1978, ApJ, 219, 46
- Le Fèvre et al. (2005) Le Fèvre, O., et al. 2005, A&A, 439, 877
- Lisenfeld & Ferrara (1998) Lisenfeld, U., & Ferrara, A. 1998, ApJ, 496, 145
- Marigo & Girardi (2007) Marigo, P., & Girardi, L. 2007, A&A, 469, 239
- Marigo et al. (2003) Marigo, P., Girardi, L., & Chiosi, C. 2003, Memorie della Societa Astronomica Italiana Supplement, 3, 159
- Martin (1997) Martin, C. L. 1997, ApJ, 491, 561
- e.g., Noguchi & Ishibashi (1986) Noguchi, M., & Ishibashi, S. 1986, MNRAS, 219, 305
- Olszewski (1993) Olszewski, E. W. 1993, The Globular Cluster-Galaxy Connection, 48, 351
- Origlia & Leitherer (2000) Origlia, L., & Leitherer, C. 2000, AJ, 119, 2018
- Pettini et al. (2001) Pettini, M., Shapley, A. E., Steidel, C. C., Cuby, J.-G., Dickinson, M., Moorwood, A. F. M., Adelberger, K. L., & Giavalisco, M. 2001, ApJ, 554, 981
- e.g., Rhoads et al. (2000) Rhoads, J. E., Malhotra, S., Dey, A., Stern, D., Spinrad, H., & Jannuzi, B. T. 2000, ApJ, 545, L85
- Riess & Mack (2004) Riess, A. and Mack, J. 2004, ISR ACS 2004-006
- Schlegel et al. (1998) Schlegel, D. J., Finkbeiner, D. P., & Davis, M. 1998, ApJ, 500, 525
- Scott et al. (2002) Scott, S. E., et al. 2002, MNRAS, 331, 817
- Sirianni et al. (2005) Sirianni, M., et al. 2005, PASP, 117, 1049
- Steidel et al. (1996) Steidel, C. C., Giavalisco, M., Pettini, M., Dickinson, M., & Adelberger, K. L. 1996, ApJL, 462, L17
- Stetson (1987) Stetson, P. B. 1987, PASP, 99, 191
- Summers et al. (2003) Summers, L. K., Stevens, I. R., Strickland, D. K., & Heckman, T. M. 2003, MNRAS, 342, 690
- Talent (1980) Talent, D. L. 1980, Ph.D. Thesis
- Theis & Kohle (2001) Theis, C., & Kohle, S. 2001, A&A, 370, 365
- Thronson et al. (1987) Thronson, H. A., Jr., Hunter, D. A., Telesco, C. M., Decher, R., & Harper, D. A. 1987, ApJ, 317, 180
- Tosi et al. (2001) Tosi, M., Sabbi, E., Bellazzini, M., Aloisi, A., Greggio, L., Leitherer, C., & Montegriffo, P. 2001, AJ, 122, 1271
- e.g., Valdez-Gutiérrez et al. (2002) Valdez-Gutiérrez, M., Rosado, M., Puerari, I., Georgiev, L., Borissova, J., & Ambrocio-Cruz, P. 2002, AJ, 124, 3157
- Zaritsky (1999) Zaritsky, D. 1999, AJ, 118, 2824
- Zaritsky et al. (1994) Zaritsky, D., Kennicutt, R. C., Jr., & Huchra, J. P. 1994, ApJ, 420, 87