A very cool brown dwarf in UKIDSS DR1
Abstract
We report the discovery of a very cool brown dwarf, ULAS J003402.77005206.7 (ULAS J003400), identified in the UKIRT Infrared Deep Sky Survey First Data Release. We provide optical, near-infrared, and mid-infrared photometry of the source, and two near-infrared spectra. Comparing the spectral energy distribution of ULAS J003400 to that of the T8 brown dwarf 2MASS J041519540935066 (2MASS J041509), the latest-type and coolest well-studied brown dwarf to date, with effective temperature K, we find evidence that ULAS J003400 is significantly cooler. First, the measured values of the near-infrared absorption spectral indices imply a later classification, of T8.5. Second, the [4.49] colour provides an empirical estimate of the effective temperature of K ( range). Third, the - and -band peaks are somewhat narrower in ULAS J003400, and detailed comparison against spectral models calibrated to 2MASS J041509 yields an estimated temperature lower by K relative to 2MASS J041509 i.e. K (), and lower gravity or higher metallicity according to the degenerate combination log [m/H] (). Combining these estimates, and considering systematics, it is likely the temperature lies in the range K. Measurement of the parallax will allow an additional check of the inferred low temperature. Despite the low inferred we find no evidence for strong absorption by NH3 over the wavelength range – m. Evolutionary models imply that the mass and age are in the ranges 15–36 and 0.5–8 Gyr, respectively. The measured proper motion, of /yr, combined with the photometrically estimated distance of 14–22 pc, implies a tangential velocity of 30 km s-1, a value consistent with expectation for the inferred age. ULAS J003400 is significantly bluer than 2MASS J041509 in , so future searches should allow for the possibility that cooler T dwarfs are bluer still.
keywords:
brown dwarfs – surveys
1 Introduction
In the decade since the first discovery of a T dwarf (Gl 229, Nakajima et al., 1995) over one hundred have been identified. Most have been discovered in the field, in large surveys, especially the Sloan Digital Sky Survey (SDSS; Strauss et al., 1999; York et al., 2000) and the Two Micron All Sky Survey (2MASS; Burgasser et al., 1999; Skrutskie et al., 2006). Burgasser et al. (2006a) provide a classification scheme that uses comparison against a set of spectral templates over the range T0 to T8, and measurement of a set of spectral indices that quantify the depth of H2O and CH4 absorption features in the , and bands. The known T dwarfs have temperatures in the range (Golimowski et al., 2004). To the end of 2006 only six dwarfs classified T7.5 or T8 had appeared in the literature. Saumon et al. (2006) and Saumon et al. (2007) made a detailed study of three of these cool T dwarfs, combining near- and mid-infrared photometry and spectroscopy to infer effective temperatures of , surface gravities of , and masses of .
The temperature range remains unexplored at present, but models such as those of Burrows et al. (2003) can be used to design searches for brown dwarfs beyond T8. Such very cool brown dwarfs are expected to have very low luminosities, to be extremely red in , and, at least for , to be blue in . Therefore they will be faint in both the and bands. Shortward of m, optical searches such as SDSS are clearly unsuited for detecting such very cool brown dwarfs. However, a JHK survey, such as 2MASS, is also far from ideal, as cool T dwarfs will typically be undetected in K. Samples of candidate cool T dwarfs selected as blue in , but detected in only these two bands can suffer from a high degree of contamination. As described by Hewett et al. (2006), the band (Hillenbrand et al., 2002; Warren & Hewett, 2002), between and , is a valuable addition to the and bands in a search for very cool T dwarfs. Fig. 2 of Hewett et al. (2006), and Fig. 1 of Lodieu et al. (2007), illustrate the fact that T dwarfs in the spectral range T3–T8 are much redder in than main sequence stars of similar colour, meaning that a broader range of spectral type of T dwarf may be identified than in a simple search, and with greatly reduced contamination. Whilst there is some uncertainty about the near-infrared colours of T8+ dwarfs, they should lie in a sparsely populated region of the vs. two-colour diagram, and so the extension of the T dwarf sequence to later types should be readily identifiable using these colours.
A wide-field near-infrared survey that is substantially more sensitive than 2MASS is needed to find such faint red objects, and this was one of several considerations which led to the development of the UKIRT Infrared Deep Sky Survey (UKIDSS; Lawrence et al., 2007). UKIDSS is a set of five surveys using the UKIRT Wide Field Camera (WFCAM; Casali et al., 2007) to obtain imaging of 20 per cent of the sky in a number of bands selected from the set – see Lawrence et al. (2007) for details. UKIDSS began in 2005, and is estimated to take seven years to complete. Three data releases have now taken place: the Early Data Release (EDR; Dye et al., 2006); the First Data Release (DR1; Warren et al., 2007a); and the Second Data Release (DR2; Warren et al., 2007b).
Of the five UKIDSS surveys, The Large Area Survey (LAS) is best suited to searching for very cool brown dwarfs. The LAS plans to cover 4000 within the SDSS footprint in the bands and has an average depth (to a signal–to–noise ratio (S/N) of five for point–sources) of . Critically, this is magnitudes deeper than 2MASS, meaning that the covered in by the LAS DR1 fields already probes a volume one fifth that of 2MASS.111The gain in depth in the H band, which sets the volume in a search for very cool brown dwarfs, is very similar to the gain in K.
A search for red point–sources in the UKIDSS EDR and DR1 LAS data has already yielded nine new spectroscopically–confirmed T dwarfs (Kendall et al., 2007; Lodieu et al., 2007) over the range T4 to T7.5. Here we report the discovery of a very cool brown dwarf, ULAS J003402.77005206.7 (hereafter ULAS J003400), that appears to have a later type, lower effective temperature and possibly lower mass than any other known T dwarf. The discovery process and follow-up photometric, astrometric, and spectroscopic observations are described in Section 2. In Section 3 we use a m spectrum to measure the object’s spectral type. In Section 4 we examine the spectral energy distribution (SED) of ULAS J003400 over the range m, using photometry in seven bands, to obtain an empirical estimate of its temperature. In Section 5 the near-infrared spectrum is compared to theoretical spectral models, providing estimates of the source’s fundamental physical properties, effective temperature, surface gravity, and metallicity, and thereby mass, and age, through the use of evolutionary models. In Section 6 we report the results of higher-resolution spectroscopy in the H band, to search for NH3 absorption. Section 7 provides a brief summary of our results.
2 Observations and data reduction
ULAS J003400 was identified as a candidate T dwarf after a largely automated search of the UKIDSS DR1 database (Section 2.1), after which follow-up photometry confirmed that its colours are consistent with that interpretation (Section 2.2). Photometry at mid-infrared wavelengths has been obtained (Section 2.3) and the proper motion has been measured using a one-year baseline (Section 2.4). Near-infrared spectroscopy reveals ULAS J003400 to be a brown dwarf of very-late spectral type (Section 2.5).
2.1 Identification
ULAS J003400 was discovered as a product of a general search of the UKIDSS DR1 catalogue for objects with extreme optical-to-near-infrared colours, including very cool brown dwarfs, as well as quasars of redshift (Hewett et al., 2006). The selection was made by a SQL query of the WFCAM Science Archive (WSA). A detailed description of the WSA, together with examples of SQL queries, is provided by Hambly et al. (2007). The first step in the search was to match the UKIDSS DR1 catalogue to SDSS DR5 (Adelman–McCarthy et al., 2007), retaining both unambiguous matches (within a match radius of 20) with , as well as UKIDSS sources with no SDSS counterpart. The sample was further restricted to point-like sources with . The sample was cleaned of cross-talk222Saturated images of bright stars observed by WFCAM produce electronic ghost images in nearby detector channels, at integer multiples of the detector channel spacing of 128 pixels. The phenomenon, known as cross-talk, is illustrated and described in more detail in Dye et al. (2006). Because ghosts appear at the same location in each of the UKIDSS filters they are often catalogued as being detected in multiple bands, but, since they are not real, they have no SDSS counterparts, thus masquerading as potentially interesting red sources. artefacts by rejecting sources located up to seven integer multiples of 512 in RA or dec from bright () 2MASS stars.
The UKIDSS DR1 includes LAS fields covering some within a section of the multiply-scanned SDSS Stripe 82 (the 212.5 deg2 defined by , , Stoughton et al., 2002). Therefore it was possible to obtain improved - and -band photometry of candidates within these fields (as described in Venemans et al., 2007). Most of the candidates were revealed to have colours consistent with their being M dwarfs and were thus rejected.

The resultant list of red point–sources could include both high-redshift quasars and brown dwarfs. We used the synthetic colours of Hewett et al. (2006) to divide the list into a sample of candidate quasars, with , and a sample of candidate brown dwarfs, with . Quasars of redshifts have predicted colours , , while mid to late T dwarfs have predicted colours , (Hewett et al., 2006). ULAS J003400 was located in the sample of quasar candidates, and stood out as the only candidate which remained undetected in any band in the co-added SDSS images.
The -band discovery image of ULAS J003400 is shown in Fig. 1. The UKIDSS DR1 point–source photometry (apermag3, Dye et al., 2006) is , , , (5 detection limit, established from the measured sky noise). The measured colours , , were ambiguous, the colour suggesting a quasar, and the colour suggesting a brown dwarf, and so a number of follow-up observations were made.
2.2 Optical and near-infrared photometry
To clarify the nature of the source, higher S/N images in the , , , and bands were obtained. The best photometry for the source across the wavelength range to is summarised in Table 1. Some additional photometry, subsequently superseded, is provided in the text, below.
The source was observed for 1800 s with filter in EMMI, at the NTT, on the night beginning 2006 August 18. This filter/detector combination is referred to here as and is similar to the SDSS band. To calibrate the image we first used the measured CCD sensitivity curve and the filter transmission curve to establish the colour relation between and SDSS and . Briefly, the AB magnitudes in the , , and bands of dwarf stars in the Gunn Stryker atlas (Gunn & Stryker, 1983) were computed by appropriate integration under the bandpasses, to establish the colour relation for dwarf stars from O to M. Photometry in and of SDSS DR5 sources in the field was then converted to , and the brightness of the source was measured by relative photometry using a fixed aperture, and is recorded in Table 1. We also computed the colours of some late T dwarfs with good spectrophotometry, to determine that ULAS J003400 would be about 0.2 mag. fainter in .
The offset to the Vega system is , computed by integrating the spectrum of Vega of Bohlin & Gilliland (2004) under the and bandpasses, adopting , and demanding i.e., zero colour for Vega.
| Band | mag. | Instrument | Date |
|---|---|---|---|
| EMMI | 2006–08–18 | ||
| WFCAM | 2005–10–04 | ||
| LIRIS | 2007–01–03 | ||
| LIRIS | 2007–01–03 | ||
| UFTI | 2006–09–02 |
The source was observed with the UFTI instrument (Roche et al., 2002) on UKIRT in and for 450 s each, on the night beginning 2006 August 7, and in for 1620 s, on the night beginning 2006 September 2. The data were calibrated using the UKIRT Faint Standards (Leggett et al., 2006). The filters are from the Mauna Kea Observatories set (MKO; Tokunaga et al., 2002), and the photometric system is virtually identical to the WFCAM system (Leggett et al., 2006). The data were reduced using the astronomical imaging pipeline ORAC-DR (Cavanagh et al., 2003).333The ORAC-DR Imaging Data Reduction User Guide is available at http://www.starlink.ac.uk/star/docs/sun232.htx/sun232.html. The result for is provided in Table 1. The other measures were , and . This are not provided in the table as they have been superseded (see below).
The blue colour , measured with UFTI, established that the source is a cool brown dwarf rather than a quasar. It was possible to estimate an approximate spectral type by comparing the measured colours , , with the table of synthetic colours and spectral types of T dwarfs from Hewett et al. (2006). We first convert to for ULAS J003400 by adding 0.2 (as above), and then convert to the Vega system by subtracting the AB offset of 0.533, from Table 4 in Hewett et al. (2006), yielding the approximate Vega colour . Taking the colours and spectral types of T dwarfs from Table 10 of Hewett et al. (2006), we found there is a correlation between each of the two colours and spectral type. From the measured colours of ULAS J003400, the errors, and the scatter in the relations, we estimated an approximate spectral type T. Accordingly the object was ranked as a high priority candidate for spectroscopy.
The target was reobserved at higher S/N in and with the LIRIS instrument (Acosta–Pulido et al., 2003) on the WHT, on the night of 2007 January 3. Integration times were 900 s and 1000 s respectively. These data were calibrated to the UKIDSS DR1 images using nearby bright unsaturated stars. We added an error of 0.02 mag. in quadrature to the random photometric errors, to account for the accuracy of the UKIDSS calibration. The results are provided in Table 1.
The colour of ULAS J003400 is rather blue in comparison with other T dwarfs found in UKIDSS. The average colour of the nine new spectroscopically confirmed T4 to T7.5 dwarfs listed in Kendall et al. (2007) and Lodieu et al. (2007) is 1.13. For completeness we note that the zero point of the UKIDSS Y photometry is under review. Preliminary analysis indicates that a constant 0.09 mag. should be added to the UKIDSS DR1 Y values, to place the photometry on the Vega system (Warren et al., 2007a). Nevertheless, recalibration will not, of course, alter the difference in colours quoted above.
2.3 Mid-infrared photometry
We obtained IRAC four-channel (3.55, 4.49, 5.73 and 7.87 m) photometry of the source on UT date 2006 December 26. The data were obtained as part of the Spitzer Space Telescope DDT program . All four channels have 256256-pixel detectors with a pixel size of 1212, yielding a 5252 field of view. Two adjacent fields are imaged in pairs (channels 1 and 3; channels 2 and 4) using dichroic beam splitters. The telescope is then nodded to image a target in all four channels.444For more information about IRAC, see Fazio et al. (2004) and the IRAC Users Manual at http://ssc.spitzer.caltech.edu/irac/descrip.html We used exposure times of 30 s and a 5-position medium-sized (52 pixels) dither pattern repeated ten times, for a total observing time of 57.6 minutes.
The data were reduced using the post-basic-calibration data mosaics generated by version 15 of the IRAC pipeline.555Information about the IRAC pipeline and data products can be found at http://ssc.spitzer.caltech.edu/irac/dh/ The mosaics were flat-fielded and flux-calibrated using super-flats and global primary and secondary standards observed by Spitzer.
We performed aperture photometry using an aperture with a 2-pixel (or 24) radius, to minimise the contribution from a faint source to the south-east. To assess the influence of the neighbouring source, we repeated the photometry using an aperture with a 4-pixel radius. After applying the appropriate aperture corrections, the results for the larger aperture are total fluxes 6 to 0 per cent brighter, for channels 1 through 4, respectively. Therefore contamination of the 2-pixel photometry by the neighbouring source will be at a level substantially below these values. To convert the 2-pixel fluxes to total fluxes, we applied aperture corrections as described in Chapter 5 of the IRAC Data Handbook3 of 1.205, 1.221, 1.363 and 1.571 to channels 1 through 4, respectively. The photometry was converted from milli-Janskys to magnitudes on the Vega system using the zero-magnitude fluxes given in the IRAC Data Handbook (280.9, 179.7, 115.0, and 64.1 Jy for channels 1 to 4, respectively). Note that IRAC observations are reported as a flux density at the nominal wavelengths given in Table 2, assuming that the target has a flux density . This assumption is not valid for T dwarfs and so the results given in the Table should not be used to derive a spectral flux at the nominal wavelength. However, if the mid-infrared spectral energy distribution is known, Cushing et al. (2006) show how the IRAC fluxes can be used to photometrically calibrate the spectrum – or compute the ‘color correction’, in the terminology of the IRAC Data Handbook.
Photometric random errors were derived from the uncertainty images that are provided with the post-basic-calibration data. The magnitudes and errors are given in Table 2. There are, in addition, systematic errors from a variety of sources (Reach et al., 2005), and the IRAC Data Handbook recommends citing uncertainty for the absolute calibration. This includes a contribution from the calculation of the ‘color correction’, which therefore does not apply here. Additional sources of uncertainty include: the accuracy of the absolute calibration (estimated to be by Reach et al., 2005), systematic errors introduced by pipeline dependencies (of comparable size, Leggett et al., 2007a), the variable pixel scale across the field of view, and the variation of the quantum efficiency across a pixel. For observations confined to near the centre of the array, the last two effects combined appear to be at a level of in an individual exposure, as measured from the scatter in repeat dithered observations (Fig. 3 in Patten et al., 2006), and therefore extremely small after averaging dithered observations. Accordingly, we adopt the total photometric uncertainty to be the sum in quadrature of the values given in Table 2 plus 3 per cent.
| Band | mag. |
|---|---|
| m | |
| 3.55 | |
| 4.49 | |
| 5.73 | |
| 7.87 |
2.4 Astrometry
The original DR1 YJHK images were all taken on the night beginning 2005 October 4, and serve as a first epoch for the measurement of ULAS J003400’s proper motion. Since the image has the highest S/N this is the best wavelength for a second–epoch image. The source name ULAS J003402.77005206.7 is derived, following the protocol of the International Astronomical Union, from the UKIDSS DR1 coordinates measured on the Y image of . The coordinates are calibrated to 2MASS, and are on the International Celestial Reference System. The absolute accuracy is better than 100 mas on each axis (Dye et al., 2006).
A deeper WFCAM J image was obtained on the night beginning 2006 December 4. The source was observed for 400 s, and was located on the same detector as for the first epoch, in order to minimise systematic errors due to distortion. The measured shifts in RA and dec relative to the first epoch, and the computed proper motion are provided in Table 3. We detect a significant proper motion of /yr.
The LIRIS -band image (Section 2.2), compared to the first epoch H image, provides an independent measure of the proper motion. The result, provided in the second line of Table 3, is consistent with the -band measure, but with a larger uncertainty. Rather than combine the two results, we retain the -band measure as the best estimate, because the differential systematic errors due to distortion should be smaller, since the two -band images were taken with the same instrument.
| Band | epoch 1 | epoch 2 | ||||
|---|---|---|---|---|---|---|
| /yr | /yr | |||||
| 2005–10–04 | 2006–12–04 | |||||
| 2005–10–04 | 2007–01–03 |
2.5 Spectroscopy

2.5.1 GNIRS low-resolution spectrum
The Gemini Near-Infrared Spectrograph (GNIRS; Elias et al., 2006) on Gemini South was used to make quick response observations of ULAS J003400, through program GS-2006B-Q-36. GNIRS was used in cross-dispersed mode with the 32 l/mm grism, the slit and the short camera, to obtain 0.9–2.5 m R500 spectra. Two triggers were made on the target, providing a shorter and longer total integration time of 16 and 58.7 minutes, on the nights of 2006 August 26 and 2006 Oct 1, respectively. The target was nodded 30 along the slit in an “ABBA” pattern using individual exposure times of 240 s and 220 s respectively. Calibrations were achieved using lamps in the on-telescope calibration unit. Early F stars were observed as telluric standards, at an airmass that matched the mid-point airmass of the target observation.
Data reduction was initially undertaken with tasks in the Gemini GNIRS IRAF Package. The cross-dispersed spectrum comprises five highly curved spectra, spatially separated, that correspond to different grating orders over the wavelength of interest. The reduction procedure included correction for offset bias, order separation, median stacking at the A and B positions, sky subtraction, S-distortion correction (i.e. straightening the curved spectra), and wavelength calibration. The data were not flat-fielded. Apart from bad pixels, the variation of the array quantum efficiency is sufficiently small that flat-field correction makes no discernible reduction in the noise in the spectra. Further reduction was carried out in IDL. Sky residuals were fit, and subtracted, using a surface constructed via a series of linear fits across the slit (excluding pixels within the spectral apertures). Spectra were then extracted within apertures and summed for the A and B positions. Noise spectra were also extracted. The spectra were sigma-clipped and calibrated onto a relative flux scale using the spectrum of the telluric standard (after appropriate interpolation across any hydrogen absorption lines) and a black–body function for K. The spectral orders were then trimmed of their noisiest portions, and the spectrum was scaled to absolute flux by the -band photometry. The final spectrum consists of an average of the longer and shorter triggered observations, weighted by exposure time.
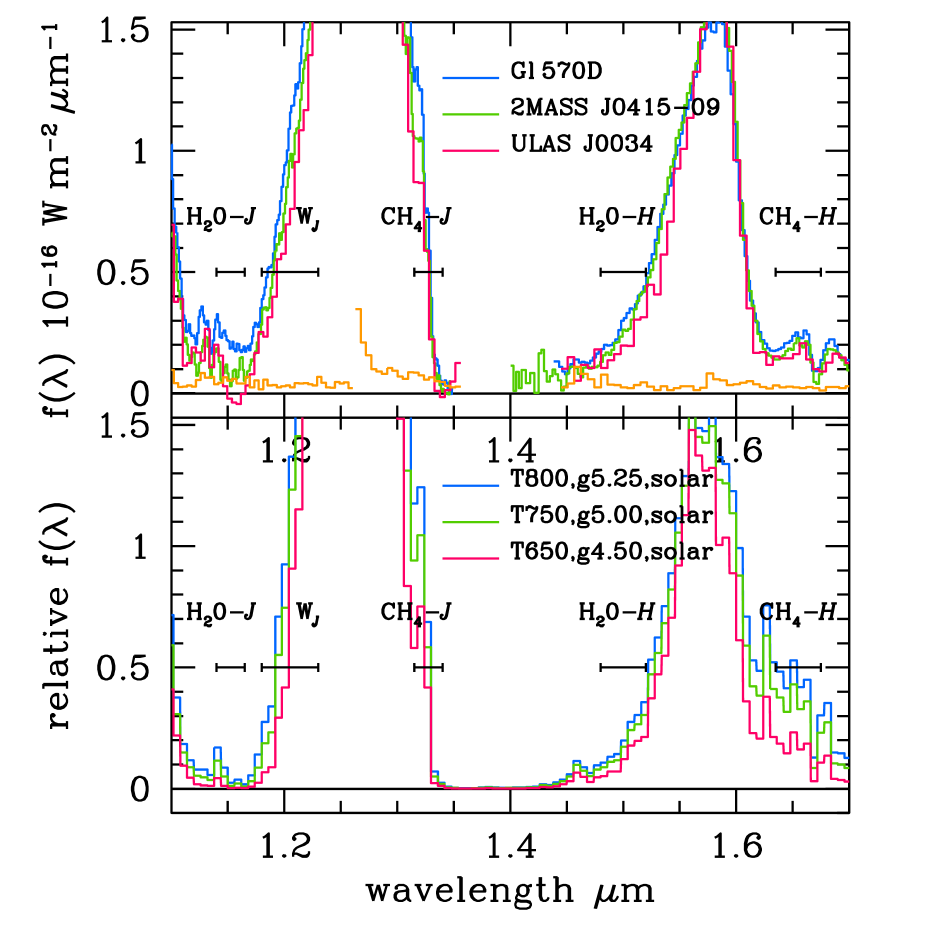
The pixel scale oversamples relative to critical sampling by a factor three (the slit is 6.7 pixels wide). Because the spectrum S/N is relatively low, and bearing in mind that the principal diagnostic features are broad, for the purposes of display the spectrum has been binned by a factor of 12 (i.e. two resolution elements per pixel). The complete spectrum is shown as the magenta line in the upper panel of Fig. 2, where it is compared to the spectra of two well-known very cool brown dwarfs, the T7.5 dwarf Gl 570D, discovered by Burgasser et al. (2000), and the T8 dwarf 2MASS J041509, discovered by Burgasser et al. (2002). The comparison spectra are from Geballe et al. (2001) and Knapp et al. (2004), respectively. The comparison spectra are of comparable resolution to the GNIRS spectrum. The lower panel plots model spectra, and is discussed in Section 5.2. Fig. 3 provides a zoom of the absorption troughs either side of the J and H peaks.
We synthesised colours from the spectrum, following the procedure described by Hewett et al. (2006). Briefly, this involves integration of the spectrum under the passband response curves, with appropriate normalisation by the same integration performed on the spectrum of Vega. The resulting colours are as follows, and are in satisfactory agreement with the measured values, provided in parentheses: , , . As previously noted the measured colour is unusually blue. The synthetic colour corroborates this finding. The synthetic colours of Gl 570D and 2MASS J041509 are and respectively (Hewett et al., 2006).
2.5.2 ISAAC intermediate-resolution spectrum
An intermediate-resolution spectrum covering the wavelength range m was obtained with the ISAAC instrument on the ESO VLT using Director’s Discretionary Time, under programme 278.C-5014(A). The purpose of the spectrum was to search for additional absorption lines in comparison with the spectrum of 2MASS J041509, that could explain the excess absorption seen in the low-resolution spectrum of ULAS J003400 (Figs 2 and 3), and might be due to NH3. We used the MR grating and a slit, providing a nominal resolving power of . The average seeing was , meaning that the actual resolving power was nearer 4000. The dispersion was 0.807Å, corresponding to pix per resolution element.
The source was observed on the nights beginning 2007 Jan 3 and 11. On each night, integrations of 600s each were obtained at four separate slit positions, providing a total of 80min on source. As described in Weatherley et al. (2005) higher S/N can be achieved with multiple slit positions, compared to the traditional method of observing in ABBA sequence and subtracting in pairs. For each slit position a sky frame was created by averaging the three other frames from the same night, and was subtracted. The data were then flat-fielded, and improved sky subtraction achieved by fitting a function up each line. All eight frames were then registered to the nearest pixel spatially and spectrally, scaled to a common count level, and averaged, ignoring bad pixels. Wavelength calibration was achieved using the sky lines, and was found to be linear to better than a pixel. Therefore rebinning was not required in applying the wavelength solution. Observations of standard stars were used to correct for atmospheric absorption (everywhere less than 10 per cent over this wavelength region), and to calibrate onto a relative flux scale. Absolute calibration was achieved by scaling to the GNIRS spectrum.
The spectrum is discussed later in Section 6, where the flux-calibrated spectrum, together with the error spectrum, is plotted in Fig. 8.
| Band | numerator | denominator | value | T8 | type |
|---|---|---|---|---|---|
| wavelength | wavelength | range | |||
| m | m | ||||
| H2O | 1.14 1.165 | 1.261.285 | T8.5 | ||
| CH4 | 1.3151.34 | 1.261.285 | T8.5 | ||
| H2O | 1.48 1.52 | 1.561.6 | T8.5 | ||
| CH4 | 1.6351.675 | 1.561.6 | T8 | ||
| CH4 | 2.2152.255 | 2.082.12 | T7 |
3 Spectral type
To determine the spectral type we follow the revised classification scheme for T dwarfs of Burgasser et al. (2006a) which unifies and refines the two independent preliminary classification schemes of Geballe et al. (2002) and Burgasser et al. (2002), both of which are grounded in the methodology of Morgan & Keenan (1973). Classification is based on the depth of the absorption bands due to H2O and CH4 in the near-infrared, between the Y, J, H, and K peaks, which strengthen towards later spectral types, and are nearly saturated by T8. Classification is achieved by comparison of the object spectrum against a set of template spectra, or from the measured values of a set of spectral indices that quantify the strength of the absorption.
In Figs. 2 and 3 the spectrum of ULAS J003400 is compared against that of the T8 spectral template, 2MASS J041509. Also plotted is the spectrum of the well studied brown dwarf Gl 570D, classified as T7.5 by Burgasser et al. (2006a). The three spectra have been scaled to the crown of the J-band peak. There is visibly a progressive narrowing of the J-band peak in moving from Gl 570D, to 2MASS J041509, to ULAS J003400, as well as successively stronger absorption in the H2O trough near m. If the spectra were instead normalised to the H-band peak the same sequence would be evident in the blue wing of the peak, near m. This visual comparison rules out a spectral type as early as T7.5 for ULAS J003400, and suggests a classification of T8 or T8.5.
The -band peak is relatively stronger in both ULAS J003400 and Gl 570D, compared to 2MASS J041509, but this region is not used in current spectral classification schemes. A weak absorption feature in the spectrum of ULAS J003400 near 2.0 m coincides with a strong telluric band, and is probably not intrinsic to the source.
Besides comparison against template spectra, we have also measured the (primary) spectral indices defined by Burgasser et al. (2006a), and these are given in Table 4. The first three indices imply a classification of T8.5, the fourth gives T8 and the fifth, CH4, saturates at T7, and therefore is not useful for this source. Taken together the indices suggest that T8.5 is the appropriate class. This is in agreement with the value from the template comparison, and therefore is our adopted value.
Although the precision of the classification scheme itself is only 0.5 of a class, this is the first brown dwarf discovered with a classification later than T8. For this reason we have investigated the uncertainty in the class in a formal way, treating class as a continuous variable. Then the value of each index and its uncertainty, together with the mean and range of the parameter defining the T8 class, provide four estimates of the parameter. An unweighted mean of the four estimates yields a class T8.50.1 (error on the mean). For the weighted mean the uncertainties on the indices were doubled, to force (for three degrees of freedom), which led to the result T8.40.1. A systematic error in the sky subtraction, summed over any band, could make a larger contribution to the error budget. Nevertheless this analysis supports the result from the template comparison that the class cannot be earlier than T8.


4 Effective temperature estimate from the spectral energy distribution from 1–8 m
The SED over the range 1–8 m, measured by the broad-band photometry, provides further evidence of the extreme nature of ULAS J003400. Patten et al. (2006) and Leggett et al. (2007a) note relations between various colours within this wavelength range and spectral type, luminosity, and effective temperature. ULAS J003400 is more extreme than 2MASS J041509 in nearly all the colours plotted. In Fig. 4 we plot the photometry in the bands plus the four IRAC bands for ULAS J003400 and for 2MASS J041509. For the latter the data were taken from Patten et al. (2006), and we note that, as for ULAS J003400, the photometry is on the MKO system (no -band photometry for this source exists as far as we are aware). The datapoints in Fig. 4 should only be interpreted in a relative sense because, as described in Section 2.3, the IRAC magnitudes are not equivalent to the corresponding flux at the nominal filter wavelength. The SED of ULAS J003400 is significantly redder over the entire wavelength range plotted, indicative of lower temperature. For example, colours for ULAS J003400 (2MASS J041509) are as follows; , , .
The absorption bands of H2O and CH4 which define the T spectral sequence are nearly saturated at T8. This means that spectral changes in the near-infrared may be relatively insensitive to temperature for objects cooler than 2MASS J041509. Therefore it is conceivable that ULAS J003400 is substantially cooler than 2MASS J041509, despite the rather small near-infrared spectral differences. In order to estimate we have compiled a sample of L and T dwarfs that possess good temperature estimates, as well as photometry in the seven bands from J to [7.87] plotted in Fig. 4. Temperatures are taken from Golimowski et al. (2004); Luhman et al. (2007); Leggett et al. (2007b), and photometry from Patten et al. (2006); Leggett et al. (2007a); Luhman et al. (2007). We then plotted against all possible colour combinations, looking for the best correlation. We avoided the K-band because the flux in this band is sensitive to both gravity and metallicity at fixed temperature (e.g. Liu et al., 2007).
In Fig. 5 we plot against the H[4.49] colour for L and T dwarfs with K. The L dwarfs become redder in H[4.49] towards cooler , but there is a discontinuity in the relation at the L/T transition, reflecting the strong spectral changes that occur over a small temperature range. Nevertheless for later T dwarfs with K there is a remarkably tight correlation. The RMS deviation from the best-fit linear relation, plotted in the figure, is only 28 K. The sample plotted includes the peculiar T6 dwarf 2MASS J0937+29. The K-band flux of this object is strongly suppressed (Burgasser et al., 2002), due either to high gravity or low metallicity or both (Burgasser et al., 2006b). The object is the most distant outlier in Fig. 5, located at K, H[4.49] . Nevertheless it lies only 52 K above the line, i.e., at . This hints that for mid and late T dwarfs the H[4.49] colour is relatively insensitive to variations in gravity and metallicity.
Other than ULAS J003400, the reddest object plotted in Fig. 5 is 2MASS J041509, which has and an effective temperature of K. ULAS J003400 is considerably redder, with H[4.49] , implying that it is correspondingly cooler. Extrapolating the linear fit provides a temperature estimate K for ULAS J003400. The lower panel in Fig. 5 is a zoom of the region of interest. Also shown are model tracks in this parameter space, computed from the synthetic spectra described in Section 5, for a range of gravities (parameterised by log ), and metallicities [m/H]. Over the temperature range K the model tracks fit the data well, while the small scatter between the tracks implies that the small scatter seen in the data is not simply fortuitous, but because the H[4.49] colour is indeed relatively insensitive to variations in metallicity and gravity. The model tracks remain linear to cooler temperatures K, providing some justification for extrapolating the linear fit to the data. In fact the tracks are somewhat steeper than the linear fit to the data, which implies a temperature even lower than 600 K. We defer a more detailed discussion of the models in the mid-infrared region until completion of scheduled mid-infrared spectroscopy.
Assuming the linear extrapolation of the colour–temperature relationship to be valid, ULAS J003400 could have a comparable temperature to 2MASS J041509 only if it were a outlier. In this respect it would be more extreme than 2MASS J0937+29 (mentioned above), and, if it was anomalous for the same reasons, its K-band flux ought to be even more strongly suppressed, which is not seen.

5 Fundamental parameters from spectral modelling
In this section we compare synthetic near-infrared spectra to the observed GNIRS spectrum of ULAS J003400, in an attempt to constrain effective temperature , surface gravity, and metallicity. If and log can be constrained then mass and age can also be constrained, from evolutionary models.
The distance to ULAS J003400 is currently unknown and therefore, in comparing against model spectra, the constraint provided by the normalisation of the spectrum is not available. Together with the limitations of the spectral models (principally opacity uncertainties, described below) this precludes the accurate measurement of parameters , log , and [m/H] for ULAS J003400 by direct comparison of synthetic spectra to data alone. To overcome these limitations we have chosen to use the recent detailed modelling of 2MASS J041509 by Saumon et al. (2007) as a benchmark. Then to estimate parameters for ULAS J003400, we compare differences in the measured spectra between 2MASS J041509 and ULAS J003400, with differences in the model spectra, as parameters are changed away from the fiducial values for 2MASS J041509. Put another way, the models are calibrated to 2MASS J041509. The rationale, and the method itself, are similar to the procedure developed by Burgasser et al. (2006b), but with significant differences.
We first provide details of the spectral models, and then present the results of the model fits. Combinations of , log , and [m/H] are denoted e.g. [750, 5.0, 0.0].
5.1 The BT-Settl models of T dwarf spectra
The model atmospheres used to generate the theoretical T dwarf spectra for this comparison were generated with version 15.3 of the general-purpose stellar atmosphere code PHOENIX (Hauschildt & Baron, 1999). For the present models we use a setup that gives the currently best fits to observed spectra of M, L, and T dwarfs, updating the microphysics used in the GAIA model grid Kučinskas et al. (2005, 2006).
We adopt the solar abundances of Grevesse & Sauval (1998). Several recent studies of line formation in the solar atmosphere have determined carbon, oxygen and nitrogen abundances nearly a factor of two lower (Asplund et al., 2004; Asplund et al., 2005; Allende Prieto, 2007). However these revisions have been found to be in conflict with other observations and models of the solar atmosphere, such as studies of the carbon monoxide bands (Ayres et al., 2006), and in particular with helioseismology-based models of the solar interior (e. g. Delahaye & Pinsonneault, 2006). The issue of the solar abundance scale for C, O and probably N, is therefore far from settled. Since the opacity in an essentially dust-free T dwarf atmosphere is largely dominated by the molecular bands of H2O, CH4, and to some extent NH3, it is the relative abundance of CNO that primarily determines the structure and spectral energy distribution of these objects. A reduction of just these three elements by a factor of two is thus almost equivalent to decreasing the overall metallicity to [m/H]=0.3 on the Grevesse & Sauval (1998) scale, i.e. the solar-metallicity models presented here are nearly identical to metal-rich models of [m/H]=+0.3 based on the Asplund et al. (2005) solar abundances.
The equation of state (EOS) is an updated version of that used in Allard et al. (2001), including species of atoms, ions and molecules as well as allowing for the formation and dissolution of grain species. One major update improves on the ‘Cond’ limit of treating the EOS and the opacity of condensates, described in Allard et al. (2001), which handled the absence of dust clouds from the visible photosphere at low by omitting their opacity from the radiative transfer calculations, while still treating their formation in thermodynamical and chemical equilibrium. The more realistic ‘Settl’ treatment self-consistently includes the gravitational settling, sedimentation or rainout, of condensates, which results in a cloud layer retreating to larger optical depths as decreases (Allard et al., 2003; Homeier et al., 2005; Allard et al., 2007c). In particular this provides a more realistic description of the depletion of refractory elements from the atmosphere.
The water line opacities are taken from the calculations of Barber et al. (2006, BT), found to be giving the best overall fit to the water bands over a wide temperature range.
Obtaining accurate and complete opacity data of CH4 and NH3 has generally been a much greater challenge. The current models include the latest linelists calculated with the Spherical Top Data System (Wenger and Champion, 1998, STDS) to account for the principal infrared bands of methane (Homeier et al., 2007b). But coverage of the hot bands in the near-infrared, at 2.1–2.5 m and especially at 1.5–1.7 m, is limited since the higher vibrational levels contributing to these transitions have yet to be modelled. Semi-empirical corrections based on high-temperature simulations and laboratory measurements (Borysow et al., 2002; Brown, 2005) have been included to account for this incompleteness. The situation is even worse for the 1.0–1.5 m region, where only low-temperature linelists with mostly unknown ground state energies are available and opacities at brown dwarf temperatures can only be estimated. NH3 shows comparable problems starting already at 1.9–2.1 m, with most of the lower states unknown for the 1.4–1.7 m bands. These models and the quality of the opacity data are evaluated in more detail in comparison to the two late T dwarfs Gl 570D and 2MASS J041509 by Homeier et al. (2007a).
Another important recent improvement in the PHOENIX models is the inclusion of new atomic line profile data based on more accurate interaction potentials. These profiles have improved the fits to observed spectra significantly over the standard model of a Lorentzian line shape at large detunings Allard et al. (2003); Burrows & Volobuyev (2003). We use a detailed and depth-dependent line profile for each of the alkali resonance lines (Li, Na, K, Rb, Cs D1 and D2, respectively) in our calculations. This is particularly important for the optical spectrum, being entirely dominated by line blanketing due to the massively broadened Nai and Ki doublets which in T dwarfs extend all the way out to the peak of the -band, i.e. beyond 1 m. In the models presented here we have used the alkali line profiles described in Allard et al. (2003, 2005); Allard & Spiegelman (2006); Allard et al. (2007b, a) and Johnas et al. (2007), which give a much improved representation of the details of these line shapes.
The quality of the match of these so-called ‘BT-Settl’ models to real spectra may be gauged by examining Figs 2, 3, and 6. In Fig. 6 we compare the best-fit model for ULAS J003400 determined from the spectral comparison below. The fit is rather good. At somewhat higher temperatures the inadequacy of the CH4 opacities manifests itself in the wavelength range m, as is particularly evident in comparing the top and bottom panels in Fig. 3. Another region where the fit is relatively poor is the wavelength range m.
In their detailed modelling of three cool brown dwarfs Saumon et al. (2006) and Saumon et al. (2007) have found evidence for non-equilibrium effects in the carbon and nitrogen chemistry of their atmospheres due to the dredge-up of CO and N2 from deeper and hotter layers into the photosphere by turbulent mixing. This is parameterized by an eddy-diffusion coefficient in their models. From analysis of the mid-infrared spectra they conclude that NH3 is strongly diluted in the upper atmosphere due to this effect, and CO is significantly enhanced, requiring cm2 s-1. We have included this quenching of the chemical equilibrium in a similar way, deriving mixing timescales from the same convective overshoot velocity field that is also used in our modelling of the cloud formation and settling processes, and find a similar dilution of NH3 in the mid-infrared. The effects of this dilution are also evident in the near-infrared bands of NH3, leading to considerably less absorption at 1.45 – 1.55 m and 1.9 – 2.1 m than otherwise expected.

5.2 Spectral comparison
| Index | Gl 570D | 2MASS J041509 | ULAS J003400 | HD 3651B |
|---|---|---|---|---|
| 0.346 | 0.310 | 0.2620.006 | 0.342 | |
| / | 1.116 | 1.000 | 0.8450.021 | 1.103 |
| K/J | 0.113 | 0.134 | 0.1280.003 | 0.147 |
| K/J / K/J(J0415) | 0.845 | 1.000 | 0.9600.022 | 1.097 |
To estimate the fundamental physical parameters for ULAS J003400 we use the new model spectra, and follow a procedure similar to that developed by Burgasser et al. (2006b). These authors created a grid of solar-metallicity spectral models, for which they measured a pair of spectral indices: the H2O index (Table 4), and an index K/H measuring the ratio of the heights of the K and H peaks. The same indices were measured for Gl 570D for which the properties , log , [M/H] are well determined (Geballe et al., 2001; Saumon et al., 2006). The indices measured for the model with these properties are not identical to the indices measured on the actual spectrum, because the models are not perfect. For each of the two indices, the ratio of the actual index over the model index provides a scaling, which is used to calibrate the grid of model indices. The properties , log , of any cool brown dwarf are then determined by comparing the measured indices against the calibrated model indices, and determining the best fit. An advantage of the method is that it does not require the distance of the object to be known, since the spectral indices record flux ratios. Nevertheless the effect on the measured parameters of varying metallicity away from solar was not explored (except for one source).
Interestingly, Burgasser et al. (2006b) estimated a value of K for the T8 dwarf 2MASS 09392448 and the T7.5 dwarf 11142618, lower than the effective temperature determined for 2MASS J041509. Recently Leggett et al. (2007b) re-examined the spectra of these two sources in detail. They argued that the best fits were achieved with K, and sub-solar metalicity [M/H], and suggested that the method of Burgasser et al. (2006b) needs to be revised to take metallicity into account.
In our comparison we also employ two indices. The first is the K/J index of Burgasser et al. (2006b), defined as
| (1) |
where denotes the integrated flux between and . For the second index we chose not to use H2O, because of the very limited dynamic range available at temperatures K, since the absorption is practically saturated. Referring to Figs 2 and 3, we define an index which characterises the width of the J-band peak, and is defined by
| (2) |
where the factor of 2 in the denominator compensates for the wider band of the numerator.
The measured values of the two indices for the three sources Gl 570D, 2MASS J041509, and ULAS J003400 are provided in Table 5. For interest we have also provided the measured values for the T7.5 dwarf HD 3651B (Mugrauer et al., 2006). A brief discussion of this source is provided at the end of this section, but for the remainder we consider only the first three sources. The table includes the measured indices, as well as the values normalised to the measured indices of 2MASS J041509. The published spectra of Gl 570D and 2MASS J041509 are of much higher S/N than the spectrum of ULAS J003400 we have obtained, so the lack of error spectra for Gl 570D and 2MASS J041509 is unimportant in this analysis. The K/J indices for the three sources are all quite similar, while for the measured index decreases through the sequence Gl 570D, 2MASS J041509, ULAS J003400, quantifying the progressive narrowing of the J-band peak visible in Figs 2 and 3.
The normalised indices from Table 5 are plotted in Fig. 7, where the dotted lines outline the ranges for ULAS J003400, along with a grid of solar-metallicity spectral models. The grid has been scaled to the data by associating the model [750, 5.00, 0.0] with 2MASS J041509, and normalising the indices of all the other models to the measured values for this model. Choosing a different model to represent 2MASS J041509 merely has the effect of shifting (and slightly distorting) the grid in this space such that the new reference model lies at . In this way it can be seen that the locations of Gl 570D and ULAS J003400 imply temperature and gravity differences relative to 2MASS J041509 that are, due to the regularity of the grid, almost independent of the actual model chosen to represent 2MASS J041509. The plot illustrates the fact that the two indices provide complementary information on the two parameters and log , at fixed metallicity. The effect of decreasing temperature alone is a decrease in both and , while decreasing gravity alone causes a decrease in , but an increase in .
If 2MASS J041509 and ULAS J003400 have similar metallicity, the plot indicates that ULAS J003400 has between 60 and 120 K cooler, and log between 0.25 and 0.5 lower. Because only two indices are used, the three parameters , log , [M/H] cannot be determined independently. The effect of varying metallicity is illustrated in Fig. 7, by reference to the model [650, 4.75, 0.0]. The dashed line through this model shows the effect of varying the metallicity over the range [m/H]. Because the line approximately follows the line of constant gravity, varying metallicity has little effect on the temperature estimate, but, rather, is nearly degenerate with gravity. This degeneracy may be described by the relation (log [m/H]. Therefore ULAS J003400 is of lower gravity or higher metallicity than 2MASS J041509 as described by the limits (log [m/H].666Liu et al. (2007) find a similar amplitude for the degeneracy between metallicity and surface gravity determination, based on empirical comparison of the T7.5 dwarfs Gl 570D and HD 3651B and on examination of the multi-metallicity models of Burrows et al. (2006).
The properties of 2MASS J041509 were determined by Saumon et al. (2007) to lie along a narrow line from , log of 725, 5.00 to 775, 5.37. Adopting 750, 5.20 for 2MASS J041509 implies ( range) for ULAS J003400. The temperature estimate from the spectral modelling is in good agreement with the estimate derived from the H[4.49] colour of K ( range). Combining these two independent estimates gives an estimate ( error), where the uncertainty reflects the random errors in the GNIRS spectrum, and the mid-infrared photometry, but takes no account of the uncertainties in the spectroscopic models, in the extrapolation of the temperature-colour relation (Fig. 5), and in the temperature of 2MASS J041509. On the other hand since the spectroscopic models are calibrated to 2MASS J041509 at 750 K, it seems very unlikely that ULAS J003400 is hotter than 700 K. We adopt the conservative ranges K, and log , assuming solar metallicity, as the final estimate of the effective temperature and gravity of ULAS J003400. Confirmation of this low effective temperature will require mid-infrared spectroscopy, and measurement of the parallax, both of which are scheduled.
One of the models within the above ranges is [650, 4.5, 0.0]. The synthetic spectrum generated with these parameters reproduces the observations quite well (given the known opacity problems), as shown in Fig. 6.
Finally we note that the indices listed in Table 5 for Gl 570D and for HD 3651B suggest that the latter is some 50 K warmer. Liu et al. (2007) argued that HD 3651B is of higher gravity than Gl 570D, in which case the relative values of the two indices indicate that HD 3651B must also have higher metallicity, in agreement with their findings.

5.3 Distance, age and mass
Saumon et al. (2007, their Fig. 3) plot isochrones and isomass sequences as a function of and log . They also demonstrate that photospheric metallicity does not significantly impact the evolutionary parameters in this diagram. The ranges in and log of 600–700 K and 4.5–5.1, determined above, correspond to ranges in [age (Gyr), mass ()] of [0.5, 15] to [8, 36]. Hence ULAS J003400 is likely to be less massive and less luminous than 2MASS J041509, for which Saumon et al. determine a mass of 33–58 .
The distance of ULAS J003400 may be estimated from the modelled surface fluxes and brown dwarf radii. Normalising the models to the peak of the band implies a distance of 14–24 pc for the ranges in effective temperature and surface gravity given above. This is consistent with the observed correlation between absolute magnitude and spectral type shown for example in Figs. 8 and 9 of Knapp et al. (2004). The measured proper motion of /yr then translates into a tangential velocity of 25–42 km s-1, suggesting membership of the younger disk population (e.g. Eggen, 1998), which is consistent with the age range of 0.5–8 Gyr derived from the temperature and gravity above.
6 Search for NH3 in the -band
Absorption by NH3 is potentially a valuable diagnostic of the conditions in the atmospheres of very cool brown dwarfs (Burrows et al., 2003). NH3 absorption was first convincingly detected in a mid-infrared spectrum of Indi Bab (Roellig et al., 2004), and subsequently in all the dwarfs of spectral type T2 or later, observed by Cushing et al. (2006) in the mid-infrared. The search for and the interpretation of NH3 absorption in the near-infrared is made difficult by the shortcomings in the line lists referred to previously. Saumon et al. (2000) report the detection of very weak NH3 absorption in the H and K bands in the spectrum of the T7p dwarf Gl229B. The weakness of the features was interpreted as a consequence of nonequilibrium chemistry. This finding is corroborated by analysis of NH3 absorption in the mid-infrared spectrum of Gl 570D (Saumon et al., 2006). At lower temperatures NH3 should strengthen, and its detection would be a valuable aid in further developing the spectral models of dwarfs with K. The NH3 absorption may develop into a sufficiently strong spectral feature (Burrows et al., 2003) that it will be incorporated into future schemes for classification beyond T8, possibly motivating the creation of a new spectral type (but see discussion in Leggett et al. (2007b)). Our motivation for obtaining a higher-resolution spectrum in the H band was to investigate whether the excess absorption seen in the low-resolution spectrum in the blue wing of the H-band peak is resolved into absorption lines of NH3 at higher resolution.
The ISAAC spectrum of ULAS J003400 is reproduced in Fig. 8. For the purposes of the plot the spectrum has been binned by a factor of five, to reduce the noise, so the plotted spectrum is undersampled relative to critical sampling by a factor of about two. The thin line shows the error spectrum for this binning. When further binned to match the sampling of the GNIRS spectrum, the two spectra are in close agreement, confirming the excess absorption relative to 2MASS J041509. The dotted line in the figure plots the intermediate resolution spectrum of 2MASS J041509 from McLean et al. (2003), scaled to match ULAS J003400 over the wavelength range m. The overall match between the two spectra is rather close, in terms of detailed features. Nevertheless, a general depression of the spectrum of ULAS J003400 shortward of m is evident. To assess the reality of any possible absorption lines we subtracted the spectrum of 2MASS J041509. We then ran a boxcar filter of width seven (original) pixels (5.6Å) over the difference spectrum and the variance spectrum, and created a S/N spectrum for an absorption line of this width. Three candidate absorption lines at S/N were detected, at wavelengths 1.5323 m, 1.5365 m (the most significant), and 1.5491 m. These three lines are marked in Fig. 8. Using a broad 50 Å filter, we also detect a significant feature centred near 1.512 m. This lies near the wavelength of a feature in the NH3 laboratory spectrum (Leggett et al., 2007b), although there are also many strong lines of H2O absorption in this region. While these lines appear to be real, and could be due to NH3, they are quite weak. There is no obvious strong feature apparent in the spectrum which would suggest that ULAS J003400 is radically different, requiring a new spectral type. Leggett et al. (2007b) have recently addressed the question of where the strongest NH3 features may appear in the spectra of very cool brown dwarfs, and concluded that the Y-band and J-band peaks may be a more promising region to search.
7 Summary
We have reported the discovery of the T dwarf ULAS J003400, discovered in UKIDSS DR1, which has a spectral type of T8.5 and an effective temperature of K, making it the latest and coolest T dwarf known at the present time. In particular it is K cooler than 2MASS J041509 and probably also has lower luminosity and lower mass. Despite the low inferred temperature, an intermediate-resolution spectrum in the -band failed to reveal convincingly the presence of absorption by NH3, although similar spectroscopy of the - and -band peaks may be more revealing. It will be extremely valuable to measure the parallax of ULAS J003400, in order to confirm the estimated temperature without recourse to somewhat uncertain spectroscopic models. High-resolution imaging of ULAS J003400 will be similarly important to establish whether it is isolated.
The area covered by the UKIDSS LAS will expand by a factor of 20 over the next few years, so prospects for finding even cooler brown dwarfs are extremely good. However the unexpectedly blue colour of ULAS J003400 should be taken into account in designing future searches for such ultra-cool dwarfs. While all the current models predict that ultra-cool T dwarfs become bluer in with decreasing temperature (Hewett et al., 2006), they are somewhat discrepant in their predictions for how varies with temperature: the models of Burrows et al. (2003) initially tend towards redder ; those of Marley et al. (2002) show a weak trend to bluer ; and the BT-Settl models show a stronger trend to bluer down to K. Given the relative depths in the bands in UKIDSS (Warren et al., 2007a), searches for very cool brown dwarfs should allow for the possibility that they are detected only in the and bands – one of several issues that should be clarified as more of these objects are discovered.
Acknowledgments
We are grateful to the anonymous referee for a very detailed report, including numerous suggestions that have improved the presentation. We would also like to thank the staffs of the Joint Astronomy Centre, Hawai’i, of the Cambridge Astronomical Survey Unit, and of the Astronomy Technology Centre and the Wide Field Astronomy Unit in Edinburgh, all of whom contributed to the creation of UKIDSS. We thank the ESO Director General and the Director of the Spitzer Space Telescope for awards of Director’s Discretionary Time. Results reported here are based on observations obtained at the Gemini Observatory, through program GS-2006B-Q-36. Gemini Observatory is operated by the Association of Universities for Research in Astronomy Inc. (AURA), under a cooperative agreement with the NSF on behalf of the Gemini partnership: the National Science Foundation (United States), the Particle Physics and Astronomy Research Council (United Kingdom), the National Research Council (Canada), CONICYT (Chile), the Australian Research Council (Australia), CNPq (Brazil) and CONICET (Argentina). SKL is supported by the Gemini Observatory, operated by AURA on behalf of the international Gemini partnership. MCL acknowledges support for this work from NSF grants AST-0407441 and AST-0507833 and an Alfred P. Sloan Research Fellowship.
References
- Acosta–Pulido et al. (2003) Acosta–Pulido, J., et al., 2003, ING Newsletter, 7, 15
- Adelman–McCarthy et al. (2007) Adelman–McCarthy J. K., et al., 2007, ApJS, in press
- Allard et al. (2001) Allard F., Hauschildt P., Alexander D., Tamanai A., Schweitzer A., 2001, ApJ, 556, 357
- Allard et al. (2003) Allard N. F., Allard F., Hauschildt P. H., Kielkopf J. F., Machin L., 2003, A&A, 411, L473
- Allard et al. (2003) Allard, F., Guillot, T., Ludwig, H.-G., Hauschildt, P. H., Schweitzer, A., Alexander D. R., Ferguson, J. W., 2003, in Brown Dwarfs, Proceedings of IAU Symposium 211, held 20-24 May 2002 in Waikoloa, Hawai’i. Edited by Eduardo Martín. San Francisco: Astronomical Society of the Pacific, p. 325.
- Allard et al. (2005) Allard N. F., Allard F., Kielkopf J. F., 2005, A&A, 440, 1195
- Allard & Spiegelman (2006) Allard, N. F. & Spiegelman, F. 2006, A&A, 452, 351
- Allard et al. (2007a) Allard, N. F., Spiegelman, F., & Kielkopf, J. F. 2007a, A&A, 465, 1085
- Allard et al. (2007b) Allard, N. F., Allard, F., Johnas, C., & Kielkopf, J. 2007b, submitted to A&A
- Allard et al. (2007c) Allard, F., et al., 2007, A&A, in preparation
- Allende Prieto (2007) Allende Prieto C., 2007, in Proc. 14th Cambridge Workshop on Cool Stars, Stellar Systems, and the Sun; Pasadena, 6–10 November 2006, ASP, van Belle G., ed.
- Asplund et al. (2004) Asplund, M., Grevesse, N., Sauval, A. J., Allende Prieto, C., & Kiselman, D., 2004, A&A, 417, 751
- Asplund et al. (2005) Asplund M., Grevesse N., Sauval A. J., 2005, in ASP Conf. Ser. 336: Cosmic Abundances as Records of Stellar Evolution and Nucleosynthesis, pp. 25
- Ayres et al. (2006) Ayres, T. R., Plymate, C., & Keller, C. U., 2006, ApJS, 165, 618
- Barber et al. (2006) Barber R. J., Tennyson J., Harris G. J., Tolchenov R. N., 2006, MNRAS, 368, 1087
- Bohlin & Gilliland (2004) Bohlin, R. C., & Gilliland, R. L. 2004, AJ, 127, 3508
- Borysow et al. (2002) Borysow A., Champion J. P., Jørgensen U. G., Wenger C., 2002, Molecular Physics, 100, 3585
- Brown (2005) Brown L. R., 2005, Journal of Quantitative Spectroscopy and Radiative Transfer, 96, 251
- Burgasser et al. (1999) Burgasser A. J., et al., 1999, ApJ, 522, L65
- Burgasser et al. (2000) Burgasser, A. J., et al. 2000, ApJL, 531, L57
- Burgasser et al. (2002) Burgasser A. J., et al., 2002, ApJ, 564, 421
- Burgasser et al. (2006a) Burgasser A. J., Geballe T. R., Leggett S. K., Kirkpatrick J. D., Golimowski D. A., 2006, ApJ, 637, 1067
- Burgasser et al. (2006b) Burgasser, A. J., Burrows, A., & Kirkpatrick, J. D. 2006, ApJ, 639, 1095
- Burrows & Volobuyev (2003) Burrows A., Volobuyev M., 2003, ApJ, 583, 985
- Burrows et al. (2003) Burrows A., Sudarsky D., Lunine J. I., 2003, ApJ, 596, 587
- Burrows et al. (2006) Burrows, A., Sudarsky, D., & Hubeny, I. 2006, ApJ, 640, 1063
- Casali et al. (2007) Casali, M., et al. 2007, A&A, 467, 777
- Cavanagh et al. (2003) Cavanagh, B., Hirst, P., Jenness, T., Economou, F., Currie, M. J., Todd, S., Ryder, S. D., 2003, Astronomical Data Analysis Software and Systems XII, ASP Conference Series, Vol. 295, H. E. Payne, R. I. Jedrzejewski, and R. N. Hook, eds., 237
- Cushing et al. (2006) Cushing M. C. et al. 2006, ApJ, 648, 614
- Delahaye & Pinsonneault (2006) Delahaye F., Pinsonneault M. H., 2006, ApJ, 649, 529
- Dye et al. (2006) Dye S., et al., 2006, MNRAS, 372, 1227
- Eggen (1998) Eggen, O. J., 1998, AJ, 115, 2397
- Elias et al. (2006) Elias J. H., Rodgers B., Joyce R. R., Lazo M., Doppmann G., Winge C., Rodriguez–Ardila A., 2006, in McLean I. S., Masanori I., eds., Ground-Based and Airborne Instrumentation for Astronomy, SPIE 6269, 36
- Fazio et al. (2004) Fazio G., et al., 2004, ApJS, 154, 10
- Geballe et al. (2001) Geballe, T. R., Saumon, D., Leggett, S. K., Knapp, G. R., Marley, M. S., & Lodders, K. 2001, ApJ, 556, 373
- Geballe et al. (2002) Geballe, T. R., et al. 2002, ApJ, 564, 466
- Golimowski et al. (2004) Golimowski D. A., et al., 2004, AJ, 127, 3516
- Grevesse & Sauval (1998) Grevesse, N., & Sauval, A. J., 1998, Space Science Reviews, 85, 161
- Gunn & Stryker (1983) Gunn J. E., Stryker L. L., 1983, ApJS, 52, 121
- Hauschildt & Baron (1999) Hauschildt P. H., Baron E., 1999, Journal of Computational and Applied Mathematics, 102, 41
- Hambly et al. (2007) Hambly N. C., et al., 2007, MNRAS, submitted
- Hewett et al. (2006) Hewett P. C., Warren S. J., Leggett S. K., Hodgkin S. T., 2006, MNRAS, 367, 454
- Hillenbrand et al. (2002) Hillenbrand L. A., Foster J. B., Persson S. E., Matthews K., 2002, PASP, 114, 708
- Homeier et al. (2005) Homeier D., Allard F., Hauschildt P., Barman T., Schweitzer A., 2005, in ESO Astrophysics Symposia, Vol. in press, High Resolution Infrared Spectroscopy in Astronomy, Proceedings of the ESO Workshop Held in Garching, Germany, 18-21 Nov., 2003, Käufl H., Siebenmorgen R., Moorwood A., eds., European Southern Observatory, Springer, Heidelberg, pp. 465–476
- Homeier et al. (2007a) Homeier D., Burgasser A., Allard F., Allard N., Sharp C., Hauschildt P., Kirkpatrick J., 2007a, A&A, in prep.
- Homeier et al. (2007b) Homeier D., Hauschildt P., Allard F., Boudon V. & Champion J.-P., 2007b, A&A, in prep.
- Johnas et al. (2007) Johnas C. M. S., Hauschildt P. H., Schweitzer A., Mullamphy D. F. T., Peach G., Whittingham I. B., 2007, A&A, 466, 323
- Kendall et al. (2007) Kendall, T. R., et al. 2007, A&A, 466, 1059
- Knapp et al. (2004) Knapp, G. R., et al., 2004, AJ, 127, 3553
- Kučinskas et al. (2005) Kučinskas, A., Hauschildt, P. H., Ludwig, H.-G., et al. 2005, A&A, 442, 281
- Kučinskas et al. (2006) Kučinskas, A., Hauschildt, P. H., Brott, I., et al. 2006, A&A, 452, 1021
- Lawrence et al. (2007) Lawrence, A., et al. 2007, MNRAS, in press
- Leggett et al. (2006) Leggett, S. K., et al., 2006, MNRAS, 373, 781
- Leggett et al. (2007a) Leggett, S. K., Saumon, D., Marley, M. S., Geballe, T. R., Golimowski, D. A., Stephens, D., & Fan, X. 2007, ApJ, 655, 1079
- Leggett et al. (2007b) Leggett, S. K., Marley, M. S., Freedman, R., Saumon, D., Liu, M. C., Geballe, T. R., Golimowski, D. A., & Stephens, D. C. 2007, ArXiv e-prints, 705, arXiv:0705.2602
- Liu et al. (2007) Liu, M. C., Leggett, S. K., & Chiu, K. 2007, ApJ, 660, 1507
- Lodieu et al. (2007) Lodieu, N., et al., 2007, MNRAS, in press
- Luhman et al. (2007) Luhman, K. L. et al., 2007, ApJ, 654, 570
- Marley et al. (2002) Marley, M. S., Seager, S., Saumon, D., Lodders, K., Ackerman, A. S., Freedman, R. S., & Fan, X. 2002, ApJ, 568, 335
- McLean et al. (2003) McLean, I. S., McGovern, M. R., Burgasser, A. J., Kirkpatrick, J. D., Prato, L., & Kim, S. S. 2003, ApJ, 596, 561
- Morgan & Keenan (1973) Morgan, W. W., & Keenan, P. C. 1973, ARA&A, 11, 29
- Mugrauer et al. (2006) Mugrauer, M., Seifahrt, A., Neuhäuser, R., & Mazeh, T. 2006, MNRAS, 373, L31
- Nakajima et al. (1995) Nakajima T., Oppenheimer B. R., Kulkarni S. R., Golimowski D. A., Matthews K., Durrance S. T., 1995, Nature, 378, 463
- Patten et al. (2006) Patten, B. M., et al. 2006, ApJ, 651, 502
- Reach et al. (2005) Reach, W. T., et al. 2005, PASP, 117, 978
- Roche et al. (2002) Roche P. F., et al., 2002, in Iye M., Moorwood A. F., eds., Instrument Design and Performance for Optical/IR Ground-Based Telescopes, SPIE, 4841
- Roellig et al. (2004) Roellig, T. L., et al. 2004, ApJS, 154, 418
- Saumon et al. (2000) Saumon, D., Geballe, T. R., Leggett, S. K., Marley, M. S., Freedman, R. S., Lodders, K., Fegley, B., Jr., & Sengupta, S. K. 2000, ApJ, 541, 374
- Saumon et al. (2006) Saumon D., Marley M. S., Cushing M. C., Leggett S. K., Roellig T. L., Lodders K., Freedman R. S., 2006, ApJ, 647, 552
- Saumon et al. (2007) Saumon, D., et al. 2007, ApJ, 656, 1136
- Skrutskie et al. (2006) Skrutskie M. F., et al., 2006, AJ, 131, 1163
- Stoughton et al. (2002) Stoughton C., et al., 2002, AJ, 123, 485
- Strauss et al. (1999) Strauss M. A., et al., 1999, ApJ, 522, L61
- Tokunaga et al. (2002) Tokunaga A. T., Simons D. A., Vacca W. D., 2002, PASP, 114, 180
- Venemans et al. (2007) Venemans, B. P., McMahon, R. G., Warren, S. J., Gonzalez-Solares, E. A., Hewett, P. C., Mortlock, D. J., Dye, S., & Sharp, R. G. 2007, MNRAS, 376, L76
- Warren & Hewett (2002) Warren S., Hewett P., 2002, ASPC, 283, 369
- Warren et al. (2007a) Warren S. J., et al., 2007, MNRAS, 375, 213
- Warren et al. (2007b) Warren S. J., et al., 2007, arXiv:astro-ph/0703037
- Weatherley et al. (2005) Weatherley, S. J., Warren, S. J., Møller, P., Fall, S. M., Fynbo, J. U., & Croom, S. M. 2005, MNRAS, 358, 985
- Wenger and Champion (1998) Wenger, C. & Champion, J. P. 1998, JQSRT 59, 471
- York et al. (2000) York D. G., et al., 2000, AJ, 120, 1579