A cryogenic amplifier for fast real-time detection of single-electron tunneling
Abstract
We employ a cryogenic High Electron Mobility Transistor (HEMT) amplifier to increase the bandwidth of a charge detection setup with a quantum point contact (QPC) charge sensor. The HEMT is operating at 1K and the circuit has a bandwidth of 1 MHz. The noise contribution of the HEMT at high frequencies is only a few times higher than that of the QPC shot noise. We use this setup to monitor single-electron tunneling to and from an adjacent quantum dot and we measure fluctuations in the dot occupation as short as 400 nanoseconds, 20 times faster than in previous work.
The conventional method for studying quantum dot properties electrically is to measure electron transport through the dot Leo . An alternative approach is to measure the current through a quantum point contact (QPC) located next to the dot, which is sensitive to the charge dynamics of the quantum dot Lieven ; Schleser ; Gustavsson ; Fujisawa ; PettaCCO . This technique is very versatile and has also been used to probe the excited state spectrum of a quantum dot JeroAPL ; JohnsonChargeSensing , perform single-shot read-out of electron spin states JeroNature ; RonaldPRL and observe coherent electron spin dynamics in quantum dots Petta .
Until now, such a the current fluctuations through such a QPC charge sensor has always been measured using a room temperature (RT) current-to-voltage (IV-) convertor. This limits the measurement bandwidth to several tens of kHz Lieven , because of the low-pass (LP) filter formed by the capacitance of the measurement wires to ground and the input impedance of the amplifier. However, increasing this bandwidth is crucial in order to study (real-time) fast electron and nuclear spin dynamics HansonRMP as well as to increase the single-shot spin readout fidelity JeroNature . One way to increase the bandwidth is to embed the QPC in a resonant circuit and measure its damping Reilly , analogous to the operation of the RF-SET Schoelkopf . In theory such an ”RF-QPC” allows for single-shot charge detection within a few tens of nanoseconds SchoelkopfPrivate . However, this technique requires RF-modulation and is experimentally rather involved.
Here, we explore a much simpler approach to increasing the bandwidth, which uses a HEMT operated in DC as a cryogenic pre-amplifier CryoAmp . Compared to a RT amplifier, a cryogenic amplifier can be mounted much closer to the sample, which significantly reduces the capacitance of the measurement wire. The use of a HEMT has the additional advantage that the noise level at cryogenic temperatures is very low (especially at high frequencies), so a better charge sensitivity can be obtained.
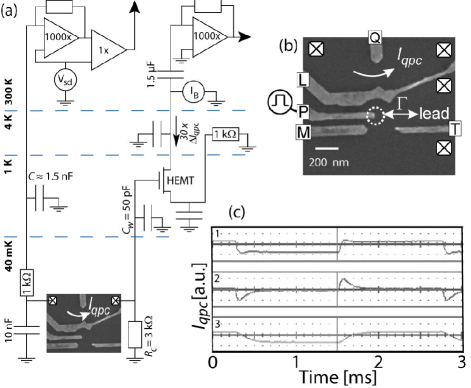
The HEMT is connected to the right lead of the QPC, which is also connected to ground via (Fig. 1(a)). A bias voltage, , is applied to the left lead and a current will flow which depends on the QPC conductance . The voltage over is a measure for this current and is probed via the HEMT. Fluctuations of result in fluctuations of , denoted by . These generate voltage fluctuations on the HEMT gate with respect to the voltage on its source, . The modulation of results in a modulation of the drain-source current, , through the HEMT channel. This current is measured by an AC-coupled IV-convertor at RT and digitized using a digital oscilloscope (LeCroy WaveRunner 6030A).
We use a commercially available HEMT (Agilent ATF 35143) with a 400 m gate length and a threshold voltage 0.4 V. When appropriately biased (by controlling ), the transconductance of the HEMT is mA/V, which relates the drain-source current through the HEMT to as implying , using 3 k. The power dissipation of the HEMT is 30 W. In addition to the HEMT, can also be measured simultaneously in a 100 Hz bandwidth using a IV-convertor at RT which is connected to the left lead of the QPC. We refer to this measured current as the time averaged current.
The quantum dot and the QPC are defined in a two-dimensional electron gas (2DEG) by applying negative voltages to metal surface gates (labeled L, M, T and Q in Fig 1(b). Gate L completely separates the QPC source and drain electrically from the leads of the dot. The experiment is performed in a dilution refrigerator with a base temperature of 40 mK and with zero externally applied magnetic field.
First, we characterize the bandwidth of the setup. The bandwidth () is expected to be limited by the resistor and the capacitance, , of the measurement wire connecting the right lead of the QPC to the HEMT gate (). The HEMT is mounted on the 1K-stage, since this has sufficient cooling power to dissipate the heat generated by the HEMT in operation. The value for is then a tradeoff between two requirements: a low capacitance and sufficient thermal anchoring of the wire. The value of is also a tradeoff: increasing the value of increases the amplitude of the voltage fluctuations on the HEMT gate () but reduces the bandwidth of the setup (for a given value of ). Our aim is to detect single-electron tunneling on a sub-microsecond timescale. The value for was chosen assuming 400 pA and an input referred voltage noise 0.4 nV/. 3 k then gives SNR 3 and a bandwidth of 1 MHz. The bandwidth is determined by measuring the QPC response to fast voltage pulses applied to gate P. The measured rise times are 285 ns, yielding a bandwidth of 1 MHz, in excellent agreement with the designed bandwidth (Fig. 1(c)).
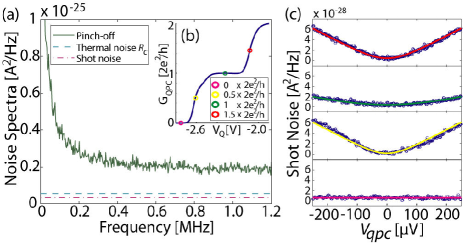
The next step is a characterization of the noise level. We measure the total noise spectral density and plot this as an input referred current noise in Fig. 2(a). A characteristic contribution is present up to 200 kHz. For frequencies above 200 kHz, the spectrum is approximately flat, saturating at (= 0.4 nV/). This is very close to the voltage fluctuations generated by the QPC shot noise (calculated to be nV/, for 1 mV bias over the QPC Lieven ). We test this by a direct measurement of the QPC shot noise. We measure the rms voltage after band-pass filtering the output of the RT IV-convertor (bandwidth from 500 kHz to 1 MHz). In Fig. 2(b) we show the QPC conductance as a function of the voltage on gate Q, determined from the time averaged current. The colored markers indicate the QPC conductances (, ) at which the shot noise was measured as a function of bias over the QPC, , see Fig. 2(c). is varied by changing . We verified that the QPC was in its linear regime for the entire range of . The shot noise spectral density can be expressed as Blanter ; DiCarlo
| (1) |
where with the
QPC transmission coefficient of mode , the bias over
the QPC, the Boltzmann constant and the electron
temperature. The solid lines in Fig. 2(c) are fits to
Eq. (1) yielding and
from top to bottom, in agreement with the QPC conductances. The
measurements prove that the input referred voltage noise is indeed
very close to the shot noise limit in this setup. From the fits we
also extract the electron temperature mK, consistent
with the value
obtained from the width of Coulomb peaks ( mK).
The noise measurements show that the noise from the HEMT is in
agreement with our initial estimation. We therefore expect to have
sufficient SNR to detect single-electron tunnel events. To test this
experimentally, the dot is tuned to be near the
electron transition by adjusting the voltages on gates L, M and T,
and to be isolated from the bottom lead JeroAPL . The dot
remains coupled to the other lead with a tunable tunnel rate,
. An electron is now allowed to tunnel back and forth
between the dot and the lead and the QPC current should therefore
exhibit a random telegraph signal (RTS). The QPC conductance is set
again at approximately .
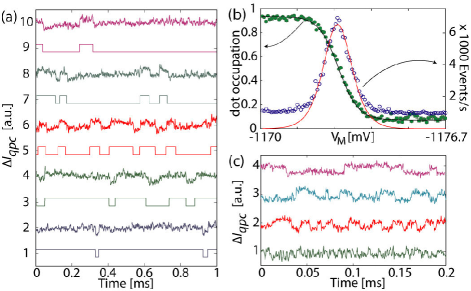
In order to maximize , we want to apply the highest possible bias, . However, for mV, we observe a severe change in the dot occupation, most probably due to intradot excitations to the first orbital excited state Eugen . We therefore restrict ourselves to QPC bias voltages below 0.65 mV. This reduces to 320 pA, resulting in a lower SNR. Measurements of the RTS are shown in Fig. 3. To verify that the measured RTS originates from electron tunnel events between the dot and the lead, we varied two control parameters, as in Lieven : (1) the dot electrochemical potential relative to the Fermi level of the lead and (2) the tunnel barrier between the dot and the lead. The dot potential is changed by changing the voltage on gate M. The dot occupation probability depends on and the temperature broadening of the lead so it should directly reflect the Fermi-Dirac distribution of electronic states in the lead. We infer the dot occupation from the measured average time the electron spends on (off) the dot, , as , Schleser . However, since both the HEMT and the RT IV-convertor AC-coupled, signals from the QPC are high-pass filtered (1.2 kHz cut-off). We can therefore not use a simple threshold detection scheme JeroNature but instead detect the flanks of the steps in to obtain the single-electron tunneling statistics. In Fig. 3(b) the average dot occupation is plotted versus the voltage on gate M (). At = - 1172.8 mV, is aligned with . The solid black line is a fit to the Fermi-Dirac distribution function yielding an electron temperature = 275 mK. The average times also allow the determination of the tunnel rate . The Fermi distribution and the tunnel rate determine the average number of tunnel events per second as . This is also plotted in Fig. 3(b). The fit to this data yields = 26.1 kHz (solid red line) TraceLengthSaturation . The tunnel rate can be varied via the voltage on gate T (Fig. 3 (c)). The shortest detectable events are on the order of 400 ns. The charge sensitivity reached is in the range 200 kHz - 1 MHz, only 3.8 times larger than the shot noise limit in this setup with 0.65 mV.
We have demonstrated that a HEMT can be used as a cryogenic amplifier to increase the measurement bandwidth of a QPC charge detection setup. The bandwidth of the setup is 1 MHz and the input referred voltage noise is measured to be 0.4 nV/ above 200 kHz, which is close to the QPC shot noise limit. This allows us to detect fluctuations in the dot occupation as short as 400 ns, 20 times faster than previously achieved using a QPC as a charge sensor. The bandwidth could be further increased by placing the HEMT even closer to the sample (since the dissipation in the HEMT is low enough), which would reduce the capacitance even more. A lower amplifier noise (both and baseline) could be obtained by using a HEMT with a larger gate area.
We thank F.H.L. Koppens, L.P. Kouwenhoven, J. Love, T. Meunier, K.C. Nowack, J.H. Plantenberg, R.J. Schoelkopf, G.A. Steele, H.P. Tranitz and L.H. Willems van Beveren for help and discussions and A. van der Enden and R.G. Roeleveld for technical support. This work was supported by the Dutch Science Foundation (FOM and NWO).
References
- (1) L. P. Kouwenhoven, D. G. Austing and S. Tarucha, Few-electron quantum dots, Rep. Prog. Phys. 64, 701 (2001).
- (2) T. Fujisawa, R. Tomita, T. Hayashi and Y. Hirayama, Science 314, 1634 (2006).
- (3) S. Gustavsson, R. Leturcq, B. Simovic, R. Schleser, T. Ihn, P. Studerus, K. Ensslin, D. C. Driscoll and A. C. Gossard, Phys. Rev. Lett. 96, 076605 (2006).
- (4) L.M.K. Vandersypen, J. M. Elzerman, R. N. Schouten, L. H. Willems van Beveren, R. Hanson and L. P. Kouwenhoven, Appl. Phys. Lett. 85, 4394 (2004).
- (5) R. Schleser, E. Ruh, T. Ihn, K. Ensslin, D. C. Driscoll and A. C. Gossard, Appl. Phys. Lett. 85, 2005 (2004).
- (6) J. R. Petta, A. C. Johnson, C. M. Marcus, M. P. Hanson, A. C. Gossard, Phys. Rev. Lett. 93, 186802 (2004).
- (7) J. M. Elzerman, R. Hanson, L. H. W. van Beveren, L. M. K. Vandersypen and L. P. Kouwenhoven, Appl. Phys. Lett. 84, 4617 (2004).
- (8) A. C. Johnson, C. M. Marcus, M. P. Hanson, and A. C. Gossard, Phys. Rev. B 71, 115333 (2005).
- (9) J. M. Elzerman, R. Hanson, L. H. Willems van Beveren, B. Witkamp, L. M. K. Vandersypen and L. P. Kouwenhoven, Nature 430, 431 (2004).
- (10) R. Hanson, L. H. Willems van Beveren, I. T. Vink, J. M. Elzerman, W. J. M. Naber, F.H. L. Koppens, L. P. Kouwenhoven and L. M. K. Vandersypen, Phys. Rev. Lett. 94, 196802 (2005).
- (11) J. R. Petta, A. C. Johnson, J. M. Taylor, E. A. Laird, A. Yacoby, M. D. Lukin, C. M. Marcus, M. P. Hanson and A. C. Gossard, Science 309, 2180 (2005).
- (12) R. Hanson, L. P. Kouwenhoven, J. R. Petta, S. Tarucha, L. M. K. Vandersypen, Rev. Mod. Phys. (in press); see also arXiv:cond-mat/0610433 (2007).
- (13) D. J. Reilly, C. M. Marcus, M. P. Hanson and A. C. Gossard, arXiv:0707.2946v1 (2007).
- (14) R. J. Schoelkopf, P. Wahlgren, A. A. Kozhevnikov, P. Delsing and D. E. Prober, Science 280, 1238 (1998).
- (15) R. J. Schoelkopf, private communication.
- (16) A. T. Lee, Rev. Sci. Instrum. 60, 3315 (1989).
- (17) Ya. M. Blanter and M. Büttiker, Phys. Rep. 336, 1 (2000).
- (18) L. DiCarlo, Y. Zhang, D. T. McClure, D. J. Reilly, C. M. Marcus, L. N. Pfeiffer, K. W. West, Phys. Rev. Lett. 97, 036810 (2006).
- (19) E. Onac, F. Balestro, L. H. Willems van Beveren, U. Hartmann, Y. V. Nazarov and L. P. Kouwenhoven, Phys. Rev. Lett. 96, 176601 (2006).
- (20) For every trace without a tunnel event, the total length of the trace (1 ms) is assigned to . This results in a baseline of 1000 events/s instead of 0. To determine , we fit to a subset of the data with a sufficient number of tunnel events.