s-wave superconductivity phase diagram in the inhomogeneous two-dimensional attractive Hubbard model
Abstract
We study s-wave superconductivity in the two-dimensional square lattice attractive Hubbard Hamiltonian for various inhomogeneous patterns of interacting sites. Using the Bogoliubov-de Gennes (BdG) mean field approximation, we obtain the phase diagram for inhomogeneous patterns in which the on-site attractive interaction between the electrons takes on two values, and (with the concentration of non-interacting sites) as a function of average electron occupation per site , and study the evolution of the phase diagram as varies. In certain regions of the phase diagram, inhomogeneity results in a larger zero temperature average pairing amplitude (order parameter) and also a higher superconducting (SC) critical temperature , relative to a uniform system with the same mean interaction strength ( on all sites). These effects are observed for stripes, checkerboard, and even random patterns of the attractive centers, suggesting that the pattern of inhomogeneity is unimportant. The phase diagrams also include regions where superconductivity is obliterated due to the formation of various charge ordered phases. The enhancement of due to inhomogeneity is robust as long as the electron doping per site is less than twice the fraction of interacting sites [] regardless of the pattern. We also show that for certain inhomogeneous patterns, when , increasing temperature can work against the stability of existing charge ordered phases for large and as a result, enhance .
I Motivation
Fascination with inhomogeneous superconducting (SC) phases extends back several decades, with many conferences and monographs having been devoted to the subject.inhomog.scy.conf ; monograph2 ; dagotto94 For conventional superconductors, the inhomogeneities were extrinsic, arising from a granular nature of samples or due to the deliberate synthesis of disordered built materials or films. The high temperature superconductors (HTS) introduced new aspects into this area of study. First, inhomogeneous states (normal and SC) seem to be intrinsic to HTS, at least in the underdoped regime, similar to quenched disorder in the metal-insulator transition in two dimensions.Lee85 ; Belitz94 Secondly, the inhomogeneity occurs on a smaller length scale of just a few lattice constants as evidenced by scanning tunneling spectroscopy (STS) at the nanoscale.cren ; pan ; howald ; lang
In addition, the strong electronic correlation in HTS cuprates plays a major role in the elucidation of the inhomogeneous SC state; indeed the inhomogeneity is widely believed to arise from the strong intra-atomic interactions that tend to frustrate bandlike conduction, to induce local magnetic moments, and to drive charge and spin order on a few lattice constant scale. The study of the doped Mott insulating phase has been one of the most active areas of theoretical study of HTS, one that has proven to be unexpectedly complex and rich and which is still under intense exploration and debate. Surprisingly, holes doped into the high temperature superconductors tend to arrange themselves non-uniformly in the CuO2 planes in the form of stripes, checkerboard or perhaps even more exotic structures.mcelroy ; hanaguri ; vershinin ; mook ; tranquada Moreover, spatially varying density and spin structures have also been observed in the physics of the manganites renner ; burgy ; dagotto99 ; dagotto01 and cobaltites.foo ; lee
A variety of physically relevant models such as the repulsive Hubbard and t-J Hamiltonians have been extensively studied to understand the interplay between spatial inhomogeneity, magnetism, and superconductivity.zaanen ; machida ; kato ; white ; vojta ; seibold ; kivelson ; huai ; maska ; tsai ; seibold2 ; garg ; zhang ; robertson ; ghosal ; dobrosavljevic92 ; dobrosavljevic94 ; dobrosavljevic03 ; yukalov1 ; yukalov2 In the repulsive Hubbard and t-J Hamiltonians in particular, inhomogeneity has been introduced either through the hopping amplitude or magnetic coupling or the local energy on the lattice sites. For the square lattice these two models are known to display antiferromagnetism at half-filling, and, although it is less certain, perhaps also d-wave superconductivity when doped. There is considerable evidence that they also might possess inhomogeneous stripe or checkerboard ground states.white ; vojta ; seibold ; kivelson ; huai ; tsai ; seibold2 ; zhang ; robertson . Phenomenological d-wave BCS Hamiltonians with spatially inhomogeneous pairing amplitude valdez ; seo ; andersen or lattice site energy caixeiro ; andersen have also been employed mostly to reproduce the local density of states (LDOS) results obtained from scanning tunneling microscopy (STM).jamei In addition, there have been theoretical studies of the SC quantum phase fluctuations using the QED3 effective theory of the HTS in relation with the inhomogeneous pattern formation in cuprates from the STM experimental results.melikyan ; tesanovic
While DMRG treatments white provide detailed information on the real space charge, spin, and pairing orders, the precise nature of the interplay, and whether the different orders compete or cooperate, remains unclear. In addition, the enhancement of the superconducting transition temperature by local inhomogeneity has been demonstrated by Martin et al. in Ref. [martin, ] and also in Ref. [olderwork, ]. Recently, the model Hamiltonian with certain types of inhomogeneous patterns for the coupling constant between spins sitting on two nearest neighboring sites has also been shown to enhance by Loh et al. in Ref. [loh, ].
Many of the basic characteristics of this short-range-scale inhomogeneous superconducting state can be addressed with a more tractable model, one which is well understood in the homogeneous limit. This model is the attractive Hubbard model, which has been applied previously to address some aspects of the impact of inhomogeneity. Recently old suggestions based on “negative U” superconductivity have been revived,olderwork ; chatterjee which may provide additional applications for the results we present in this paper. Tl-doped PbTe achieves a critical temperature up to 1.5 K, and more extensive heat capacity and transport datastanford1 ; stanford2 have led to an analysis in terms of a “charge Kondo effect” that could be linked to the observed superconductivity.dzero This system intrinsically involves both negative U centers and inhomogeneity.
This article extends previous work olderwork to a more general range of non-interacting site concentration values. We show the presence of different conduction phases both in the phase diagram at and in the density of states (DOS). We also show the local occupation and SC order parameter for electrons on different lattice sites as the concentration varies for different inhomogeneity patterns. Finally, the enhancement conditions are also extracted based on the relationship between the average doping of electrons on the lattice and inhomogeneity concentration .
The paper is organized as follows: in the next section we introduce our model and describe the method we have employed. In Sec. III we present and discuss the phase diagram at zero temperature. Sec. IV contains our finite temperature results, and Sec. V summarizes our findings.
II Model and Methodology
This article focuses on a general question: “Under what conditions is it more favorable to have an inhomogeneous pairing attraction, compared to the same average strength spread homogeneously over the lattice?” By ‘conditions’ we refer to the average occupation number of electrons per site , the average attraction strength per lattice site , which remains constant in any comparison between systems with and without inhomogeneity, and the inhomogeneity concentration . We address this question by comparing the average zero temperature pairing amplitude over the entire lattice and the SC transition temperature for a system in the presence and absence of inhomogeneity.
For the cuprate superconductors, for example, such a question is complicated by the presence of other types of order such as antiferromagnetism, exotic spin-gap phases, and by the nontrivial d-wave symmetry of the SC order parameter. For these systems and phenomena, models like the repulsive Hubbard or t-J Hamiltonians are essential.zaanen ; machida ; kato ; white ; vojta ; seibold ; kivelson ; huai ; maska ; tsai ; seibold2 ; garg ; zhang ; robertson ; ghosal ; dobrosavljevic92 ; dobrosavljevic94 ; dobrosavljevic03 Nevertheless, it is yet beneficial to study the problem first by employing a more simple and phenomenological model. Here we will present a solution of the inhomogeneous Bogoliubov-de Gennes (BdG) equations for the attractive Hubbard Hamiltonian,
| (1) | |||||
with the hopping amplitude, the chemical potential and the local attractive interaction between the fermions of opposite spins residing on the same lattice site . We will study inhomogeneous patterns in the interaction . The origin of the attraction in this model can result from, for example, integrating out a local phonon mode.micnas90 The two-dimensional uniform attractive Hubbard model is known to yield degenerate superconductivity and charge density wave (CDW) long range order at half-filling and zero temperature.robaszkiewicz ; shiba ; emery However, away from half-filling, the CDW pairing symmetry is broken and superconductivity is more favorable, and the SC phase transition is at finite temperature.
The BdG mean field decomposition bilinearizes the Hamiltonian by replacing the local pairing amplitude and local density by their average values, and and yields the quadratic effective Hamiltonian
| (2) | |||||
where includes a site-dependent Hartree shift with . All energies will be referenced to .
We adopt the criterion of comparing the tendency for superconductivity in the homogeneous system with the same attraction on all lattice sites, with cases when sites with attraction are mixed with sites where the attraction is absent, i.e., . martin ; litak ; hurt Specifically, we have studied systems in which sites with attractive interaction are randomly distributed litak or arranged in checkerboard and stripe patterns. The last two regular patterns have been purposely chosen due to their relevance to the experimentally observed pattern formation in the HTS cuprates.
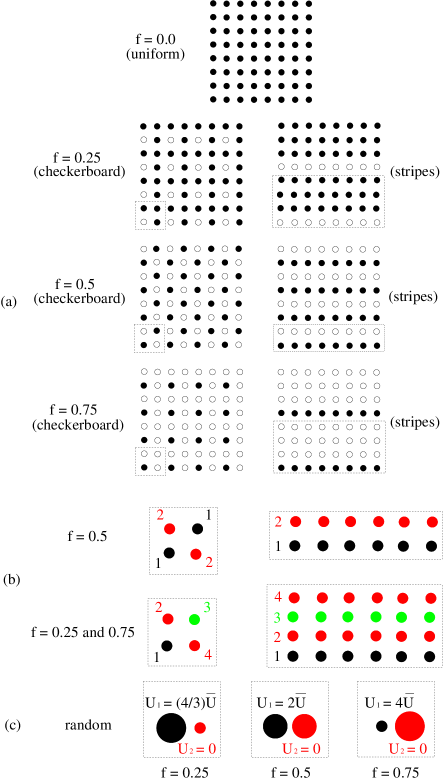
Fig. 1, panel (a), presents the patterns for the interacting lattice sites with four different values for the fraction of non-interacting sites . The uniform pattern corresponds to with interaction on all lattice sites. Checkerboard, stripes and random patterns with include interacting sites with and non-interacting sites with . For , half of the sites are interacting with and half non-interacting with . corresponds to interacting sites with and non-interacting sites with once again averaging to per site.
For the random pattern we have averaged over typically 20 different disorder realizations. One may note that regardless of the pattern and the impurity fraction, the average attraction per site, i.e., remains constant. We adopt this criterion throughout the rest of this article for comparison between uniform and inhomogeneous lattices. This criterion is believed to be most appropriate for exhibiting the effect of inhomogeneity in particular in the systems having the same strength on average for forming superconducting Cooper pairs.
Panel (b) depicts the color coding and numbering of the lattice sites for the checkerboard and stripes based on their value of . Due to the regular geometry and periodicity of their inhomogeneous patterns, lattices with the checkerboard and stripe patterns can be classified into blocks including two and four different types of sites at and or respectively as illustrated by different colors and numbers in panel (b) of Fig. 1. Sites carrying the same color or number are equivalent by the symmetry in the pattern geometry. For the random pattern, due to the lack of both regularity and periodicity, we average over all the interacting and all the non-interacting sites separately (black and red (Red shows dark gray in the grayscale version) regions in panel (c) of Fig.1 respectively) before the configurational averaging over all different impurity patterns is performed.
We self-consistently diagonalize the BdG mean-field Hamiltonian in Eq. 2 by assigning initial values to the local occupation number and order parameter and solving again for these parameters after diagonalizing the Hamiltonian, until convergence is achieved at a desired tolerance. For the checkerboard and striped patterns, sites with the same color have the same density, due to symmetry, and do not need to be averaged. For the random pattern we calculate the average occupation number and order parameter per site at the different types of sites by averaging
| (3) |
For the checkerboard and striped patterns with and for the random pattern (all ) we simply have and (Red shows dark gray in the grayscale version). For the striped and checkerboard with we have (Green shows light gray in the grayscale version) and , whereas for we have and . The same combinations hold for and . The average occupation number and order parameter per site are defined
| (4) |
The chemical potential in Eq. 2 is self-consistently adjusted after every iteration in order to arrive at a desired total average occupation per site for the entire lattice. For the regular patterns, i.e., uniform, checkerboard and stripes, due to their periodicity, by Fourier transforming the Hamiltonian into momentum space, we significantly reduce the numerical cost of the calculations and at the same time can increase the size of the lattice close to the thermodynamic limit to avoid finite size artifacts in the results (up to lattice sites in our calculations). For the random pattern, however, such a simplification is not possible due to the lack of periodicity. Hence, we are limited to the finite size lattices of up to sites. As a result, especially at small values for the average on-site interaction magnitude , finite size effects are to be cautiously monitored. Our calculations also include the density of states (DOS) for the entire lattice. We study simultaneous variations of the average on-site interaction magnitude , occupation number and also temperature and their effects in the average order parameter and DOS. Our goal is to obtain the phase diagram for the effect of inhomogeneity in superconductivity and discuss the conditions under which inhomogeneity can result in enhancements in the average superconductivity order parameter or SC phase transition temperature .
It is further realized that our conventional mean-field approach does not capture the Kosterlitz-Thouless nature of the phase transition in two dimensions. Nevertheless, this weakness can be repaired mayr upon regarding the local pairing amplitudes as complex variables and performing a finite temperature Monte Carlo integration over the associated amplitude and phase degrees of freedom. Unlike BCS, this Monte Carlo mean field (MCMF) approach allows identification of the weak and strong coupling regimes via the phase correlation function. In an earlier work olderwork this Monte Carlo technique was employed as an independent examination for the validity of our results and the agreement between the two techniques was clearly confirmed.
III Phase Diagram at
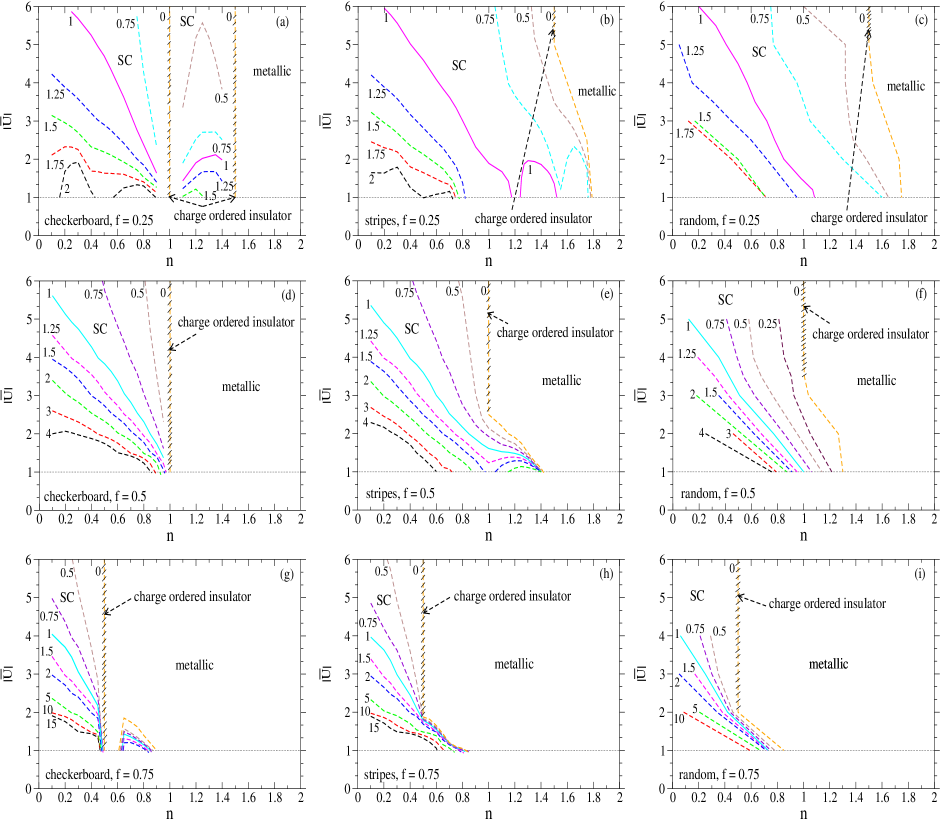
Fig. 2 presents the phase diagram for the average interaction magnitude and electron doping per site at for three different inhomogeneous patterns of checkerboard, stripes, and random, and for values of , and . We show isocontours of , i.e., the ratio of the average inhomogeneous pattern order parameter over its uniform pattern counterpart. Thus, whenever , inhomogeneity leads to a larger average order parameter at compared to a homogeneous system and therefore is more favorable for superconductivity over a uniform pattern of the interacting sites. We also adopt the lower limit of since for smaller values of , will be the ratio of two very small numbers and is subject to numerical uncertainty. The first row of Fig. 2 (panels (a)-(c)) corresponds to the concentration value of for the non-interacting sites. At first glance, one can observe that regardless of the geometry for the inhomogeneity, above , inhomogeneity gradually (or abruptly for the checkerboard pattern in panel (a)) results in the obliteration of superconductivity consistent with the findings of Litak et allitak . We can understand how this obliteration takes place if we examine the behavior of the system in strong coupling. When we start with an empty system and add electrons they are placed on the attractive sites first due to the strong attractive interactions. It is useful to define , which for a given corresponds to the density for which all attractive sites are doubly occupied and all free ones are empty. As we will see below, this density corresponds to an insulating charge ordered state. Above this density, superconductivity is reduced because the pairs cannot move within the attractive sublattice, since it is completely filled.
For the checkerboard pattern in panel (a), there are two insulating regions within the phase diagram at and (hatched orange lines) both corresponding to the formation of charge ordered phases of electrons in the interacting sites. No superconductivity was observed for and down to the lower limit of . Beyond , the system becomes metallic. For stripes as shown in panel (b), similar features as in panel (a) are observed. One exception is the lack of the charge ordered insulating phase at . This can be the result of further overlap between the Cooper pairs since for the stripes, nearest neighboring sites are interacting in one dimension. The charge ordered insulating phase at also forms for rather higher values compared to the checkerboard pattern. The random pattern in panel (c) also shows features similar to the stripes.
The second row (panels (d)-(f)) corresponds to with rather similar features to the first row. As anticipated, superconductivity gradually goes away above for all the patterns. For the checkerboard in panel (d), and , superconductivity strictly goes away and the system turns metallic. For the striped and random patterns however, superconductivity persists slightly above until it is totally obliterated. At , all three inhomogeneous patterns exhibit a charge ordered insulating phase for large enough values of (or the smallest value of for the checkerboard). Nevertheless, it can be readily seen that for compared to , the enhancement of the average order parameter due to inhomogeneity is considerably larger as the ratio increases for small values.
The third row (panels (g)-(i)) for shows ratios as large as for small values of and values not much larger than . For also, superconductivity gradually dies away when and a charge ordered phase sets in for large enough values at analogous to and . The only difference is a slight remnance of superconductivity for the checkerboard pattern at . Thus, by further diluting the interacting sites in the lattice and keeping the attractive pairing energy constant at the same time, superconductivity is driven towards smaller values; on the other hand, the average order parameter becomes significantly more enhanced due to inhomogeneity. Generally, regardless of the pattern, for large enough values, inhomogeneity weakens superconductivity for every value of due to the localization and compression of the Cooper pairs in the interacting sites. For , increases as a function of and saturates for large values. For , reaches a maximum as a function of and eventually vanishes for large enough values. However, is a monotonically increasing function of and is symmetric with respect to . Therefore, for sufficiently large , the ratio becomes less than one while and eventually zero when as illustrated in Fig. 2.
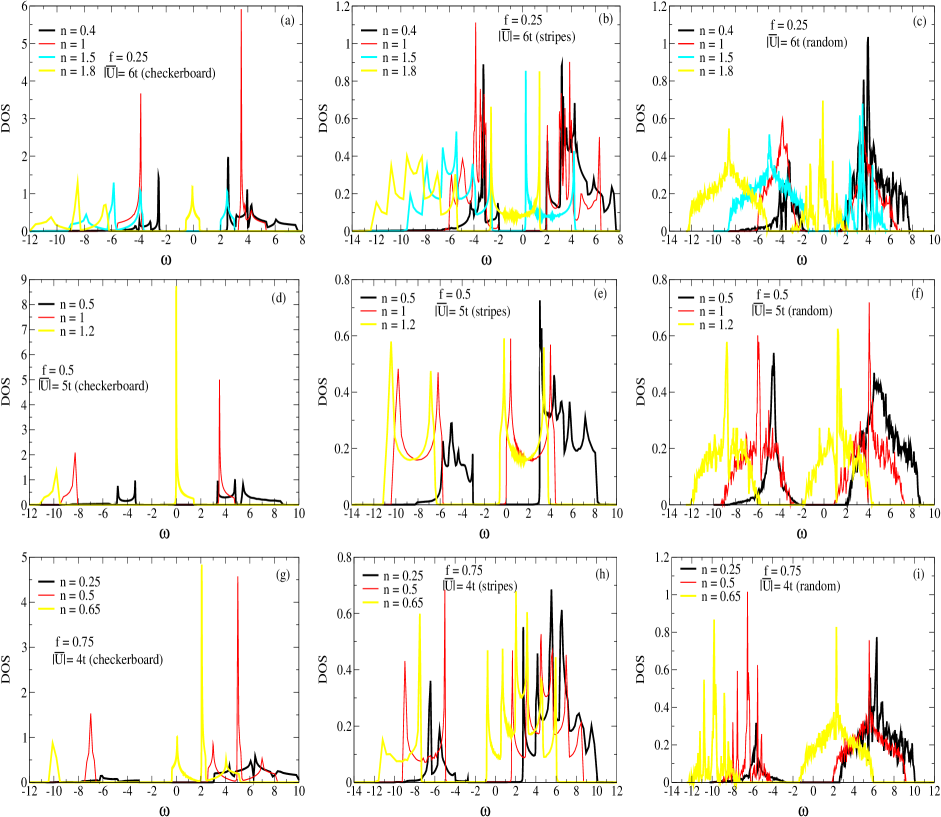

The obliteration of superconductivity is associated with the vanishing of average order parameter . Whether a non-SC state is a metal or insulator is determined by the DOS results for that state. In Fig. 3, panel (a) presents the DOS results for the checkerboard pattern at (the largest in our calculations for ) and four different values for the average electron doping . There is a gap in the DOS around the Fermi energy at at . This gap corresponds to a SC state as for , . The gaps at and both correspond to insulating states as for both these values . At , we also find according to Fig. 2, panel (a). However, the DOS at has a finite value around the Fermi energy at as shown in panel (a) of Fig. 3, indicating a metallic state.
In panels (b) and (c) in Fig. 3 for striped and random patterns respectively, gaps at do not correspond to insulating phases as opposed to panel (a) whereas they do correspond to insulators for . In the second row of Fig. 3 (panels (d)-(f)), for all the patterns at and (the largest in our calculations for ), the system is superconducting for , insulating for and metallic for in conjunction with the results of the second row in Fig. 2. The third row of Fig. 3 (panels (g)-(i)), for and (the largest of our calculations for ), confirms the results presented in Fig. 2, (panels (g)-(i) respectively), namely, superconductivity for , insulator at and large enough and metal for for all inhomogeneous patterns.
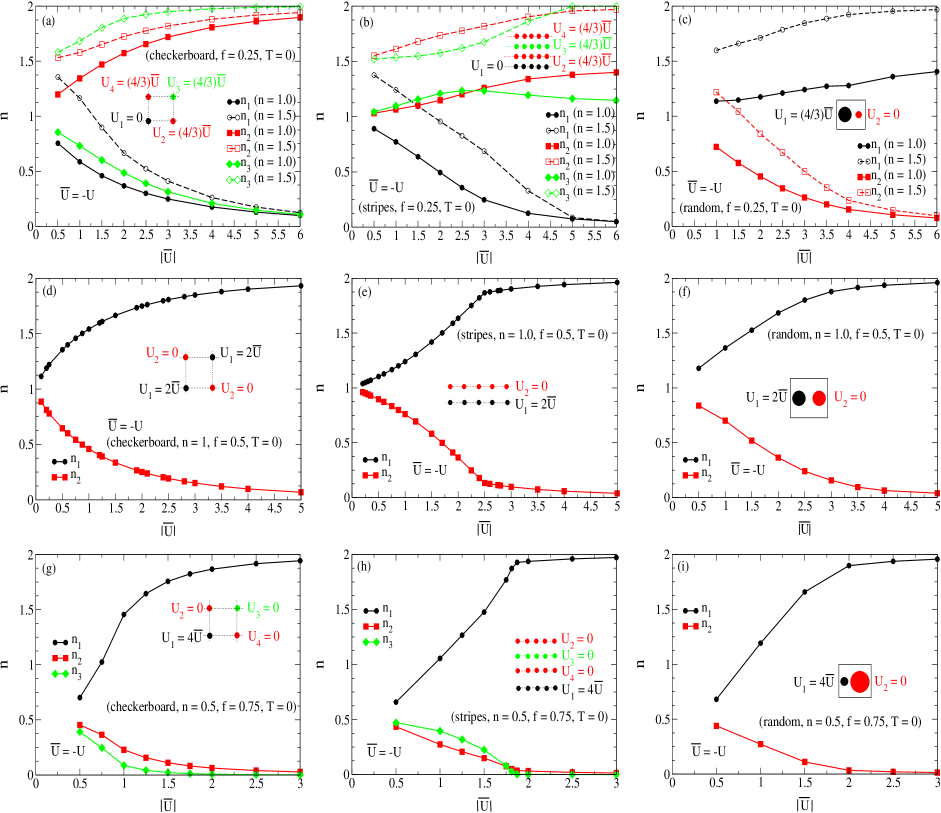
The insulating state for the phase diagram in Fig. 1 at all values of , and all inhomogeneous patterns is always associated with the formation of a charge ordered state. In Fig. 4, panel (a) for the checkerboard at , for the insulating phase at , as increases, electrons form pairs in the interacting sites with higher symmetry [sites and in red (dark gray in the graycsale version)], leaving the non-interacting and lower symmetry interacting sites [sites and in black and green (light gray in the grayscale version), respectively] essentially empty. For the insulating phase in panel (a) at , the lower symmetry interacting site [site in green (light gray in the grayscale version)] also obtains a pair leaving only the non-interacting site (site in black) empty. In other words, charges rearrange themselves into ordered pair configurations forming an insulating phase. According to panel (b) in Fig. 1 for stripes, does not correspond to an insulating phase. Panel (b) in Fig. 4 confirms this finding as the local occupation of the interacting sites (sites , and in red (dark gray in the grayscale version), green (light gray in the grayscale version) and red respectively) for large at does not approach while for the non-interacting sites (sites in black) it approaches zero.
For the random pattern in panel (c) of Fig. 4 at , we plot and (Red shows dark gray in the grayscale version) as defined in Eq. II. The fact that does not approach as increases (no pair compression) is consistent with the lack of an insulating phase at for the random pattern at (Fig. 1, panel (c)). However, at , both striped and random patterns turn insulating as a result of charge ordered phase formation as shown in panels (b) and (c) in Fig. 4, where their occupation numbers on the interacting sites all approach as increases. Charge ordered phase formation is more obvious in the second row (panels (d)-(f)) and third row (panels (g)-(i)) of Fig. 4 for and respectively at large enough values.
The proximity effect for the non-interacting sites neighbored by the interacting sites plays a key role in the magnitude of the average order parameter in the inhomogeneous lattice. In Fig. 5, panel (a), for the checkerboard at and , the local order parameter on all the interacting sites (, , in red (dark gray in the grayscale version), green (light gray in the grayscale version) and red respectively) increases as a function of . The non-interacting site ( in black) is also superconducting due to the proximity effect of its neighboring sites. However, its local order parameter has a maximum at a critical value beyond which it decreases as a result of the compression of the Cooper pairs in the interacting sites and therefore their weaker overlap around the non-interacting site. Thus, on all these four sites will be larger than its uniform pattern counterpart due to this proximity effect as long as the non-interacting site local order parameter ( in this case) does not plummet too far down with respect to its maximum as a function of .
Panel (b) shows the same behavior for stripes. In panel (b), there is an intersection between and near indicating that due to the particular symmetry of the stripes, sites and behave very closely. In panel (c), we have plotted and (Red shows dark gray in the grayscale version) as defined in Eq. II and it is clear that eventually falls off at large values. In the second row of Fig. 5 (panels (d)-(f)) corresponding to and , there are only two different sites for each pattern and the lattice has a more dilute interacting pattern. As a result, compared to results, at tends to saturate for large values for all the patterns. In the third row of Fig. 5 (panels (g)-(i)) for , the lattice is even more dilute in terms of interacting energy. Therefore, shows even faster saturation at smaller values.

As mentioned earlier in this section, for , increases as a function of and saturates for large enough values while is a consistently increasing function of and is symmetric with respect to . Therefore, for as illustrated in Fig. 1 for at a given
| (5) |
Now since
| (6) |
and as a result
| (7) |
Therefore, knowing that yields the largest magnitude of that is still enhanced compared to when , the optimum effect due to inhomogeneity corresponds to a value of along the contour in Fig. 1, for which is maximized. Fig. 6 demonstrates the variation of as a function of for different values. In panel (a) corresponding to , all three different inhomogeneous patterns yield the maximum within the range of to . In panel (b) for , the maxima are closer to while in panel (c) for they are around . These results indicate that apparently the optimum value for the doping of electrons in these inhomogeneous systems is . In strong coupling this density corresponds to leaving the free sites empty and singly occupying the attractive ones. By comparing this behavior with the uniform system for which, due to particle-hole symmetry, we can understand why .
Also, one observes in Fig. 6 that by further diluting the interacting sites in a lattice, the magnitude of at decreases.
We conclude in this section that by further diluting the density of interacting sites in a lattice while maintaining the average pairing energy per site constant at , the average order parameter may enhance. This enhancement results from the proximity effect in the non-interacting sites due to their interacting neighbors leading to a larger average order parameter compared to the uniform lattice and in many respects is independent of the particular inhomogeneous pattern. Superconductivity in an inhomogeneous lattice of interacting sites gradually vanishes above and for large enough values at we have an insulating phase as a result of a charge ordered phase formation. For larger values, the enhancement ratio will be larger for small values of and . However, the enhancement of occurs at smaller values of . We also find an optimum value of for the largest enhanced for a system in the presence of inhomogeneity.


IV Results at Finite
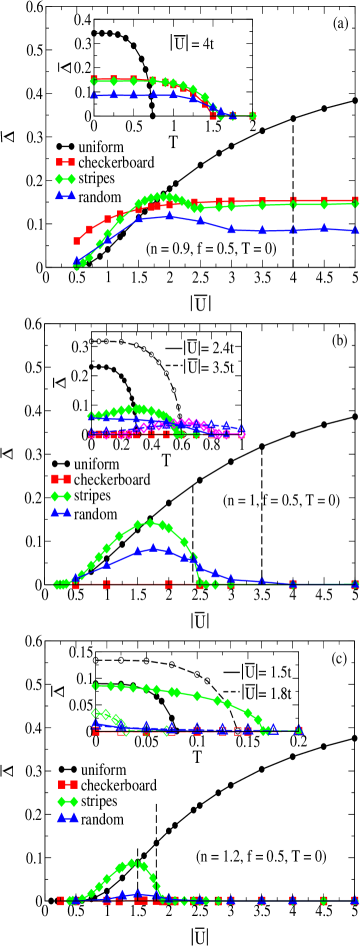
The SC transition temperature of a lattice with an inhomogeneous pattern of interacting sites can also be larger compared to a uniform interaction distribution on the same lattice. In this section, we investigate the conditions under which inhomogeneity in any form can lead to the enhancement of as a function of and at different concentration values . In Fig. 7, panel (a) presents the variation of the average order parameter and as functions of for , , and . We pick the value of , the largest in panel (a), at and plot both and as functions of in the inset inside panel (a). As seen in panel (a), for , has already exceeded all its inhomogeneous counterparts appreciably. Nevertheless, in the inset inside the same panel, for the inhomogeneous patterns are still larger than their uniform pattern counterpart at indicating the strong enhancement of .
For the uniform pattern at all values of and , we find in good agreement with the BCS prediction, , as expected from our mean field approach. In panel (b) in Fig. 7 for , however, for for which is slightly larger than , we find that for all inhomogeneous patterns (except the checkerboard whose at ) are also slightly larger than the uniform pattern as shown in the inset of the same panel. At for which becomes noticeably larger than , as presented in the inset inside panel (b), for the uniform pattern also becomes larger than its inhomogeneous pattern counterparts. In other words, the enhancement of is rather weak when compared to and ceases to persist as increases. In panel (b), the checkerboard pattern has a vanishing average order parameter at both and finite . For stripes, starts with a finite value at and gradually vanishes as increases. For the random pattern, starts at a value very close to zero at . However, at as increases, there is a slight rise in the magnitude of over some finite temperature window before it completely vanishes at high enough .
In Fig. 8, panel (a) presents similar results for at and . As illustrated in the inset of the same figure, even at for which , all inhomogeneous patterns lead to larger compared to the uniform pattern. In panel (b), for , at , . However, except for the checkerboard, we still find an increase in due to inhomogeneity. Similar to Fig. 7 panel (b), for both striped and random patterns, we also find a gradual increase in as increases before it totally vanishes at high enough . The enhancement of continues to persist up to , although for all inhomogeneous patterns, due to the gradual increase of with temperature. Panel (c) corresponds to and it can be observed that for , for stripes only, is increased. However, at slightly larger , for the uniform pattern significantly dominates the inhomogeneous pattern ones and no gradual increase in occurs as increases.
Fig. 9(a) has and . Similar to the behavior observed for and when , up to the largest value of , inhomogeneity significantly increases as illustrated in the inset of the same panel. This occurs despite the fact that . For , even at where , for both the striped and random patterns we again find an increase in due to inhomogeneity. In this case, the gradual increase in as a function of is further pronounced until totally vanishes for these two patterns at high enough . Panel (c) corresponds to and similar to and cases when , for large enough (slightly larger than in the inset) inhomogeneity no longer yields larger compared to the uniform. (See inset.)
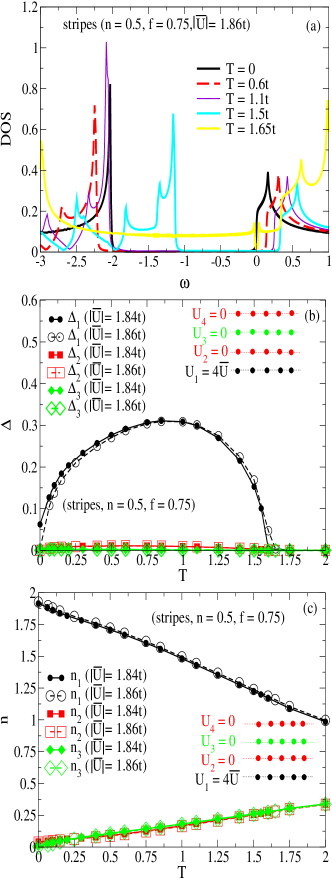
The anomalous increase of as a function of at for is an actual feature and is believed to be related to the gradual destruction of the charge ordered phase due to temperature leading to an intermediate SC phase. In Fig. 10 corresponding to Fig. 9, panel (b) for , and , panel (a) presents the DOS results at several values within the temperature window of the inset in Fig. 9 panel (b). At , the gap in the DOS is barely non-zero at (Fermi energy) indicating a charge ordered phase. By increasing to the gap widens towards superconductivity consistent with the behavior shown inside the inset in Fig. 9, panel (b). By further increasing , the gap begins to shrink due to the destruction of superconductivity by temperature until it entirely vanishes at in agreement with the results inside the inset in Fig. 9, panel (b).
Panel (b) in Fig. 10 illustrates the variation of the local order parameter on all four different types of sites for stripes at . Only along the line of interacting sites varies appreciably as increases. Panel (c) of Fig. 10 shows the local occupation numbers on all the four different types of sites for stripes at (Fig. 1, panel (b)). By increasing , while the occupation of the interacting sites gradually drops from to , an indication of the destruction of the charge ordered phase, the occupation of the non-interacting sites grows leading to additional mobility and overlap of the Cooper pairs and therefore enhancing .
Fig. 11, panel (a) shows the DOS results for the random pattern for , and depicted in Fig. 9, panel (b). Similar to stripes, over the window of temperature studied in panel (a), the gap in the DOS initially grows up to and then gradually drops to zero slightly beyond to indicate the formation of a metallic phase as the temperature destroys superconductivity. Panel (b) in Fig. 11 also shows significant variation of the local order parameter only on the interacting sites on average. Hence, similar to stripes, temperature acts against the more localized charge ordered phase allowing for the Cooper pairs to move and overlap more freely and consequently the enhancement of . Panel (c) also confirms that the charge ordered phase is indeed destroyed by temperature allowing the non-interacting sites to become more occupied resulting in an intermediate SC phase. Metallic behavior is established at sufficiently high temperature.
It is also noteworthy that this anomalous increase in was not observed for the checkerboard pattern for which there is no superconductivity at any temperature when . One possible explanation is that due to the particular geometry for the checkerboard, localized Cooper pairs are further apart from one another compared to the striped and random patterns. As mentioned earlier, when we have two electrons per interacting site. For the checkerboard lattice, this leads to a pair localized in the interacting sites with empty nearest neighboring sites. Therefore, the effect of temperature is minor in causing further overlap among the pairs before it totally destroys them (especially at and as shown in Fig. 1, panel(a)).
A similar increase in upon introducing a checkerboard pattern is found in the MCMF calculations as well, arising from the loss of long-range phase coherence. This is particularly significant because the MCMF incorporates the subtle nature of the SC transition in discussed earlier. We have also independently confirmed that our conclusions and arguments equally apply for a model with nearest-neighbor attraction, leading to a -wave SC close to half-filling, which reflects the cuprates’ phenomenology more truthfully.olderwork ; mayr
We have found that upon introducing inhomogeneity into the pattern of interacting sites on a lattice. can be increased over a wide range of as long as even if . When , however, for sufficiently large , inhomogeneity acts against superconductivity and therefore becomes smaller compared to the uniform pattern of interacting sites. The case of is anomalous. The charge ordered phase established at large enough values at gradually vanishes as increases. first increases with increasing T, leading to a SC phase (at least for large enough values and lower symmetrical inhomogeneity patterns), and then vanishes, indicating a metallic state.
V Summary and Discussion
In summary, we have shown that for the attractive Hubbard model on a square lattice, there is a significant range of electron doping and interaction strength over which the average superconducting order parameter is larger for a lattice with inhomogeneous patterns of interacting sites than a uniform distribution of these interacting sites at a constant interaction strength per site. We have presented the phase diagrams for three different inhomogeneous patterns: checkerboard, stripes and random and also three different values for the concentration of the non-interacting sites. Apart from a few particular features, the overall physics illustrated in the phase diagrams is pattern independent. As we vary the mean interaction strength and the doping level at zero temperature, we have verified the existence of at least three different phases, namely (i) superconducting, (ii) insulating due to the charge order phases, and (iii) metallic. Our findings and claims are strongly supported by studying the behavior of a variety of quantities computed in this work all consistently corroborating one another.
The enhancement of the average order parameter for the inhomogeneous interacting site patterns is due to the proximity effect, i.e., the tunneling effect of the Cooper pairs from the interacting sites leading to finite order parameter values on neighboring sites. This conclusion is supported by the effect occurring at weak coupling, where the coherence length is large, rather than in the strong coupling regime of preformed pairs. Agreement between the BdG results and the MCMF calculations justifies the application and conclusions of the BdG approach within the small regime. Our calculations also clearly confirm that an inhomogeneous interaction potential can lead to the increase in the phase transition temperature over a wide range of , and for various values. Counterintuitively, as long as is less than or equal to twice the fraction of interacting sites, this increase in continues even for values of for which the order parameter is larger for the uniform pattern than for inhomogeneous patterns at .
One possible explanation takes into account that in this weak coupling parameter regime, is a supralinearly increasing function of . In such a case, it may be that in the inhomogeneous system the sites with larger produce a nonlinear enhancement relative to of the uniform system and, through the proximity effect, drag the non-interacting sites along with them. This trend changes when exceeds twice the number of interacting sites (ı.e. some electrons must occupy non-interacting sites), for which at large enough values inhomogeneity fails to increase over that of the uniform pattern. The case for sufficiently large values and less symmetric inhomogeneous patterns (such as stripes and random as opposed to the checkerboard) is anomalous as it shows the enhancement of as temperature increases.
It is even more surprising to find that a system which is non-superconducting (charge ordered insulator) at can become superconducting upon increasing for a finite window of temperature before turning metallic. This anomalous behavior was shown to be related to a crossover from a charge ordered insulating phase for at large enough values to an intermediate SC phase upon increasing before entering the metallic phase at sufficiently large .
We wish to emphasize that in this article we have focused on the enhancement (or not) of the pairing amplitude (our defined in section II), rather than its product with the local interaction strength which is more directly related to the gap but contains less information, and gives less insight, because it automatically vanishes on any site without interaction. Thermodynamic measurements would probe quantities which include the energy scale, such as the specific heat or superfluid rigidity which our results may not have direct implications to. However, for an inhomogeneous system being a mixture of different phases, defining an average SC gap is not trivial. Thus, the thermodynamic properties of inhomogeneous superconductors will not necessary exhibit the same behavior as their homogeneous counterparts. It has been shown that the rise of the specific heat in inhomogeneous superconductors obeys a power law behavior as opposed to exponential in homogeneous ones using the attractive Hubbard model with random interacting sites. litak2 Also, the superfluid density and stiffness in general decrease due to the presence of disorder. paramekanti Nevertheless, lower superfluid density does not necessarily lead to lower as according to the Anderson theorem, a non magnetic impurity should not affect the and therefore thermodynamic properties of a s-wave superconductor. We have presented clear evidence for the enhancement of which does have a direct experimental implication. Thermodynamic properties of inhomogeneous superconductors are very rich in physics and a great deal of contributions and new ideas in this area are yet to appear.
While the attractive Hubbard Hamiltonian obviously does not incorporate many of the features of high superconductors (notably the symmetry of the pairing), the model has been shown to provide useful insight into some of their phenomenology, for example the spin-gap.randeria94 It is therefore tempting to speculate that our results concerning inhomogeneity may have similar connections. Specifically, earlier ARPES data yoshida03 suggests that the underdoped phase of LSCO (La2-xSrxCuO4) consists of SC clusters, embedded in the AF host. In such a system, inhomogeneous gaps appear naturally and our results here indicate that the SC transition is in fact determined by the largest gap values rather than the much smaller gaps found at phase boundaries, as one might naively think. This renders the SC phase more stable than it would otherwise be, and also simplifies the description of these systems.
It is worth emphasizing that in most situations, inhomogeneities reduce values of order parameters chatterjee and critical temperatures, even when comparisons are made, as they are in this article, to homogeneous systems with the same average value of all parameters. This is true, for example, for classical site diluted Ising models, where the ferromagnetic is increased to compensate for absent sites, and quantum models like the boson Hubbard model where random chemical potentials monotonically decrease and ultimately destroy superfluidity.fisher89 ; scalettar91 An exception is the increase of by randomness reported in DMFT studies of the repulsive model ulmke95 and recently, the SC in model Hamiltonian with certain types of inhomogeneous patterns for the coupling constant between spins sitting on nearest neighboring sites. loh .
VI Acknowledgments
We acknowledge useful conversations with Jian-Xin Zhu and Wei Ku. This research was supported by National Science Foundation Grant DMR-0421810, DMR-0426826, US ONR, CNPq-Brazil and FAPERJ-Brazil.
References
- (1) Inhomogeneous Superconductors-1979, Proceedings of the Conference on Inhomogeneous Superconductors, AIP Conf. Proc. No. 58, edited by D. U. Gubser, T. L. Francavilla, J. R. Leibowitz, and S. A. Wolf (AIP, New York, 1979).
- (2) Percolation, Localization, and Superconductivity, edited by A. M. Goldman and S. A. Wolf (Plenum, New York, 1984).
- (3) E. Dagotto, Rev. Mod. Phys. 66, 763 (1994).
- (4) P.A. Lee and T.V. Ramakrishnan, Rev. Mod. Phys. 57, 287 (1985).
- (5) D. Belitz and T. R. Kirkpatrick, Rev. Mod. Phys. 66, 261 (1994).
- (6) T. Cren, D. Roditchev, W. Sacks, J. Klein, J.-B. Moussy, C. Deville-Cavellin, and M. Laguës, Phys. Rev. Lett. 84, 147 (2000).
- (7) S.-H. Pan, J.P. O’Neal, R.L. Badzey, C. Chamon, H. Ding, J.R. Engelbrecht, Z. Wang, H. Eisaki, S. Uchida, A. K. Gupta, K.-W. Ng, E. W. Hudson, K. M. Lang, and J. C. Davis, Nature (London) 413, 282 (2001).
- (8) C. Howald, P. Fournier, and A. Kapitulnik, Phys. Rev. B 64, 100504(R) (2001).
- (9) K. M. Lang, V. Madhavan, J. E. Hoffman, E. W. Hudson, H. Eisaki, S. Uchida, and J. C. Davis, Nature (London) 415, 412 (2002).
- (10) K. McElroy, D.-H. Lee, J. E. Hoffman, K. M. Lang, J. Lee, E. W. Hudson, H. Eisaki, S. Uchida, and J. C. Davis, Phys. Rev. Lett. 94, 197005 (2005).
- (11) T. Hanaguri, C. Lupien, Y. Kohsaka, D.-H. Lee, M. Azuma, M. Takano, H. Takagi, and J. C. Davis, Nature 430, 1001 (2004).
- (12) M. Vershinin, S. Misra, S. Ono, Y. Abe, Y. Ando, and A. Yazdani, Science 303, 1995, (2004).
- (13) H. A. Mook, P. Dai, and F. Dogan, Phys. Rev. Lett. 88 , 097004 (2002).
- (14) J. M. Tranquada, J. D. Axe, N. Ichikawa, A. R. Moodenbaugh, Y. Nakamura, and S. Uchida, Phys. Rev. Lett. 78, 338 (1997).
- (15) Ch. Renner, G. Aeppli, B.-G. Kim, Y.-A. Soh, and S.-W. Cheong, Nature 416, 518 (2002).
- (16) J. Burgy, A. Moreo, and E. Dagotto, Phys. Rev. Lett. 92, 097202 (2004).
- (17) A. Moreo, S. Yunoki, and E. Dagotto, Science 283, 2034 (1999).
- (18) E. Dagotto, T. Hotta, and A. Moreo, Phys. Rep. 344, 1 (2001).
- (19) M. L. Foo, Y. Wang, S. Watauchi, H. W. Zandbergen, T. He, R. J. Cava, and N. P. Ong, Phys. Rev. Lett. 92, 247001 (2004).
- (20) K.-W. Lee, J. Kunes, P. Novak, and W. E. Pickett, Phys. Rev. Lett. 94, 026403 (2005).
- (21) J. Zaanen and O. Gunnarsson, Phys. Rev. B 40, R7391 (1989).
- (22) K. Machida, Physica C 158, 192 (1989).
- (23) M. Kato, K. Machida, H. Nakanishi and M. Fujita, J. Phys. Soc. Jpn., 59, 1047 (1990).
- (24) S. R. White and D. J. Scalapino, Phys. Rev. B 70, 220506(R) (2004) .
- (25) M. Vojta, Phys. Rev. B 66, 104505 (2002).
- (26) G. Seibold, C. Castellani, C. Di Castro and M. Grilli, Phys. Rev. B 58, 13506 (1998).
- (27) S. A. Kivelson and E. Fradkin, cond-mat/0507459.
- (28) H.-X. Huang, Y,-Q. Li, J.-Y. Gan, Y. Chen, and F.-C. Zhang, Phys. Rev. B 75, 184523 (2007).
- (29) M. M. Maśka, Ż. Śledź, K. Czajka, and M. Mierzejewski, cond-mat/0703566.
- (30) W.-F. Tsai and S. A. Kivelson, Phys. Rev. B 73, 214510 (2006).
- (31) G. Seibold, J. Lorenzana, and M. Grilli, Phys. Rev. B 75, 100505 (2007).
- (32) A. Garg, M. Randeria, and N. Trivedi, Phys. Rev. Lett. bf 97, 046403 (2006).
- (33) D. Zhang, cond-mat/0607762.
- (34) J. A. Robertson, S. A. Kivelson, E. Fradkin, A. C. Fang, and A. Kapitulnik, Phys. Rev. B 74, 134507 (2006).
- (35) A. Ghosal, M. Randeria, and N. Trivedi, Phys. Rev. B 65, 014501 (2001).
- (36) V. Dobrosavljevic, T.R. Kirkpatrick, and G. Kotliar, Phys. Rev. Lett. 69, 1113 (1992).
- (37) V. Dobrosavljevik, T.R. Kirkpatrick, and G. Kotliar, Phys. Rev. B 50, 1430 (1994).
- (38) V. Dobrosavljevic, A.A. Pastor, and B.K. Nikolic, Europhys. Lett. 62, 76 (2003).
- (39) A. J. Coleman, E. P. Yukalova, and V. I. Yukalov, Physica C 243, 76 (1995)
- (40) V. I. Yukalov and E. P. Yukalova, Phys. Rev. B 70, 224516 (2004)
- (41) D. Valdez-Balderas and D. Stroud, Phys. Rev. B 74, 174506 (2006).
- (42) K. Seo, H-D. Chen, and J. Hu, Phys. Rev. B 76, 020511(R) (2007).
- (43) B. M. Andersen, A. Melikyan, T. S. Nunner, and P. J. Hirshfield, Phys. Rev. B 74, 060501(R) (2006).
- (44) E. S. Caixeiro, E. V. L. de Mello, and A. Troper, cond-mat/0508381.
- (45) R. Jamei, J. Robertson, E-A. Kim, A. Fang, A. Kapitulnik, and S. A. Kivelson, Phys. Rev. B 74, 174521 (2006).
- (46) A. Melikyan, and Z. Tes̆anović, Phys. Rev. B 71, 214511 (2005).
- (47) Z. Tes̆anović, Phys. Rev. Lett. 93, 217004 (2004).
- (48) I. Martin, D. Podolsky and S. A. Kivelson, Phys. Rev. B 72, 060502(R) (2005).
- (49) K. Aryanpour, E. R. Dagotto, M. Mayr, T. Paiva, W. E. Pickett, and R. T. Scalettar, Phys. Rev. B 73, 104518 (2006).
- (50) Y. L. Loh and E. W. Carlson, Phys. Rev. B 75, 132506 (2007).
- (51) B. Chatterjee, and A. Taraphder, cond-mat/0702150.
- (52) Y. Matsushita, H. Bluhm, T. H. Geballe, and I. R. Fisher, Phys. Rev. Lett. 94, 157002 (2005).
- (53) Y. Matsushita, P. A. Wianecki, A. T. Sommer, T. H. Geballe, and I. R. Fisher, Phys. Rev. B 74, 134512 (2006).
- (54) M. Dzero and J. Schmalian, Phys. Rev. Lett. 94, 157003 (2005).
- (55) R. Micnas, J. Ranninger and S. Robaskiewicz, Rev. Mod. Phys. 62, 113 (1990) and references therein.
- (56) S. Robaszkiewicz, R. Micnas, and K. A. Chao, Phys. Rev. B 23, 1447 (1981).
- (57) H. Shiba, Prog. Theor. Phys. B 48, 2171 (1972).
- (58) V. J. Emery, Phys. Rev. B 14, 2989 (1972).
- (59) G. Litak and B. L. Györffy, Phys. Rev. B 62, 6629 (2000).
- (60) D. Hurt, E. Odabashian, W. E. Pickett, R. T. Scalettar, F. Mondaini, T. Paiva, and R. R. dos Santos, Phys. Rev. B 72, 144513 (2005).
- (61) M. Mayr, G. Alvarez, C. Şen, and E. Dagotto, Phys. Rev. Lett. 94 , 217001 (2005).
- (62) G. Litak, J. Magn. Magn. Mater. 272-276 (2004) 966-967
- (63) A. Paramekanti, N. Trivedi, and Mohit Randeria, Phys. Rev. B 57, 11639 (1998).
- (64) M. Randeria in Bose Einstein Condensation, A. Griffin, D. Snoke, and S. Stringari (eds), Cambridge University Press (1994), and references cited therein.
- (65) T. Yoshida, X. J. Zhou, T. Sasagawa, W. L. Yang, P. V. Bogdanov, A. Lanzara, Z. Hussain, T. Mizokawa, A. Fujimori, H. Eisaki, Z.-X. Shen, T. Kakeshita, and S. Uchida, Phys. Rev. Lett. 91, 027001 (2003).
- (66) M. P. A. Fisher, P. B. Weichman, G. Grinstein, and D. S. Fisher, Phys. Rev. B 40, 546 (1989).
- (67) R. T. Scalettar, G. G. Batrouni, and G. T. Zimanyi, Phys. Rev. Lett. 66, 3144 (1991).
- (68) M. Ulmke, V. Janis, and D. Vollhardt, Phys. Rev. B 51, 10411 (1995).