Rapid formation of exponential disks and bulges at high redshift
from the dynamical evolution of clump cluster and chain galaxies
Abstract
Many galaxies at high redshift have peculiar morphologies dominated by M⊙ kpc-sized clumps. Using numerical simulations, we show that these “clump clusters” can result from fragmentation in gravitationally unstable primordial disks. They appear as “chain galaxies” when observed edge-on. In less than 1 Gyr, clump formation, migration, disruption, and interaction with the disk cause these systems to evolve from initially uniform disks into regular spiral galaxies with an exponential or double-exponential disk profile and a central bulge. The inner exponential is the initial disk size and the outer exponential is from material flung out by spiral arms and clump torques. A nuclear black hole may form at the same time as the bulge from smaller black holes that grow inside the dense cores of each clump. The properties and lifetimes of the clumps in our models are consistent with observations of the clumps in high redshift galaxies, and the stellar motions in our models are consistent with the observed velocity dispersions and lack of organized rotation in chain galaxies. We suggest that violently unstable disks are the first step in spiral galaxy formation. The associated starburst activity gives a short timescale for the initial stellar disk to form.
1 Introduction
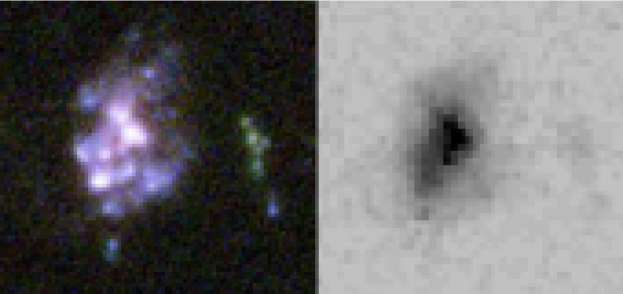
Galaxies at redshifts larger than become increasingly clumpy with star formation in kpc-size complexes containing M⊙ that are several hundred Myr old (see review in Elmegreen 2007). A remarkable morphology is that of “chain galaxies” with large visible clumps aligned along one axis (Cowie, Hu & Songaila 1995; van den Bergh et al. 1996; Moustakas et al. 2004). These are rare in the Local Universe (e.g., Abraham et al. 1996) but much more frequent at redshift (Elmegreen et al. 2005a, hereafter EERS05). Dalcanton & Schectman (1996) suggested that chain galaxies could be edge-on LSBs. However, the clumps are much more massive than those observed in the UV in nearby edge-on disks (e.g., Smith et al. 2001), and the actual face-on counterparts of chain galaxies at high-redshift are observed to be starburst disks with kpc-sized clumps – the so-called “clump cluster galaxies” (Elmegreen, Elmegreen & Hirst 2004, see the example of UDF 1666 in Fig. 1 from EERS05). Both clumpy types are found up to the bandshifting limit of (Elmegreen et al. 2007a, hereafter EERC07). Ring (Elmegreen & Elmegreen 2006a) and interacting (Elmegreen et al. 2007b) galaxies at high redshift are also very clumpy. Distant ellipticals can be clumpy too, as found in the Tadpole and A1689 cluster fields (Menanteau et al. 2004, 2005) and the Ultra Deep Field (UDF; Elmegreen, Elmegreen, & Ferguson 2005). Clumpiness in high redshift galaxies has been quantified with the parameter by Conselice (2003) and Conselice et al. (2004).
O’Neil et al. (2000) suggested that chains could be knotty disks seen edge-on; otherwise the edge-on counterparts of face-on disks would be missing at high redshift. Taniguchi & Shioya (2001) proposed that chains are filaments of clumps about to merge into elliptical remnants. Detailed observations actually confirm that chain and clump-cluster galaxies are mostly a single class of objects that are clumpy disks viewed in different orientations: the two types have equivalent sizes, magnitudes, and redshift ranges, and their clumps have similar properties (Elmegreen & Elmegreen 2005, hereafter EE05, and EERC07). Their combined distribution of axial ratios is flat, as it is for a single disk population (EE05). In a sample of 10 extremely clumpy galaxies in the UDF, the fraction of the light in the clumps was found to be % and the fraction of the total stellar mass was % (EE05). On average in the UDF, the luminosity fraction of the clumps in 178 clump-cluster galaxies is %, and the luminosity fraction of the clumps in 269 spiral galaxies is %, not counting the bulges in the latter (EERS05). Comparisons between ACS and NICMOS images of clump cluster and chain galaxies confirm that the clumps are intrinsic to the mass and are not rest-frame blue patches on a smooth underlying disk (EERC07). The clumps therefore represent a large fraction of the mass in these galaxies, unlike the clumps in modern spirals.
Clump clusters and chains have irregular and somewhat flat luminosity profiles – different from spirals, which have bulges and exponential disks. However, the azimuthally averaged number density of clumps as a function of radius in UDF clump clusters, when normalized to the galaxy sizes, is similar to that of the (smaller) clumps in the spirals, and both distributions are close to exponential (Elmegreen et al. 2005b, hereafter EEVFF05). This equivalence suggests that exponential disks and bulges in spiral galaxies generally form by the dissolution of clumps in clump cluster and chain galaxies. Consistent with this scenario is the observation that the earliest disks in the Universe are clump clusters and chains (EERC07). Thus, clump cluster galaxies may evolve into spirals, making the “proto-spiral” nomenclature for this type in van den Bergh et al. (1996) remarkably prescient.
The purpose of this article is to simulate the evolution of clump-cluster galaxies and determine their final state. Noguchi (1999) and Immeli et al. (2004a,b) also simulated gravitational collapse in highly gaseous disks and found that they formed giant clumps that interact and eventually merge into a bulge. They did not consider the final disk profile and their galaxies had the masses and sizes of modern galaxies. Here we consider disks that are about half of this size as observed in the UDF (EERC07). We show that initially uniform unstable disks evolve quickly through a clump cluster phase and end up with bulges and double-exponential profiles. The absence of clear rotation in chain and clumpy galaxies (Bunker et al. 2000; Erb et al. 2004; Weiner et al. 2006) is also explained: the massive clumps severely affect the velocity fields and enhance the disk velocity dispersion.
The numerical techniques and initial conditions are described in Sect. 2. We study the properties and evolution of clump cluster and chain galaxies and the formation of exponential disks in Sect. 3. In Sect. 4, we discuss the results and compare with the evolution of stable spiral disks. Sect. 5 considers the formation of nuclear black holes. Our conclusions are summarized in Sect. 6.
2 Simulations
2.1 Code description
We model the evolution of Jeans-unstable gas-rich galactic disks using a particle-mesh sticky-particle code (see Bournaud & Combes 2002, 2003). The grid resolution and gravitational softening are 110 pc. Stars, gas, and dark matter halo are modeled with one million particles each. Unless specified otherwise, we use sticky-particle parameters (defined as in Bournaud & Combes 2002).
Star formation is described by a local Schmidt law. At each timestep, the probability for each gas particle to be transformed into a stellar particle is proportional to the local gas density to the exponent 1.4 (e.g., Kennicutt 1998), the proportionality factor being computed to provide a star formation rate of M☉ yr-1 in the initial uniform disk, equivalent to a timescale for gas consumption of 5 Gyr (before the formation of dense clumps increases the star formation rate). Feedback from star formation is not implemented in this study; the consequences of this choice are discussed in Section 4.2.
2.2 Initial conditions
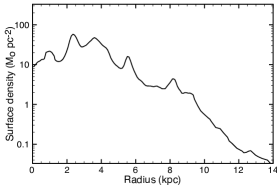
We start the simulations with a flat and bulgeless disk of gas and stars, which is Jeans-unstable and has a uniform surface density. This is because clump cluster galaxies are not observed to have a bulge, and they have irregular radial profiles. For instance, the typical clump cluster galaxies UDF 3752 and UDF 82+99+103 in EEVFF05, and UDF 1666 shown here in Figure 1, have an irregular profile, which on large scales is rather flat. The azimuthally averaged radial profiles for these three galaxies are irregular as well, showing a central minimum for UDF 82+99+103 and UDF 1666, prominent bumps at several radii, and either a flattening (UDF 3752) or a slow taper from the gradient in clump number density out to the edge (UDF 1666). To study the formation of exponential disks from clump clusters we thus have to start with a disk that does not already have a concentrated nearly-exponential profile. The instabilities will rapidly make it irregular.
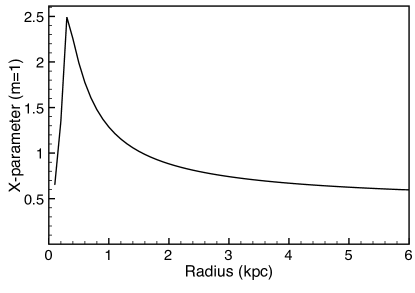
The initial disk radius is 6 kpc and its mass M☉, comparable to the observed properties of systems (e.g., EEVFF05). The initial thickness is pc with a vertical mass distribution, which ensures that, once instabilities begin to heat the system, the thickness is compatible with the observed average of kpc (fitted on profiles, Elmegreen & Elmegreen 2006b). Stars initially have a Toomre parameter . The dark halo is a Plummer sphere of radial scale-length 15 kpc. The velocity dispersion of the gas , gas mass fraction in the disk , and halo-to-disk mass ratio (measured inside the initial disk radius) are varied as indicated in Table 1. The fiducial run 0 has km s-1, and , the resulting Toomre X-parameter (Toomre 1964) is shown as a function of radius on Figure 2; this parameter is defined by:
| (1) |
where and are the epicyclic frequency and surface density, respectively. We show on Figure 2 the value of for an azimuthal wavenumber .
For further comparisons, we also performed a control run (run C-4) with the same mass distribution as run 4, but initially stable with and a gas turbulent speed computed at each radius to ensure . The sticky-particle parameters are changed to to avoid global disk instabilities from kinematical cooling. As a result of these changes, C-4 follows the evolution of a spiral galaxy instead of a clump cluster. We ran this test analogous to run 4 because this run has the lowest gas fraction and is the most easily stabilized with a modest gas turbulent speed.
We also changed the sticky-particles parameters in run SP-0: the initial conditions are that of run 0, but and to conserve angular momentum with about the same rate of energy dissipation.
2.3 Clump detection and analysis
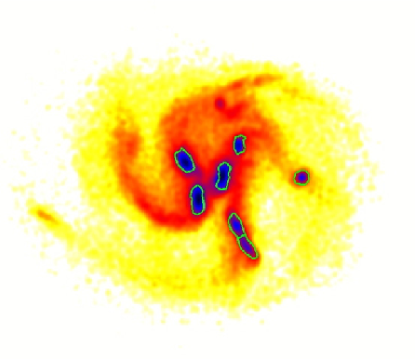
Because the simulated disks are unstable to fragmentation, we need to detect the large clumps that form in order to measure their masses and other related quantities. Because observations define clumps as morphological entities, we chose to detect clumps in the simulated galaxies from morphological criteria too. This is made every 50 Myr, on face-on projected density maps, smoothed at a resolution of 200 pc to decrease the particle noise. We compute the average surface density as a function of radius . First, clumps must represent local overdensities compared to the average density at the same radius. We then keep the pixels with 111This choice was made because in some cases overdensities with were found to include spiral arms in spite of the maximum size criterium.. We consider only the regions less extended than 3 kpc, which was found to eliminate spiral arms. The remaining regions are considered as “clumps” if their mass is at least M☉, for we consider only the high-mass clumps in this study. The regions obtained this way are split into two clumps if there are two luminosity peaks and that are separated by pixels with , i.e. a significant interclump contrast, and each new clump is above the mass threshold (we do not separate low-mass subclumps). An example of clump detection is shown on Figure 3.
To better understand the role of clumps in fueling the bulge and the disk (see below), we measured several mass fractions that are indicated for each run in Table 1. All these fractions are defined within the baryonic mass (gas and stars), not counting the dark matter halo component.
-
•
is the fraction of the baryonic mass that is concentrated in the clumps, taken at the instant of its highest value, the clump borders being defined as explained above.
-
•
is the gas fraction in the clumps, which is the fraction of the mass in the clumps defined above that is in the form of gas. The value in Table 1 is given at the same instant as .
-
•
is the fraction of the mass from the clumps (counted in ) that is in the bulge at the end of the simulation. is the mass fraction of the clumps that ends up in the disk.
-
•
is the fraction of the bulge mass that comes from the clumps, being the fraction of the bulge that does not come from the clump material.
-
•
is the fraction of the disk mass that comes from the clumps.
In these definitions, the disk mass is obtained by the integration of the fitted double-exponential profile described below. The bulge mass is then defined as the mass left over above this disk profile in the central regions, without any consideration of the bulge luminosity profile itself. Bulges were never found to contribute to the luminosity profile beyond kpc, so we decide that all particles at radii larger than 2 kpc are disk particles. Particles at radii kpc have a probability to be disk particles, where is the measured (total) surface density profile and the (fitted) density profile of the disk component. The probability that it is a bulge particle is . These two probabilities are limited to 1 and 0 respectively when fluctuations cause to be larger than . Thus, the definition of bulge and disk particles in the central regions is made on a simple statistical basis that retrieves the mass and radial distribution of each component. More advanced criteria might distinguish the bulge from the disk based on vertical distributions and velocity dispersions. However, significant differences from the present definitions would appear only in a narrow radial region around kpc, because at other radii one or the other of the two components dominates.
3 Results
3.1 Clump cluster evolution, disk and bulge fueling
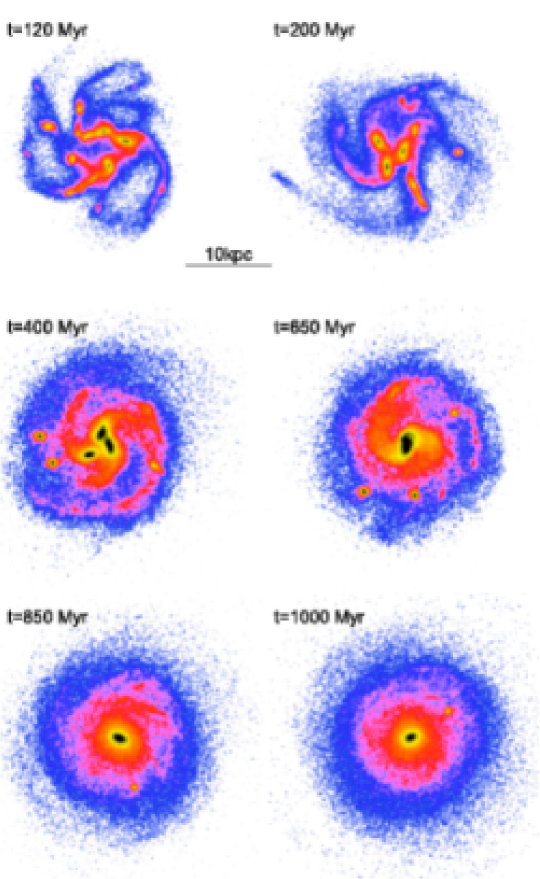
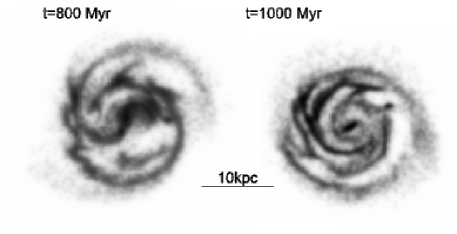
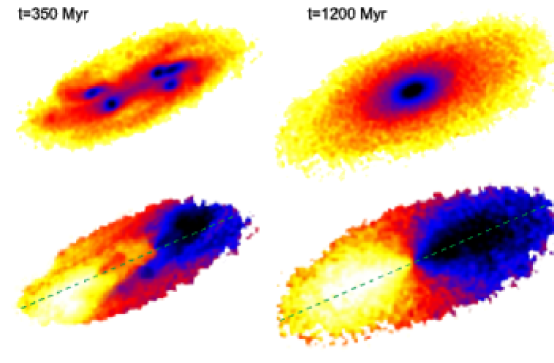
Figure 4 shows the evolutionary sequence for the fiducial run. The initial bulgeless disk is gravitationally unstable and makes several large clumps of stars and gas quickly. The clumps last Myr and gather of the total baryonic mass of the system at Myr, which is the time at which this fraction reaches its maximum. The mass fraction of the stars in these clumps compared to the total stellar mass is 29%. At this stage the clumps are gas-rich with a gas mass fraction of 56%, while the gas fraction over the whole galaxy at the same instant is 42%.
The clumps then progressively release their mass in the disk: at Myr the clump mass fraction has decreased to 27% from the initial 38%. They have formed stars rapidly with an average star formation rate between and Myr of 38 M☉ yr-1, and the gas mass fraction in the clumps has decreased from 56% to 37%. The star formation rate in the model is compatible with the observed average of 20 M☉ yr-1 in the real clumps (EE05), although the star formation efficiencies cannot be directly compared because of the unknown gas mass. At the same time, their mutual interaction and the friction on the halo and underlying disk bring the clumps to the galaxy center (Fig. 4) within a timescale of about 4 rotations, which is 0.5–0.7 Gyr. Later on, the galaxy resembles a spiral galaxy, with a central bulge and only a little mass in small remaining clumps. The final system is dominated by stars and shows weak density waves in the mass distribution (Fig. 4), which can be compared to smooth spiral arms in the old stellar populations of a spiral galaxy seen in near-infrared. The gas distribution at two late stages is shown in Figure 5 and has a stronger spiral structure. Other examples of simulated clump clusters are for run 6 in Figure 7 and run 4 in Figure 9.
The models in Noguchi (1999) and Immeli et al. (2004a,b) started with more massive disks and developed larger clumps, most of which migrated to the central spheroid, leaving only a faint disk whose radial profile was not considered. With our initial conditions more representative of high-redshift clump clusters, we obtain lower bulge mass fractions: the bulge-to-total mass ratio (including the halo) varies between 0.12 and 0.36 over our sample of simulations (Table 1), which correspond to bulge-to-disk ratios between 0.14 and 0.50. Hence, the galaxies resulting from clump cluster evolution are still disk-dominated galaxies after the bulge has formed.
3.2 Mass distribution and radial profile
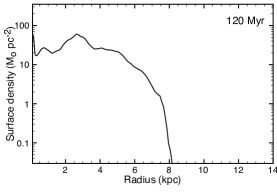
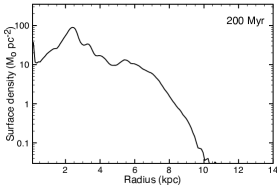
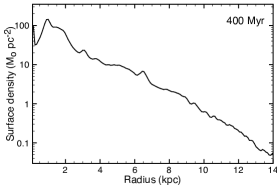
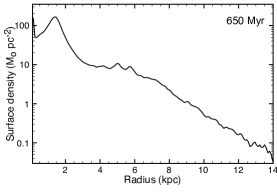
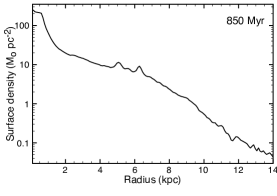
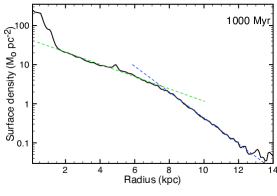
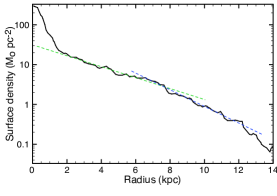
Figure 6 shows the azimuthally averaged radial profiles of the disk in the fiducial run corresponding to each snapshot in Figure 4. The disk starts with a flat profile that quickly becomes irregular during the clump cluster phase. Clump evolution then forms a bulge and an exponential disk. The exponential extends from about 1 to 7 kpc in radius with a scale length kpc. All other runs show a similar profile with a central bulge and a massive exponential disk after 1 Gyr or less (see Table 1), while the luminosity profile is irregular and bulgeless during the clump-cluster phase (see also Fig. 7 for another example in run 6).
The profile at Myr in Figure 6 and the corresponding image in Figure 4 resemble the azimuthally averaged profile and image of UDF1666 (Fig. 1), suggesting that this clump cluster galaxy is already in a somewhat advanced stage. It has no bulge yet but a nearly-central clump that could be a proto-bulge, and has begun to acquire a radial density gradient, but not yet a regular exponential. Some other clump clusters do not have any central clump and even more irregular profiles (like UDF 82+99+103 and UDF 3752 in EEVFF05) and these ones correspond to earlier stages of the clump-cluster evolution according to our models.
In our models with various initial conditions (see Table 1), the clumps gather =23 to 38% (average for all runs: 33%) of the system baryonic mass at the peak of the clump-cluster phase. This fraction decreases with time because shear and tidal fields distort the clumps, and they form stars which makes them easier to disrupt. Hence, all the mass from the clumps does not reach the bulge: =35–62 (average 50)% of the clump mass content is finally found in the bulge. The other half of the clump mass has been released in the disk. This way, the bulge gets most of its mass (=65–74, average 69%) from the clumps, the rest of its mass coming from material initially present at the disk center and severely heated and thickened when the clumps reach the inner regions and merge together.
As for the disk component, 17–26% of its mass
(average =23%) is made of material released
by the clumps during their migration towards the disk center.
Hence the clumps have two effects on the disk:
(i) they release mass into the disk, which has been driven
inward by the clump migration, making the disk density
profile more concentrated
(ii) they act on the disk material that is not in the clumps, and
redistribute it through gravity torques, in the same manner as
spiral density waves (e.g. Pfenniger & Friedli 1991), but more
rapidly (see Section 4.1).
Hence, the material released by the clumps and the material from the rest of the disk both evolve into a more concentrated distribution, which our simulation shows is an exponential disk with a bulge. We suggest later (Section 4.1) that it is almost entirely the clumps that are responsible for this evolution.
In addition to the main exponential disk, most runs actually end up with a second, outer exponential profile. In the fiducial run, the second exponential is from 7 to 13 kpc with a scale length of kpc (Fig. 6). At least six of the eight runs show such a double-exponential, all with a change in scalelength at around 7 kpc, comparable to the initial disk radius. It is noticeable that the knee in the luminosity profile occurs at the outer edge of the region initially affected by clump instabilities. One can see in Figure 4 that the clumps fling out some material in the form of spiral arms emerging from them: this feeds the outer disk component, which has a lower density and a steeper profile than the main exponential disk where the clumps evolve. The scale lengths and indicated in Table 1 correspond to the 1–7 kpc and 7–13 kpc ranges222The scale lengths have been computed as the best fitting parameter over the 2–6 and 8–12 kpc range, but are generally representative of the 1–7 and 7–13 kpc regions, as seen on Figure 6. Runs 5 and 6 have a change of slope that is small and might not desserve to be considered double-exponential: the double-exponential fit is robust in the models, but the change of slope could be difficult to detect in real images with a limited sensitivity. In the six other runs the ratio of the inner to outer exponential slopes is on average . Double-exponentials have been observed in local (e.g. Pohlen et al. 2002) and spirals (Pérez 2004), as well as in local irregulars (Hunter & Elmegreen 2006). The ratio of slopes for the observations at (Pérez 2004) is , compatible with those found in the present models.
4 Discussion
4.1 The role of clumps and other processes in making exponential disks
We find that massive clumps in a primordial disk galaxy form an exponential stellar disk with a bulge. There are other theoretical ways to make exponential disks too (e.g., Freeman 1970, Fall & Efstathiou 1980, Robertson et al. 2004). Pfenniger & Friedli (1991) suggest that spiral arm torques could make exponential profiles, although they started with a concentrated, near-exponential profile anyway (here we started with a flat profile).
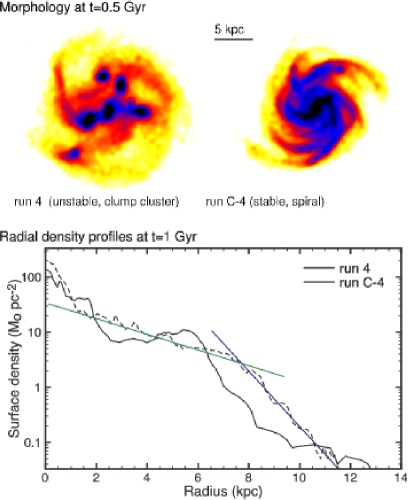
To understand the role of clumps and spirals, we compared our
clump-free control run C-4 with our clump-cluster model run 4. C-4
develops spiral arms; after 1 Gyr its luminosity profile is somewhat
concentrated but still irregular and far from
exponential (Fig. 9). This indicates that:
(i) the formation of the exponential disk in evolving clump
cluster and chain galaxies is caused by the clumps, i.e., by
the mass they release and by their gravitational action on the rest of the disk.
(i) the timescale to redistribute mass into an exponential
disk through spiral arms is significantly larger than the timescale
to redistribute mass by clump interactions. For example, the
exponential profile in the model by Pfenniger & Friedli (1991) took
5 Gyr to form. Massive disk clumps are therefore expected to
dominate the formation of exponential disks.
Furthermore, if the formation of exponential-like profiles were driven only by density waves, then there should be non-clumpy spiral disks with non-exponential profiles that have not yet had time to form exponentials. This contradicts the observation that irregular profiles are highly correlated with clump cluster and chain galaxies (EEVFF05). Also, the spiral mechanism would not work for dwarf irregulars, which have exponential disks too (Hunter & Elmegreen 2006). More likely, spirals adjust, maintain, and lengthen the first exponential as random accretions and interactions distort the disk over time. For example, spiral arms could increase the scale length over time in the period from to (EEVFF05). Disk shear viscosity with star formation can also make exponentials (Lin & Pringle 1987) but the timescale is too long, dwarfs with little shear have exponentials, and exponentials in the far outer regions could not be made this way if star formation is absent.
4.2 Modelling of the interstellar medium
The interstellar medium has been modeled with sticky particles. Such schemes do not strictly conserve angular momentum, but the actual loss is always much smaller than the angular momentum transferred by spiral torques in regular spirals (Bournaud, Combes & Semelin 2005). It should be negligible compared to angular momentum redistribution by clump interactions in clump clusters. To check this we ran simulation SP-0 conserving angular momentum during inelastic collisions between gas particles (described in Section 2.2). In this run, the bulge-to-disk mass ratio was slightly smaller, and the clumps released a slightly higher fraction of their mass in the disk, indicating that they are less gravitationally bound (Table 1). The changes are minor, however, and smaller than those corresponding to variations in or .
Feedback from star formation has not been included because its effects are not well known and it should not be excessively important. For example, feedback could heat the gas in the clumps and cause them to release mass more rapidly. The clumps already have masses of a few to M☉, which is an order of magnitude above proposed masses of objects that could be severely affected by supernovae (Dekel & Woo 2003). The effect of gas release would be to increase the disk mass relative to the bulge, which would strengthen our conclusion that clump clusters can evolve into spiral-like galaxies with massive disks. Variations in the gas fraction for the initial disk and for the clumps does not strongly affect the results (see Table 1, runs 4 and 5 vs. run 0). Clumps with higher gas fractions are more tightly bound because the mass in them is more concentrated, and then a slightly higher fraction of the clump mass reaches the bulge.
4.3 Comparison to real clump cluster and chain galaxies, and the thickness of disks
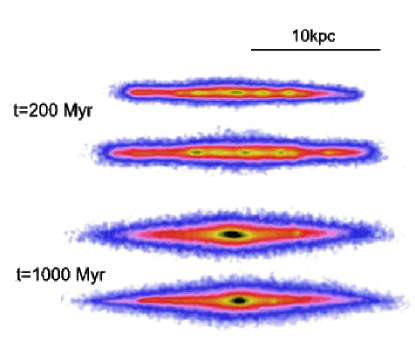
Figure 8 shows an edge-on view of the fiducial model of Figure 4. It resembles a chain galaxy with clumps aligned along the axis of a thick disk and no central bulge. This supports the statistical inference that observed chains are edge-on clump clusters.
The lifetime of the clump cluster phase in our model ( Gyr) is consistent with the average age of Myr observed for clumps (EE05). Our simulations suggest that disk galaxies undergo only one clump-cluster phase. After this, the resulting bulge and exponential disk cause the galaxy to be classified as a spiral. Large clumps can still form in the spiral disk, but the system is more stable at this stage because of the lower gas mass and higher velocity dispersion, so the clumps will be smaller and less important dynamically. Multiple clump-cluster phases could be possible only if a significant mass of gas accretes relatively quickly onto the disk after the first phase, making it unstable to form giant clumps again. Presumably these clumps would also disperse and add stellar mass to the disk and bulge.
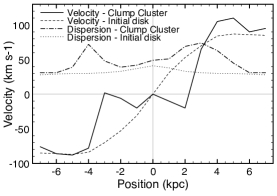
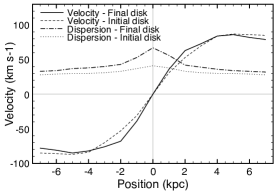
Figure 7 shows the velocity fields and rotation curves for Run 6 at each time step, obtained by viewing the disk at a 70 degree angle. During the clump-cluster phase, the linewidth is broadened and the rotation pattern is irregular because of clump-clump interactions. In the final galaxy, the velocity field is typical for spirals, although the dispersion is somewhat high. We predict that rotation in clump-clusters should be difficult to observe because of the turbulent and irregular motions. For example, if the outer parts of the disk in Figure 7 were not detected beyond the clumpy region, no organized rotation would be seen at all; only the high velocity dispersion would be evident. This may explain why Weiner et al. (2006) found that only 30% of the chain galaxies in their survey had clear evidence for rotation. Förster Schreiber et al. (2006) and Genzel et al. (2006) also found velocity dispersions higher than usual for clumpy, high-redshift galaxies.
In our models, the average values of deprojected measured between 3 and 6 kpc in radius at the end of the simulations are given in Table 1. They average to 2.7, which corresponds to a high velocity dispersion but still dominated by rotation. Presumably the dispersion of gas and new stars during the subsequent evolution will be much lower because there are no giant clumps to stir up the disk. Then the final stage will be a relatively quiet and thin rotating disk with a bulge and hot disk component from the clump cluster phase.
The final edge-on disk (Fig. 8) appears to be about the same thickness as the chains and edge-on spirals in the UDF, namely kpc (Elmegreen & Elmegreen 2006b). Actually, the population of stars already existing at the beginning of the simulation has a scale-height of 1.3 kpc, having been heated by the violent instabilities. The stars formed during the simulation have a scale-height of kpc (defined as in Section 2.2). Hence the final system is not made up only of a thick disk but has a massive thick component in addition to a younger and thinner stellar disk. The thick and thin disk components obtained here have comparable masses, which is compatible with observations of same-mass spirals ( km s-1 and below, Yoachim & Dalcanton 2006). This is also compatible with the disks at high redshift being thick or having a massive thick component that gets redder with height (Elmegreen & Elmegreen 2006b). Higher-mass present-day spirals like the Milky Way have higher thin-to-thick disk mass fractions (see Robin et al. 2003 for the Milky Way), suggesting that they further evolved after the primordial unstable phases, possibly having a massive thin disk grown by gas accretion (Bournaud & Combes 2002, Dekel & Birnboim 2006). The relatively thicker disks at high redshift compared to local spirals (Reshetnikov, Dettmar & Combes 2003) also suggests that present-day large spirals kept on evolving through a different process after the clump-cluster phase. Local spirals also have larger disks (Trujillo & Pohlen 2005) with larger exponential scale lengths (EEVFF05), which further indicate that the clump-clusters and chains at high redshift formed the first exponential disks, and afterwards secular evolution and mass accretion enlarged them to form the present-day spirals.
4.4 Nuclear Black Hole formation
According to Kormendy & Richstone (1995) and others, bulges always have black holes (BHs) with a mass proportional to the bulge mass. This suggests that any bulge formation model should also account for the simultaneous formation of central BHs. There should not be independent BH and bulge formation mechanisms. In this case, our model requires that intermediate mass BHs (IMBHs) form in the giant clusters of clump-cluster galaxies and migrate inward with the cluster cores. They would then have to coalesce in the galactic nuclei to make supermassive BHs. Simultaneous gas accretion could contribute too. To form QSOs at high redshift, this process would have to occur very quickly. While this seems possible for the densest and earliest disks that form – it takes only several orbit times for the giant clumps to make a bulge – cosmological and detailed disk simulations will be necessary to confirm the basic model. One prediction would be that clumps in clump cluster and chain galaxies should contain IMBHs, which implies the clumps should be X-ray and radio sources if self-absorption is not too large. Present-day observations cannot resolve the clumps well enough to determine if this is the case. An alternative model suggests that BHs form directly from accreted primordial gas without passing through stars first (e.g., Di Matteo et al. 2007). Observations of IMBHs in disks may be able to distinguish between these two possibilities.
The clump-cluster scenario for nuclear BH formation is consistent with one of the prominent models in the literature. Ebisuzaki et al. (2001) showed with N-body simulations that ultra-dense clusters can form BHs from stellar coalescence. They proposed that nuclear BHs grow from the coalescence of these cluster BHs and obtained the observed BH/bulge mass ratio of . Portegies Zwart & McMillan (2002) found a similar result; massive clusters with relaxation times less than 25 Myr have mass segregation, rapid core collapse, and runaway stellar coalescence that forms supermassive stars up to of the cluster mass. Portegies Zwart et al. (2004) applied this model to explain a suspected IMBH in a supermassive cluster of M82. Gürkan, Freitag & Rasio (2004) studied a cluster with stars; when the core-collapse time is less than the O-star lifetime, runaway collisions form IMBHs with masses that are always about of the cluster mass. More detailed models of stellar coalescence in dense cluster cores confirmed the formation of supermassive stars (Freitag, Gürkan, & Rasio 2006).
Portegies Zwart et al. (2006) followed the evolution of dense clusters in the Milky Way nuclear region and found that 10% form IMBHs during their inward migration. These IMBHs coalesce with the nuclear BH at a high enough rate to account for all of the nuclear BH mass. Matsubayashi, Makino, & Ebisuzaki (2007) also studied the coalescence of IMBHs to make supermassive BHs in galactic nuclei. They found that dynamical friction becomes ineffective close to the central BH, but that IMBH orbits become highly eccentric and spiral in quickly anyway because of gravitational radiation.
Our model for nuclear BH formation is qualitatively similar to these but it occurs at a much earlier stage in the life of a galaxy when the clusters are more massive and more dispersed in the main disk. Also in our model, the mass of the cluster BHs could be much larger than in these other models because the early disk clusters are more massive. If cluster BHs have of the cluster mass, then in our model the BHs would have M⊙. This should be enough to make a quick AGN in a moderate size disk galaxy, but subsequent accretion would be necessary to make larger nuclear BHs, and clump-cluster galaxy coalescence would be necessary to make supermassive BHs in elliptical galaxies.
5 Conclusions
Our simulations suggest that gas-rich disks in the early Universe collapse into giant star-forming clumps and resemble the clump cluster and chain galaxies observed in the UDF. Noguchi (1999) found similar fragmentation, as did Immeli et al. (2004b), who also suggested such disks are a likely origin for chain galaxies. Here we considered the observational consequences of clump interactions in such galaxies, and we determined the resulting structures of the galaxies.
The fragmentation of unstable primordial disks and the strong interactions between these fragments account for the observed kinematics of chain galaxies. Chain and clump cluster galaxies should be found to rotate, but the heightened turbulence and irregular orbits from clump-clump interactions make this rotation difficult to observe. These interactions should also add a large velocity dispersion. These predictions are consistent with the observations of chain galaxies by Weiner et al. (2006), and with the large velocity dispersions found in clump cluster galaxies by Förster Schreiber et al. (2006) and Genzel et al. (2006).
The clumps in our simulations form very quickly. They interact with each other, exchange angular momentum, migrate inward, dissolve, and perturb the underlying disk. These processes form a bulge+disk structure that is typical of spiral galaxies today, and they produce an exponential profile for the main disk component. About half of the clump mass goes into the disk within its initial truncation radius, and in most simulations an outer, steeper exponential forms from disk material that is flung out. The clump-cluster phase lasts for 0.5–1 Gyr and occurs only once during the life of a galaxy, unless there is a significant accretion event later. There may be other ways to make bulges or pseudo-bulges (e.g., Fu, Huang, & Deng 2003; Athanassoula 2005; Kormendy & Kennicutt 2004), but only the present model has been observed at high redshift in each of the important stages. Moreover, clump-cluster galaxies are usually bulgeless (EEVFF05), so if they evolve into normal, smooth-profile galaxies, then the bulge has to form at the same time as the clumps disperse. The other secular processes can only grow and evolve this first bulge later on.
An important implication of this result is that the continuous appearance of clump cluster galaxies throughout a wide range of redshifts means that disk galaxies start forming over an extended period of time. This long extent was also suggested by the star formation timescale in comparison to the local Hubble time (EERC07). Noeske et al. (2007) reach a similar conclusion based on the distribution of star formation rates over mass and time. When a disk becomes sufficiently massive through accretion, giant clumps form at the local Jeans mass by gravitational instabilities. A high velocity dispersion and a low initial disk column density put this Jeans mass at a high value, around M⊙. Clump interactions redistribute disk matter into the characteristic exponential form, and they thicken the disk to a kpc scale height, as observed at this stage. Clumping instabilities also cause starbursts, with a star formation rate typically enhanced by a factor of ten in the present models. These bursts are not related to interactions, although the large-scale environment should influence this kind of activity indirectly through its role in the growth of disks. Such internal bursting could explain the existence of active star-forming galaxies that appear to be isolated (Genzel et al. 2006). Exponential disks should continue to evolve after the clump-cluster phase, but the evolution should be more gradual and may involve the conventional spiral and bar torques applied to slowly accreting disks.
Supermassive black holes correlate with bulges and have to form very quickly in the life of a galaxy to explain QSOs and AGNs at high redshift. Based on published models for runaway growth of supermassive stars in dense cluster cores, we speculate that the clumps in clump cluster and chain galaxies rapidly form black holes with masses of M⊙, and that these black holes migrate inward as the bulges form to make nuclear black holes. This whole process should operate in several rotation periods of the disk, which can be fast or slow depending on the galaxy density and therefore on the epoch of galaxy formation. Simulations of this BH migration process will be discussed elsewhere.
References
- (1) Abraham, R.G., Tanvir, N.R., Santiago, B.X., Ellis, R.S., Glazebrook, K., & van den Bergh, S. 1996, MNRAS, 279, L47
- (2) Athanassoula, E. 2005, in Planetary Nebulae as Astronomical Tools, AIP Conf. Proceedings, Volume 804, p. 333
- (3) Bournaud, F., & Combes, F. 2002, A&A, 392, 83
- (4) Bournaud, F., & Combes, F. 2003, A&A, 401, 817
- (5) Bournaud, F., Combes, F. & Semelin, B. 2005, MNRAS, 364, L18
- (6) Bunker, A., Spinrad, H., Stern, D., Thompson, R., Moustakas, L., Davis, M., & Dey, A. 2000, ArXiv Astrophysics e-prints, arXiv:astro-ph/0004348
- (7) Combes, F., & Elmegreen, B.G. 1993, A&A, 271, 391
- (8) Conselice, C.J. 2003, ApJS, 147, 1
- (9) Conselice, C.J., Grogin, N.A., & Jogee, S. 2004, ApJ, 600, L139
- (10) Cowie, L.L., Hu, E.M., & Songaila, A. 1995, AJ, 110, 1576
- (11) Dalcanton, J. J., & Shectman, S. A. 1996, ApJL, 465, 9
- (12) Dekel, A., & Birnboim, Y. 2006, MNRAS, 368, 2
- (13) Dekel, A., & Woo, j. 2003, MNRAS, 344, 1131
- (14) Di Matteo, T., Colberg, J., Springel, V., Hernquist, L., & Sijacki, D. 2007, astroph/07052269
- (15) Ebisuzaki, T. et al. 2001, ApJ, 562, L19
- (16) Elmegreen, D.M. 2007, in IAU Symosium 235, ed. F. Combes & J. Palous, Cambridge: Cambridge Univ. Press, in press.
- (17) Elmegreen, D.M., Elmegreen, B.G., & Hirst, A.C., 2004, ApJ, 604, L21
- (18) Elmegreen, B.G., & Elmegreen, D.M. 2005, ApJ, 627, 623 (EE05)
- (19) Elmegreen, D.M., Elmegreen, B.G., & Ferguson, T.E. 2005, ApJ, 623, L71
- (20) Elmegreen, D.M., Elmegreen, B.G., Rubin, D.S., & Schaffer, M.A. 2005a, ApJ, 631, 85 (EERS05)
- (21) Elmegreen, B.G., Elmegreen, D.M., Vollbach, D.R., Foster, E.R., & Ferguson, T.E., 2005b, ApJ, 634, 101 (EEVFF05)
- (22) Elmegreen, D.M., & Elmegreen, B.G. 2006a, ApJ, 651, 676
- (23) Elmegreen, B.G, & Elmegreen, D.M. 2006b, ApJ, 650, 644
- (24) Elmegreen, D.M., Elmegreen, B.G., Ravindranath, S., & Coe, D.A., 2007a, ApJ, 658, 763 (EERC07)
- (25) Elmegreen, D.M., Elmegreen, B.G., Ferguson, T., & Mullan, B. 2007b, ApJ, 663, 734 (astroph/07040911)
- (26) Erb, D. K., Steidel, C. C., Shapley, A. E., Pettini, M., & Adelberger, K. L. 2004, ApJ, 612, 122
- (27) Fall, S. M., & Efstathiou, G. 1980, MNRAS, 193, 189
- (28) Förster Schreiber, N. M., et al. 2006, ApJ, 645, 1062
- (29) Freeman, K.C. 1970, ApJ, 160, 811
- (30) Freitag, M., Gürkan, M. A., & Rasio, F. A. 2006, MNRAS, 368, 141
- (31) Fu, Y. N., Huang, J. H., & Deng, Z. G. 2003, MNRAS, 339, 442
- (32) Genzel, R. et al. 2006, Nature, 442, 786
- (33) Gürkan, M. A., Freitag, M., & Rasio, F. A. 2004, ApJ, 604, 632
- (34) Hunter, D., & Elmegreen, B.G. 2006, ApJS, 162, 49
- (35) Immeli, A., Samland, M., Gerhard, O., & Westera, P. 2004a, A&A, 413, 547
- (36) Immeli, A., Samland, M., Westera, P., & Gerhard, O. 2004b, ApJ, 611, 20
- (37) Kennicutt, R.C., Jr. 1998, ApJ, 498, 541
- (38) Kormendy, J., & Kennicutt, R.C., Jr. 2004, ARA&A, 42, 603
- (39) Kormendy, J., & Richstone, D. 1995, ARAA, 33, 581
- (40) Lin, D.N.C., & Pringle, J.E. 1987, MNRAS, 325, 781
- (41) Matsubayashi, T., Makino, J., & Ebisuzaki, T. 2007, ApJ, 656, 879
- (42) Menanteau, F., et al. 2004, ApJ, 612, 202
- (43) Menanteau, F., et al. 2005, ApJ, 620, 697
- (44) Moustakas, L.A. et al. 2004 ApJ, 600, 131
- (45) Noeske, K.G., Faber, S.M., Weiner, B.J., et al. 2007, ApJ, 660, L47
- (46) Noguchi, M. 1999, ApJ, 514, 77
- (47) O’Neil, K., Bothun, G. D., & Impey, C. D. 2000, ApJS, 128, 99
- (48) Pérez, I. 2004, A&A, 427, L17
- (49) Pfenniger, D. & Friedli, D. 1991, A&A, 252, 75
- (50) Pohlen, M., Dettmar, R.-J., Lŭtticke, R., & Aronica, G. 2002, A&A, 392, 807
- (51) Portegies Zwart, S. F., & McMillan, S. L. W. 2002, ApJ, 576, 899
- (52) Portegies Zwart, S. F., Baumgardt, H., Hut, P., Makino, J., & McMillan, S. L. W. 2004, Nature, 428, 6984
- (53) Portegies Zwart, S. F., Baumgardt, H., McMillan, S. L. W., Makino, J., Hut, P., & Ebisuzaki, T. 2006, ApJ, 641, 319
- (54) Reshetnikov, V. P., Dettmar, R.-J., & Combes, F. 2003, A&A, 399, 879
- (55) Robertson, B., Yoshida, N., Springel, V., & Hernquist, L. 2004, ApJ, 606, 32
- (56) Robin, A.C., Reylé, C., Derrière, S., & Picaud, S. 2003, A&A, 409, 52
- (57) Smith, A. M., et al. 2001, ApJ, 546, 829
- (58) Taniguchi, Y., & Shioya, Y. 2001, ApJ, 547, 146
- (59) Toomre, A. 1964, ApJ, 139, 1217
- (60) Trujillo, I., & Pohlen, M. 2005, ApJL, 630, 17
- (61) van den Bergh, S., Abraham, R.G., Ellis, R.S., Tanvir, N.R., Santiago, B.X., & Glazebrook, K.G. 1996, AJ 112, 359
- (62) Weiner, B.J., et al. 2006, ApJ, 653, 1027
- (63) Yoachim, P., & Dalcanton, J. J. 2006, AJ, 131, 226
| Run | |||||||||||||||
|---|---|---|---|---|---|---|---|---|---|---|---|---|---|---|---|
| 0 | 9 | 50% | 0.50 | 0.38 | 0.56 | 0.53 | 0.67 | 0.26 | 0.30 | 2.1 | 1.6 | 2.9 | |||
| 1 | 5 | 50% | 0.50 | 0.32 | 0.60 | 0.48 | 0.74 | 0.22 | 0.21 | 2.9 | 1.7 | 2.7 | |||
| 2 | 15 | 50% | 0.50 | 0.31 | 0.52 | 0.40 | 0.66 | 0.25 | 0.19 | 2.3 | 1.4 | 2.2 | |||
| 3 | 20 | 50% | 0.50 | 0.39 | 0.47 | 0.62 | 0.74 | 0.23 | 0.33 | 2.0 | 1.6 | 2.4 | |||
| 4 | 9 | 25% | 0.50 | 0.26 | 0.32 | 0.36 | 0.67 | 0.20 | 0.14 | 2.4 | 1.1 | 3.0 | |||
| 5 | 9 | 75% | 0.50 | 0.34 | 0.63 | 0.61 | 0.65 | 0.19 | 0.32 | 2.0 | (1.8) | 2.8 | |||
| 6 | 9 | 50% | 0.25 | 0.41 | 0.51 | 0.62 | 0.71 | 0.25 | 0.36 | 2.3 | (2.0) | 2.4 | |||
| 7 | 9 | 50% | 0.80 | 0.23 | 0.57 | 0.35 | 0.67 | 0.17 | 0.12 | 2.2 | 1.2 | 3.1 | |||
| SP-0 | 9 | 50% | 0.50 | 0.36 | 0.55 | 0.51 | 0.68 | 0.24 | 0.27 | 2.2 | 1.4 | 3.0 |