The influence of device geometry
on many-body effects in quantum point contacts:
Signatures of the 0.7 anomaly, exchange and Kondo
Abstract
The conductance of a quantum point contact (QPC) shows several features that result from many-body electron interactions. The spin degeneracy in zero magnetic field appears to be spontaneously lifted due to the so-called 0.7 anomaly. Further, the g-factor for electrons in the QPC is enhanced, and a zero-bias peak in the conductance points to similarities with transport through a Kondo impurity. We report here how these many-body effects depend on QPC geometry. We find a clear relation between the enhanced g-factor and the subband spacing in our QPCs, and can relate this to the device geometry with electrostatic modeling of the QPC potential. We also measured the zero-field energy splitting related to the 0.7 anomaly, and studied how it evolves into a splitting that is the sum of the Zeeman effect and a field-independent exchange contribution when applying a magnetic field. While this exchange contribution shows sample-to-sample fluctuations and no clear dependence on QPC geometry, it is for all QPCs correlated with the zero-field splitting of the 0.7 anomaly. This provides evidence that the splitting of the 0.7 anomaly is dominated by this field-independent exchange splitting. Signatures of the Kondo effect also show no regular dependence on QPC geometry, but are possibly correlated with splitting of the 0.7 anomaly.
I Introduction
A quantum point contact (QPC) is a short channel that carries ballistic one-dimensional electron transport between two reservoirs. Its conductance as a function of channel width is quantized vanWees1988 ; Wharam1988 and shows plateaus at integer multiples of , where is the electron charge and Planck’s constant. This quantization of the conductance can be understood with a noninteracting electron picture. However, there are several features in the conductance that result from many-body interaction effects between electrons. The effective electron g-factor is enhanced and almost all semiconductor QPCs show an additional plateau at , the so-called 0.7 anomaly. Further, electron transport through QPCs tuned to conditions where the 0.7 anomaly appears has similarities with transport through a Kondo impurity. These many-body effects are not yet fully understood, and in particular understanding the 0.7 anomaly has been the topic of on-going research for more than a decade now Fitzgerald2002 ; Ennslin2006 . A consistent picture of these effects is of interest for spintronics and quantum information proposals where QPCs are a key element, and QPCs are now also a key model system for studies of many-body physics in nanodevices.
Several models have been proposed that relate the 0.7 anomaly to a spontaneous spin splitting in zero magnetic field Thomas1996 ; Thomas1998 ; Kristensen2000 ; Meir2002 ; Starikov2003 ; Reilly2005 ; DiCarlo2006 , since the 0.7 plateau evolves continuously into the spin-resolved plateau at 0.5 (2e2/h) when an in-plane magnetic field is applied. A recent theory paper Rejec2006 presented spin-density functional calculations of realistic QPC geometries that show that a localized state can exist near pinch-off in a QPC, providing a theoretical background for the Kondo-like physics that was found experimentally Cronenwett2002 . Other studies have proposed electron-phonon scattering Matveev2003 , Wigner crystal formation Matveev2004 , or a dynamical Coulomb blockade effect Bulka2007 as the microscopic origin of the 0.7 anomaly. Graham et al. reported evidence that many-body effects also play a role in magnetic fields at crossings between Zeeman levels of different subbands Graham2003 , and at crossings of spin-split subbands with reservoir levels Graham2005 .
We report here how these many-body effects in QPCs depend on the QPC geometry. We study the energy spacing between the one-dimensional subbands and spin-splittings within one-dimensional subbands, both in zero field and high magnetic fields. While this type of data from individual devices has been reported before Thomas1998 ; Cronenwett2001 , we report here data from a set of 12 QPCs with identical material parameters. Our measurements show a clear correlation between the subband spacing and the enhancement of the effective g-factor . Both also depend in a regular manner on the geometry of the QPC, and we can understand this behavior using electrostatic modeling of the QPC potential.
The appearance of the 0.7 anomaly and signatures of the Kondo effect do not show a regular dependence on QPC geometry. Intriguingly, however, we find that in high magnetic fields there is a field-independent exchange contribution to the spin-splitting for the lowest one-dimensional subband in addition to the regular Zeeman splitting, and this exchange contribution is clearly correlated with the zero-field splitting of the 0.7 anomaly. However we do not claim that this zero-field splitting leads to a static ferromagnetic polarization. This new observation provides evidence that the splitting of the 0.7 anomaly is dominated by this field-independent exchange splitting. The Kondo effect appears as a zero-bias peak in the differential conductance , and the width of this peak is set by the Kondo temperature , an energy scale that represents the strength of the Kondo effect. Our measurements of suggest a correlation between and the splitting of the 0.7 anomaly.
This paper is organized as follows. Section II presents information about sample fabrication and measurement techniques. In section III we present measurements of the conductance of our set of QPCs, and we extract the energy splittings between subbands and spin splittings. In section IV we focus on analyzing the signatures of many-body effects in our QPC data, before ending with concluding remarks in the last section.
II Experimental realization
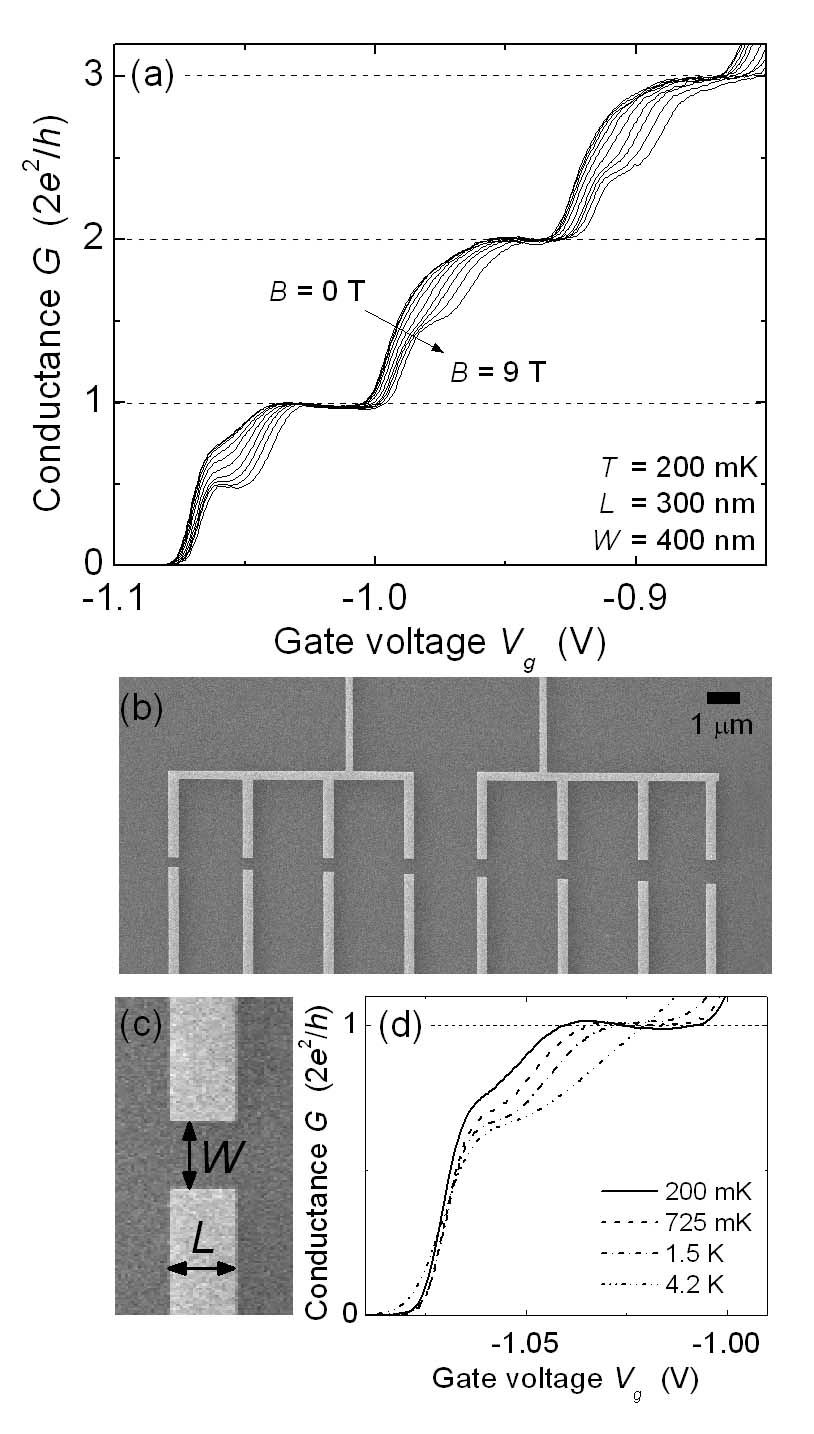
Our devices were fabricated using a heterostructure with a 2DEG at 114 nm below the surface from modulation doping with Si. The buffer layer had a thickness of 36.8 nm, and Si doping was about . At 4.2 K, the mobility of the 2DEG was , and the electron density . A QPC is formed by applying a negative gate voltage to a pair of electrodes on the wafer surface. The 2DEG below the electrodes is then fully depleted, and tuning of allows for controlling the width of a short one-dimensional transport channel. Our QPCs had different values for the length and width for the electrode spacing that defines the device (see Table 1, and Figs. 1b,c). Note that should not be confused with the actual width of the transport channel that is controlled with . The depletion gates were defined with standard electron-beam lithography and lift-off techniques, using deposition of 15 nm of Au with a Ti sticking layer. The reservoirs were connected to macroscopic leads via Ohmic contacts, which were realized by annealing a thin Au/Ge/Ni layer that was deposited on the surface.
All QPCs were fabricated in close proximity of each other on a single central part of the wafer to ensure the same heterostructure properties for all QPCs. The set of 8 QPCs for which we varied (Device 1 in Table 1) had all QPCs within a range of about . The set of 8 QPCs for which we varied (Device 2 in Table 1 and Fig. 1b) had an identical layout, and was positioned at 2 mm from Device 1. Thus, all semiconductor processing steps (resist spinning, e-beam lithography, metal deposition, etc.) could be kept nominally identical for all 16 QPCs. Electron-microscope inspection of the measured devices (after the measurements) confirmed that the dimensions of all gate electrodes were within 10 nm of the designed values (see table 1. In our data this appears as a very regular dependence of QPC properties (see for example the discussion of the pinch-off voltage and subband spacing in the next section) on and for QPCs within the sets of Device 1 and 2. At the same time, two devices from two different sets with nominally identical values of and (labeled (1) and (2) in Figs. 3 and 4) show slightly different QPC properties (in particular for the subband spacing ). This is not fully understood.
| Device 1 | ||||||||
|---|---|---|---|---|---|---|---|---|
| (nm) | 100 | 150 | 200 | 250 | 300 | 350 | 400 | 450 |
| (nm) | 350 | 350 | 350 | 350 | 350 | 350 | 350 | 350 |
| Device 2 | ||||||||
| (nm) | 300 | 300 | 300 | 300 | 300 | 300 | 300 | 300 |
| (nm) | 200 | 250 | 300 | 350 | 400 | 450 | 500 | 550 |
Measurements were performed in a dilution refrigerator with the sample at temperatures from to 4.2 K. For all our data the temperature dependence saturated when cooling below mK. We therefore assume for this report that this is the lowest effective electron temperature that could be achieved. For measuring the differential conductance we used standard lock-in techniques at 380 Hz, with an ac voltage bias . Only the contact was connected to the grounded shielding of our setup, and all gate voltages were applied with respect to this ground. The in-plane magnetic field was applied perpendicular to the current direction, and the current in the QPCs was along the crystal orientation. Alignment of the sample with the magnetic field was within 1∘, as determined from Hall voltage measurements on the 2DEG. We have data from 12 different QPCs from the set of 16 that we cooled down. From these QPCs 4 could not be measured. For two this was due to the presence of strong telegraph noise in conductance signals. Two other QPCs did not show clear conductance plateaus.
For analyzing QPC conductance values we subtracted a magnetic field and temperature dependent series resistance (from the wiring and filters, Ohmic contacts and 2DEG) from the transport data that was obtained with a voltage-bias approach. The criterium here was to make the observed conductance plateaus coincide with integer multiples of or .
III Spin splitting and energy splitting between QPC subbands
III.1 QPC conductance and energy splittings
Figure 1a presents the differential conductance of a QPC as a function of , with the source-drain voltage . Increasing from pinch-off () lowers and widens the saddle-point-like potential that defines the short transport channel. Consequently, an increasing number of one-dimensional subbands gets energies below the Fermi level. In zero magnetic field, this results in a step of in the conductance each time an additional subband starts to contribute to transport. We label these spin-degenerate subbands with a number , starting with for the lowest subband. With a high in-plane magnetic field the spin degeneracy within each subband is lifted, and the conductance increases now in steps of .
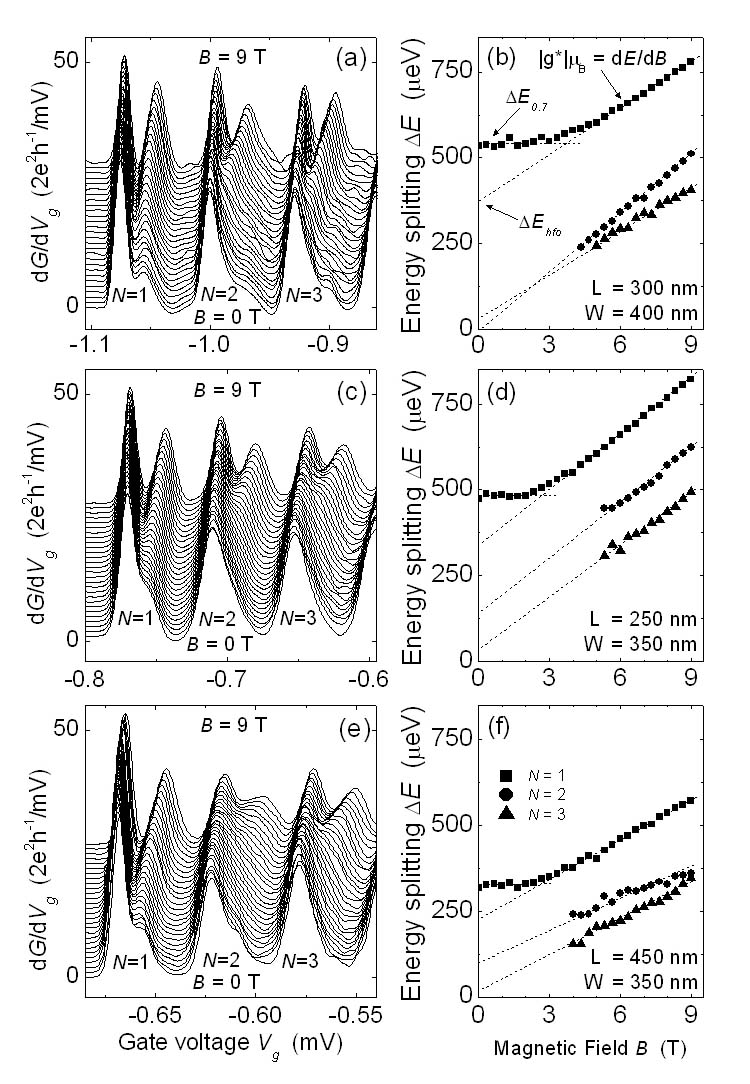
We use this type of data to determine the energy splitting between spin-up and spin-down levels within the subbands , and the spacing between the and subband (a measure for the degree of transverse confinement in the channel). The onset of transport through a next (spin-polarized) subband appears as a peak in transconductance () traces as in Figs. 2a,c,e, which we derive from traces as in Fig. 1a. We assume that each subband contributes in a parallel manner to the QPC conductance, and the transconductance curves can then be analyzed as a superposition of peaks, with one (two) peak(s) per (spin-split) subband. We then determine the peak spacings along the axis by fitting one or two peaks per subband on the transconductance traces (using least squares fitting with a Gaussian peak shape). The specific shape of a step between the quantized conductance plateaus depends on the shape of the saddle-point-like potential that defines the QPC Buttiker1990 , and can result in asymmetric transconductance peaks. We checked that this is not a significant effect for our analysis.
Subsequently, transconductance data (not shown) from nonlinear transport measurements is used for converting values into energy splittings Patel1991 . Here, the onsets of conductance plateaus appear as diamond shaped patterns in the plane. The width of these diamonds along the axis defines the subband spacing, and we use this to determine the spacing between the and subband. The slopes of the diamonds can be used to convert a gate-voltage scale into energy scale Patel1991 . In this analysis of and conversion of into spin splittings we observed a weak dependence on magnetic field and temperature, and took this in account.
The 0.7 anomaly is clearly visible in the data set presented in Fig. 1. The conductance trace for zero field in Fig. 1a shows besides pronounced steps of an additional shoulder at , which becomes more pronounced at higher temperatures (Fig. 1d). With increasing magnetic field, the 0.7 anomaly evolves into the first spin-resolved conductance plateau at . In Figs. 2a,c,e the 0.7 anomaly appears as a zero-field splitting in the transconductance peak for , which evolves into two spin-split peaks in high fields. In earlier work this observation was the basis for assuming that the 0.7 anomaly results from a spontaneous removal of spin degeneracy in zero field Thomas1996 ; Thomas1998 . For our analysis here we assume that the 0.7 anomaly is indeed related to such a spontaneous spin splitting for the first subband. In high fields, all 12 QPCs showed also for and higher a pronounced spin splitting into two transconductance peaks, but these subbands did not clearly show a zero-field splitting. We emphasize again that we do not claim there is a static ferromagnetic polarization due to this splitting.
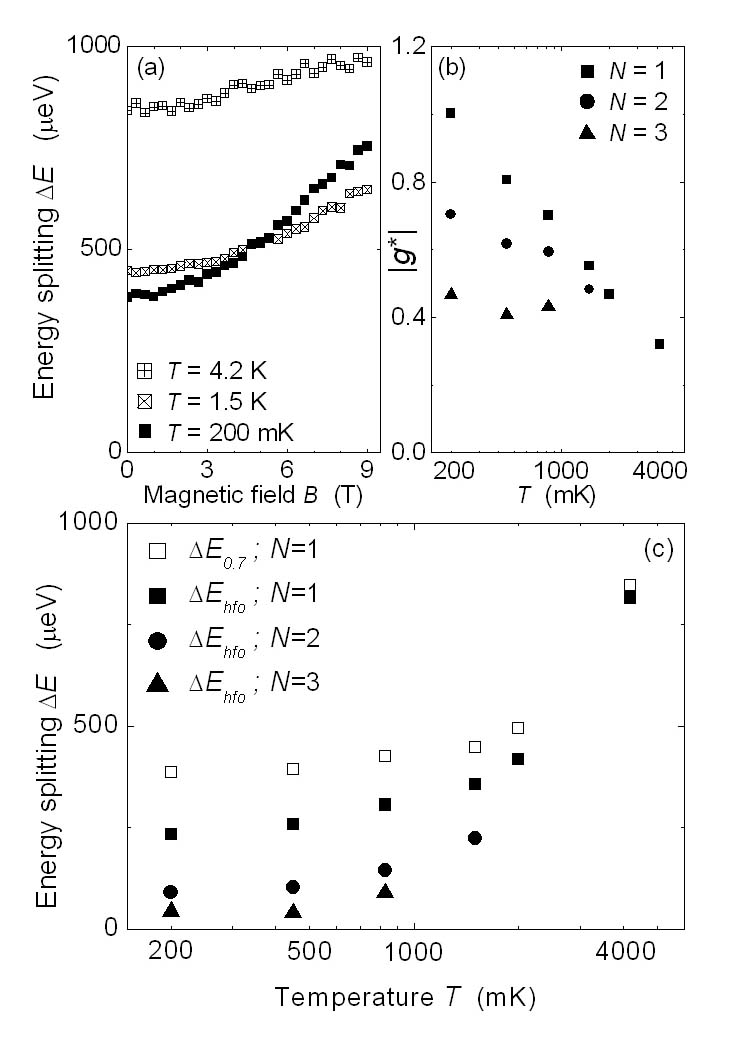
We studied how the spin splittings for increase with magnetic field from up to 9 T (Fig. 2b,d,f). We first concentrate on data for . At zero field shows the splitting associated with the 0.7 anomaly, that we label . It is observed in all our QPCs with a typical value of 0.5 meV. At high fields has a linear slope similar to the Zeeman effect. However, linear extrapolation of this slope down to shows that there is a large positive offset (unlike the usual Zeeman effect). We characterize the slope with an effective g-factor (note that one should be careful to interpret as an absolute indication for the g-factor of electrons in a QPC, since different methods for extracting a g-factor can give different results Cronenwett2002 ; Cronenwett2001 ). The high-field offset from a linear Zeeman effect is characterized with a parameter . Qualitatively, this type of data for looks similar for all 12 QPCs (Figs. 2b,d,f), and we use a suitable fitting procedure to characterize the traces for with the parameters , and . Notably, two-parameter fitting using spin- energy eigenvalues with does not yield good fits. For the traces as in Fig. 2b,d,f for , we cannot resolve a spin splitting at low fields, only the parameters and can be derived. Further analysis of these results for , and is presented in Section IV on many-body effects.
III.2 Electrostatics and subband splitting
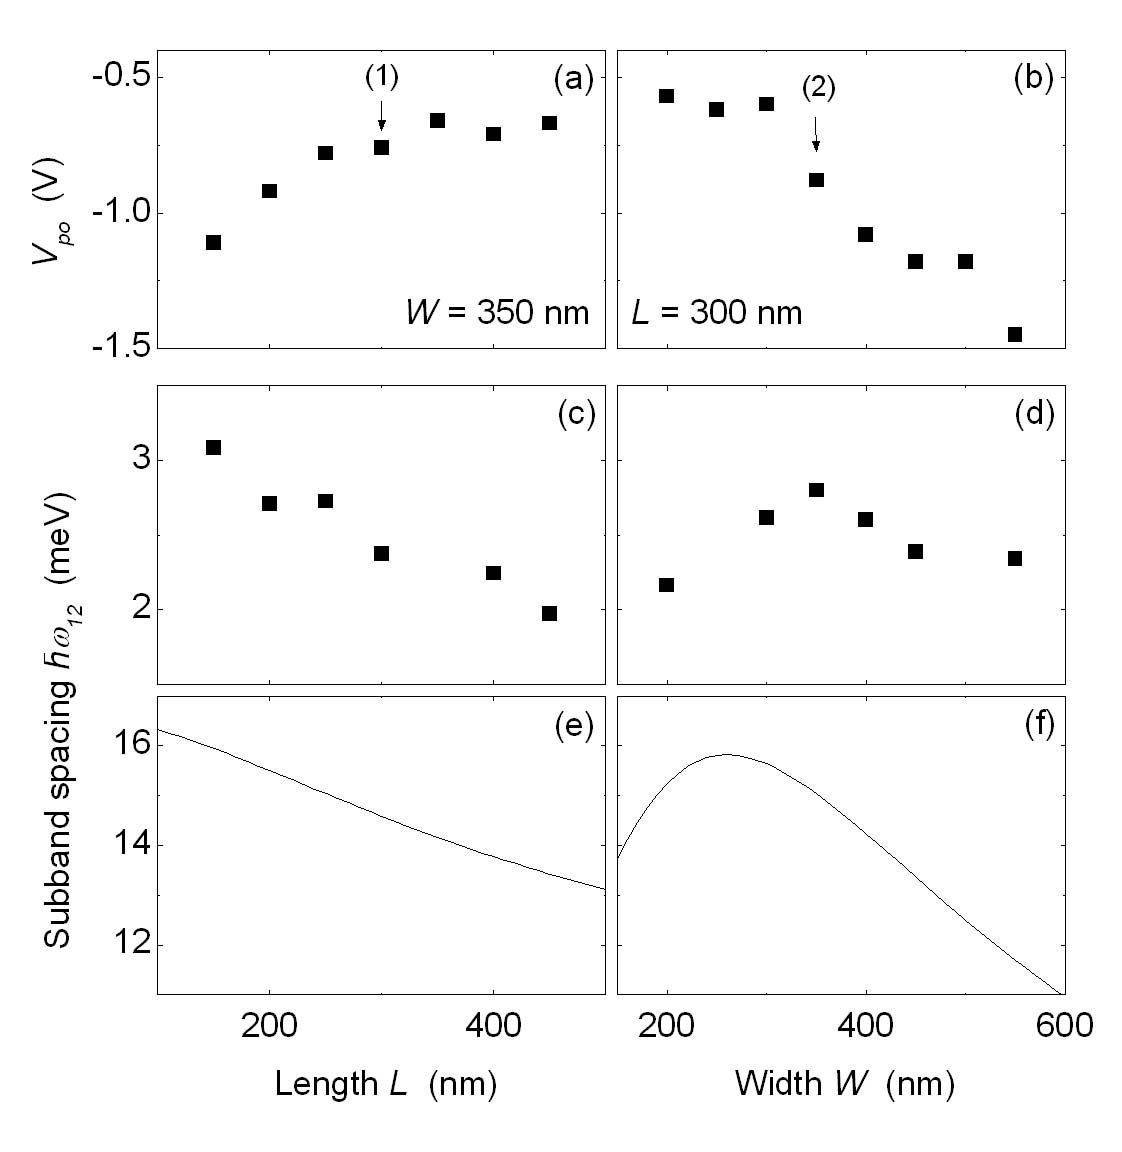
Figures 3a,b present how the pinch-off voltage (the value of where the starts to increase from zero) depends on QPC geometry. Figs. 3c,d presents this for the subband spacing , which provides a parameter for the strength of the transverse confinement in the QPC and is possibly of importance for several of the many-body effects in QPCs. The observed dependence of on the QPC geometry (a more negative for shorter and wider QPCs) agrees with the expected trend. This provides the first of several indications that part of the physics of our set of QPCs depends in a regular manner on and .
Furthermore, the variation of is in good agreement with an electrostatic analysis Davies1995 of the degree of transverse confinement in the saddle-point-like potential of the QPC (presented in Figs. 3e,f). In summary, short and narrow QPCs yield the strongest transverse confinement (Figs. 3d-f). This is valid down to the point where the QPC width (where the depth of the 2DEG below the wafer surface), which results in the maximum for in Figs. 3d,f.
For this analysis, we calculate the confining electrostatic potential due to the depletion gates in the plane of the 2DEG. An important ingredient of the calculation is the threshold voltage , which is the (negative) voltage that must be applied to a gate to reduce the electron density underneath it to zero,
| (1) |
where is the 2DEG electron density (without gates) and the depth of the 2DEG below the surface. We use the dielectric constant for GaAs .
The subband spacing can be calculated from the transverse curvature of the saddle-point-like potential. However, this curvature changes with the applied gate voltage. Therefore, we calculate the curvature for all QPCs when the QPC is just pinched-off (), when the potential in the middle of the transport channel is equal to . For these calculations we used the dimensions , and of the measured devices. Qualitatively the trends in as a function of and are reproduced, but the calculated values for are significantly larger than the experimentally obtained values. From earlier work Davies1995 it is known that it is hard to get quantitative agreement from this type of calculations. Furthermore, the maximum in versus is found for a smaller value for than we have observed experimentally, approximately when .
The origin of differences between our simple calculations and experimental results is well understood. The treatment of the exposed surfaces between the depletion gates is an important aspect of the calculations. A different choice for the boundary condition of the exposed surface may result in a noticeable difference in the confining potential Davies1995 ; Chen1993 . We used a so-called pinned-surface approach (because it is a simple analytical approach) where the Fermi level at the surface becomes pinned to the Fermi level in the 2DEG. However, a pinned surface requires charge to move from the 2DEG to the surface when the gate voltage is changed, in order to keep the surface potential constant. This process is strongly suppressed at low temperatures. Alternatively, the surface can be treated as a dielectric boundary, with a fixed charge density (frozen surface approach). Davies et al. Davies1995 have compared the results for pinned and frozen surfaces and found that the maximum in shifts from to when a frozen surface is assumed instead of a pinned surface. This corresponds very well to the experimentally observed value of 350 nm. Furthermore, the model used here is based on the calculation of the electrostatic potential due to the gates alone. Other effects, as the contribution to the potential from donor ions and other electrons in the 2DEG are ignored. Self-consistent calculations Laux1988 have shown that the values of decrease rapidly when electrons enter the conduction channel.
IV Many-body effects
IV.1 Enhancement of the effective g-factor
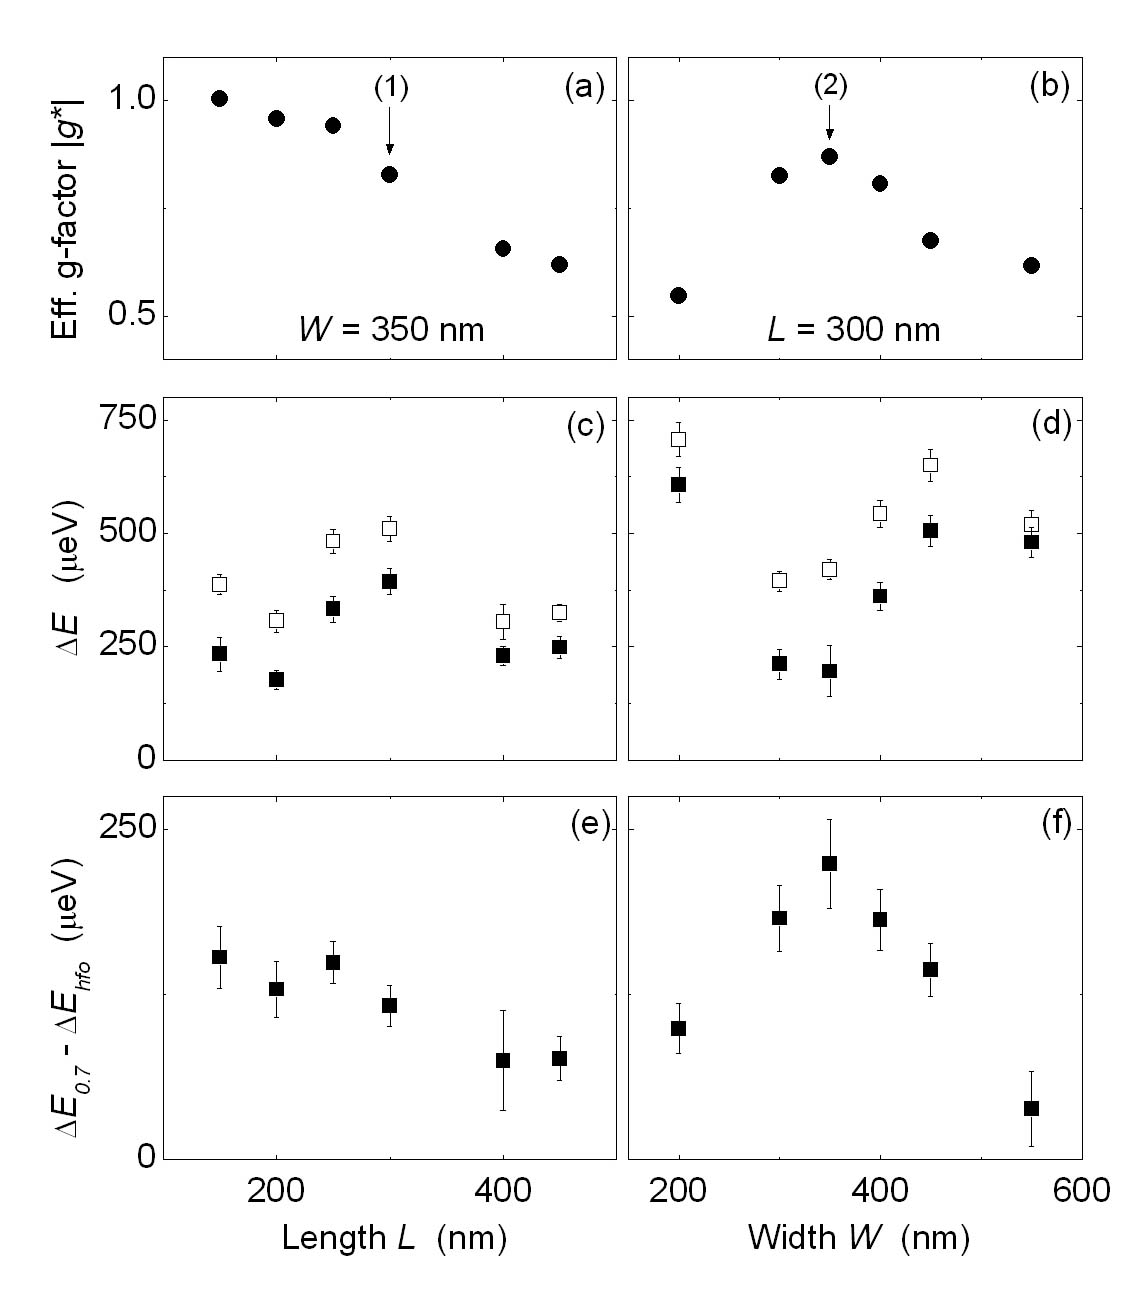
Figures 4a,b present how the effective g-factor for varies with and of the QPCs. It is strongly enhanced up to a factor with respect to the g-factor for bulk 2DEG material Hannak1995 (the temperature dependence of this data is shortly discussed in section IV.2). This has been observed before Thomas1998 and is attributed to many-body effects. Notably, the values of and in Figs. 3c,d are clearly correlated.
The enhancement of the effective g-factor has been explained in terms of exchange interactions (see Pallecchi2002 and references therein). Calculations of the exchange potential in a square (quantum well) confining potential have shown that the effective g-factor decreases when the 1D confining potential weakens and the 2D limit is approached Majumdar1998 . For a harmonic confining potential, the results of this study predict that scales indeed with . We observed this here for the lowest subband () in dependence on QPC geometry. Earlier work Thomas1998 observed the same trend in a single QPC, using that the transverse confinement decreases with increasing subband index .
IV.2 The 0.7 anomaly and exchange
Figures 2b,d,f show that for all QPCs appears in high fields as the sum of the Zeeman effect and the constant contribution . This suggest that the splittings in high field have, in particular for , a significant contribution from a field-independent exchange effect that results from each subband being in a ferromagnetic spin-polarized state. In high fields such an interpretation is less ambiguous than for zero field (where the possibility of a ferromagnetic ground state for spin-polarized subbands is the topic of debate Klironomos2006 ; Jaksch2006 ) since the Zeeman effect suppresses spin fluctuations. Thus, measuring can be used to determine this exchange splitting.
We now further analyze how this parameter and depend on and . The open squares in Figs. 4c,d present this for . Overall, the dependence here is not very regular, possibly indicating that the exact appearance of the otherwise robust 0.7 anomaly is sensitive to small irregularities in the potential that defines the QPC (only the data in Fig. 4d suggests an anti-correlation with ). The black squares present how for varies with and . Also here the dependence is irregular. Remarkably, however, the irregular variations of and are clearly correlated throughout our set of 12 QPCs. This means that , which is derived from data in zero field, is correlated with , which is derived from data taken at fields in excess of 5 T. Further evidence for the significance of this correlation comes from data from the and subband (see Figs. 2b,d,f). We analyzed the data for in the very same way as for , and the most important observation is that the parameter for is much smaller than for , and often close to zero. A high value is only observed for , just as the 0.7 anomaly itself. Notably, for , and also have a similar order of magnitude. This analysis points to the conclusion that the spontaneous energy splitting of the 0.7 anomaly is dominated by the same effect that causes the high-field offset . As we discussed, this is probably an exchange contribution Koop2007 . The error bar that we attribute to these values includes an error from the transconductance peak-fitting, one from the conversion of gate voltage to energy scale, and an error due to scatter in the datapoints as a function of .
Fig. 4e,f presents data for the difference between and . Here, shows again a correlation with . This indicates that the splitting of the 0.7 anomaly has (in addition to the exchange contribution that is also present in high fields) a contribution that scales with . At this stage we cannot relate this new observation to earlier experimental or theoretical work. Note that for the error bars in Figs. 4e,f we first subtracted the values of peak positions in terms of gate voltage, such that the error from gate voltage to energy scale conversion is accounted for only once.
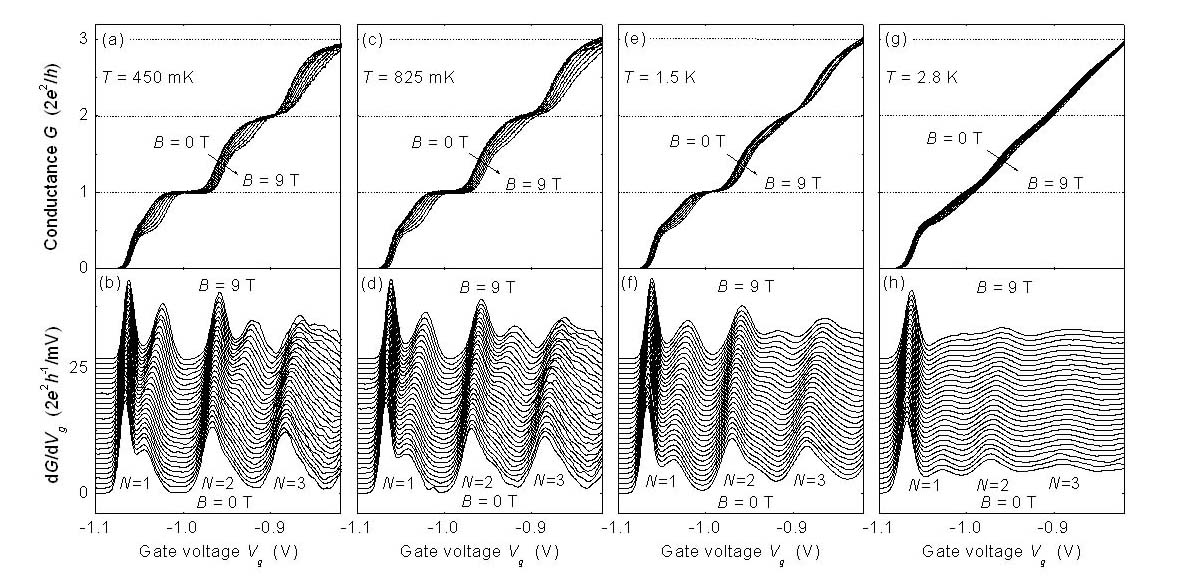
We will now discuss the effect of increasing the temperature on the many-body phenomena in our QPCs. Figs. 5a-d show the conductance at as a function of magnetic field for temperatures = 450 mK, 825 mK, 1.5 K and 2.8 K (see also Figs. 1a and 2a for the 200 mK data). As the temperature is increased the spin-degenerate plateaus and the spin-resolved plateaus both become less pronounced due to thermal smearing. In high magnetic fields the spin-resolved plateaus increase slightly in conductance with increasing temperature. At even higher temperatures the plateau at is the last remaining feature in the differential conductance. Notably, here the 0.7 anomaly appears to be present over the whole range of magnetic fields. The corresponding transconductance traces are plotted in Figs. 5e-h. As a result of the thermal smearing of the conductance plateaus, the peaks in become broader and decrease in height. The zero-field splitting in the transconductance peak for has been identified as the 0.7 anomaly. When the temperature is increased, the 0.7 anomaly becomes more pronounced as was shown in the temperature dependence of the differential conductance presented in Fig. 1d. Consequently the zero-field splitting in Figs. 5e-h also increases. For = 825 mK and 1.5 K (Figs. 5f,g) even a small zero-field splitting of the transconductance peak can be observed, suggesting the appearance of a plateau Thomas1998 .
Using the temperature dependence of data (Fig. 6a), we find that the correlation between and remains intact at higher temperatures (Fig. 6c). Figure 6b shows that has a very different temperature dependence. This indicates that the g-factor enhancement and the 0.7 anomaly arise from different many-body effects.
IV.3 Kondo signatures
The appearance of the 0.7 anomaly has been related to a peak in the differential conductance as a function of source-drain voltage around zero bias, for values around . Earlier work Cronenwett2002 showed that this zero-bias anomaly (ZBA), and its temperature and magnetic field dependence, have a very striking similarity with electron transport through a Kondo impurity that can studied with quantum dots GoldhaberGordon1998 ; Cronenwett1998 . For quantum dots, the Kondo effect is a many-body interaction of the localized electron(s) inside the dot with the delocalized electrons in the leads connected to the dot GoldhaberGordon1998 ; Kouwenhoven2001 ; Cronenwett1998 ; Cronenwett2002 . Together these electrons form a spin-singlet state, effectively screening the local spin on the dot. In contrast to a quantum dot, where there is a clear localized state, a QPC is an open system where the formation of a bound state is much less obvious. A recent theoretical result Rejec2006 has shown that a self-consistent many-body state can indeed form inside a QPC, and that this can result in Kondo-like physics.
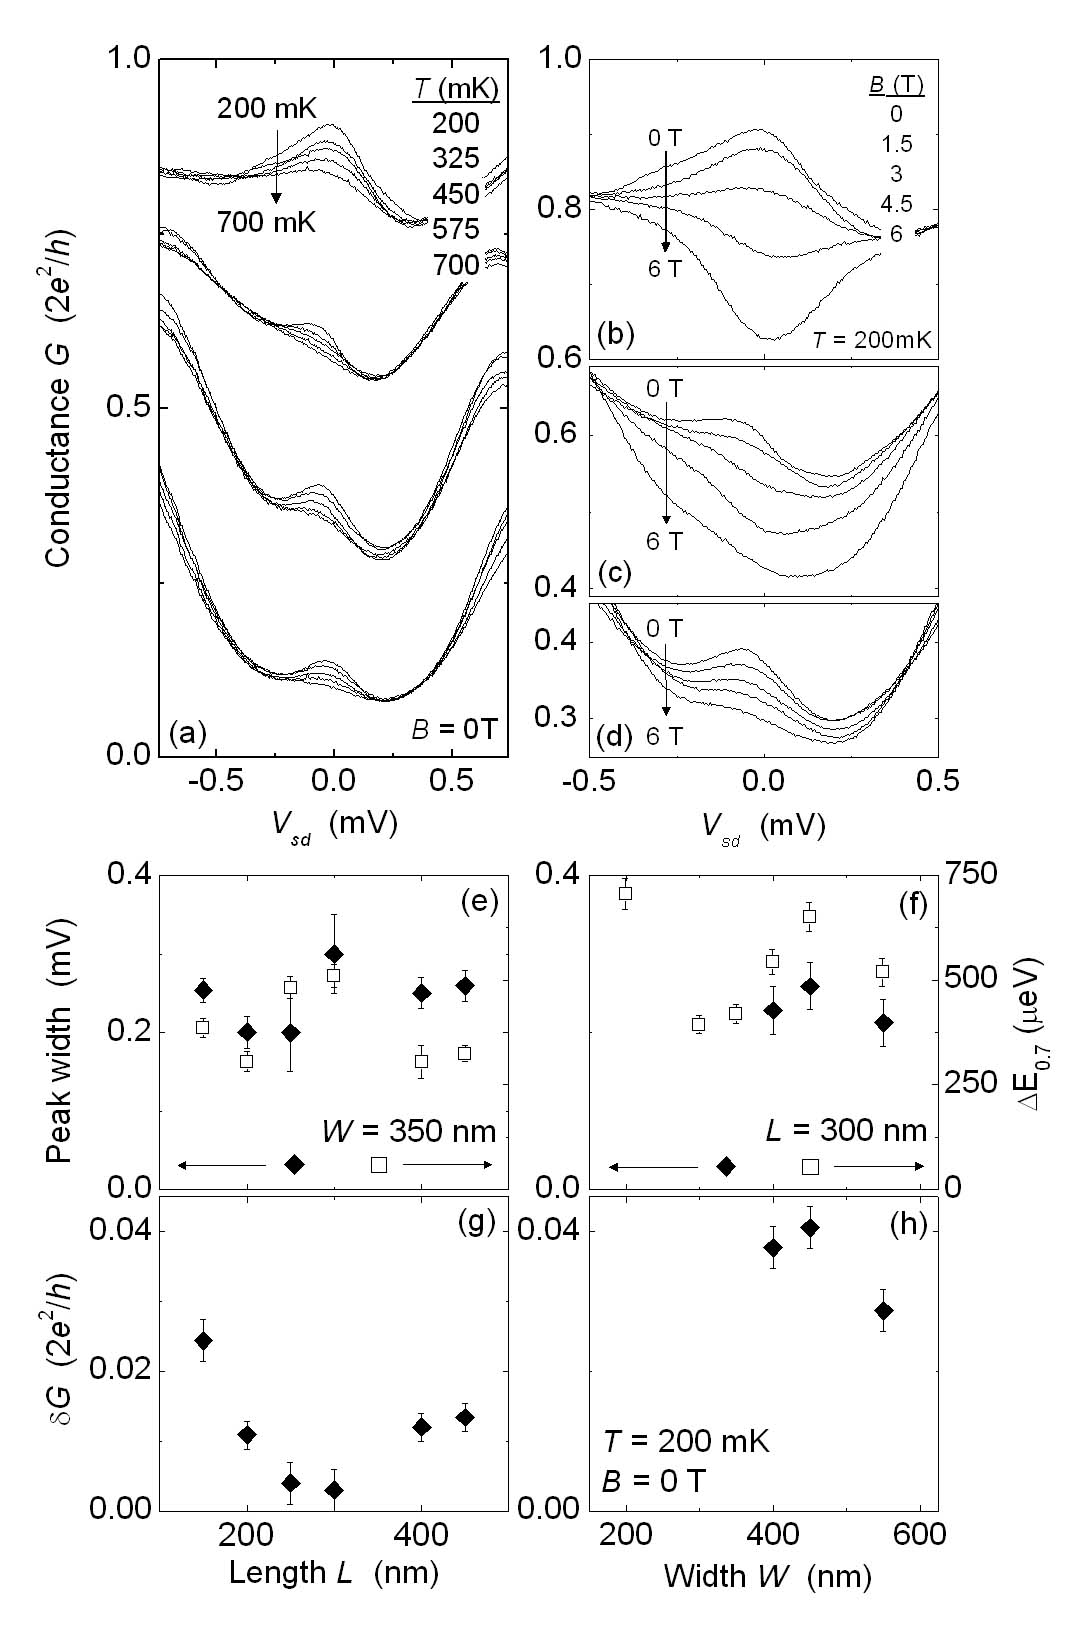
In this section we present the measurements of this ZBA in our set of QPCs. Most of our QPCs showed a clear ZBA in nonlinear conductance measurements. The temperature and magnetic field dependence of this data (Figs. 7a-d) is consistent with the earlier reports Cronenwett2002 that relate the 0.7 anomaly to transport through a Kondo impurity.
The relevant energy scale for Kondo physics is the Kondo temperature . Below this temperature the magnetic impurity giving rise to Kondo physics is completely screened by the formation of a spin-singlet state and at zero-bias the differential conductance . The Kondo temperature determines the width of the zero-bias peak. We observe that the peak width and height of the ZBA are not constant over the whole range 0 G (see also Fig. 6-12 in reference Cronenwett2001 ). We choose to fit these parameters at 0.3, where the peak height has a relative maximum. The peak width and height are determined by fitting the nonlinear conductance traces with a Gaussian shaped peak added to a parabola.
Figures 7e,f show the peak width as a function of and (during our measurement run, one gate of Device 2 broke during an electronic malfunction, and we can only present data from 3 QPCs in the set with different values of ). The width of the ZBA does not show a clear dependence on and , and has a value of about 2 mV for all QPCs. For completeness, we also report the peak height in Figs. 7g,h as a function of and . We observe that for a single QPC varies with , but the the values in Figs. 7g,h do give for each QPC a good representation of the typical value of throughout the interval where the ZBA is observed. As a function of and , we observe here a stronger scatter in the values than for the peak width, but also here there is no clear relation with the QPC geometry. To conclude this section, we consider a correlation between the signatures of the Kondo effect and the values of (Figs. 7e,f). The irregular variation of the ZBA peak width with and suggests indeed a correlation with , but here the evidence is very weak given the size of the error bar that we attribute to these values.
V Discussion and conclusions
We have studied many-body interaction effects in quantum point contacts. Our main point of interest was the dependence of these many-body electron interactions on the geometry of the QPC. We found a clear relation between the subband spacing and the enhancement of the effective electron g-factor. These parameters depend on geometry in a regular manner that we can understand from electrostatic modeling of the QPC potential. The many-body electron physics that causes the spontaneous energy splitting of the 0.7 anomaly does not show a clear dependence on QPC geometry, but we do find a clear correlation with a field-independent exchange effect that contributes to spin splittings in high magnetic fields. This suggests that the splitting of the 0.7 anomaly is dominated by this exchange contribution. We also measured a zero-bias anomaly in the nonlinear conductance of our QPCs, that has been interpreted as a signature of the Kondo effect. Here, there is also no clear dependence on QPC geometry, but our data suggests that it is worthwhile to further study its correlation with the splitting of the 0.7 anomaly. These results are important for theory work that aims at developing a consistent picture of many-body effects in QPCs, and its consequences for transport of spin-polarized electrons and spin coherence in nanodevices. Our analysis of experimental data is very phenomenological, presenting parameters and correlations for which it is difficult to draw conclusions about the underlying physics. At the same time, part of state-of-the-art theory work now relies on numerical simulations of realistic QPC geometries (using spin-density-functional theory Rejec2006 ; Jaksch2006 or other numerical approaches Klironomos2006 ) from which it is hard to derive analytical expression for the underlying physics. However, the validity of this numerical modeling can be easily tested for its consistency with the parameters and correlations that we reported here.
Acknowledgements
We thank B. H. J. Wolfs, R. N. Schouten, S. F. Fischer, C. W. J. Beenakker and L. S. Levitov for help and useful discussions, and the Dutch Foundation for Fundamental Research on Matter (FOM), the Netherlands Organization for Scientific Research (NWO), and the German BMBF (in the framework of the nanoQUIT-program) for financial support.
References
- (1) B. J. van Wees, H. van Houten, C.W.J. Beenakker, J.G. Williamson, L.P. Kouwenhoven, D. van der Marel, and C.T. Foxon, Phys. Rev. Lett. 60, 848 (1988).
- (2) D. A. Wharam, M. Pepper, H. Ahmed, J.E.F. Frost, D.G. Hasko, D.C. Peacock, D.A. Ritchie, and G.A.C. Jones, J. Phys. C 21, L209 (1988).
- (3) R. Fitzgerald, Phys. Today 55, 21 (May 2002).
- (4) K. Ensslin, Nat. Phys. 2, 587 (2006).
- (5) K. J. Thomas, J.T. Nicholls, M.Y. Simmons, M. Pepper, D.R. Mace, and D.A. Ritchie, Phys. Rev. Lett. 77, 135 (1996).
- (6) K. J. Thomas, J.T. Nicholls, N.J. Appleyard, M.Y. Simmons, M. Pepper, D.R. Mace, W.R. Tribe, and D.A. Ritchie, Phys. Rev. B 58, 4846 (1998).
- (7) A. Kristensen, H. Bruus, A. E. Hansen, J. B. Jensen, P. E. Lindelof, C. J. Marckmann, J. Nygård, C. B. Sørensen, F. Beuscher, A. Forchel, and M. Michel, Phys. Rev. B 62, 10950 (2000).
- (8) Y. Meir, K. Hirose, and N. S. Wingreen, Phys. Rev. Lett. 89, 196802 (2002).
- (9) A. A. Starikov, I. I. Yakimenko, and K.-F. Berggren, Phys. Rev. B 67, 235319 (2003).
- (10) D. J. Reilly, Phys. Rev. B 72, 033309 (2005).
- (11) L. DiCarlo, Y. Zhang, D. T. McClure, D. J. Reilly, C. M. Marcus, L. N. Pfeiffer, and K. W. West, Phys. Rev. Lett. 97, 036810 (2006).
- (12) T. Rejec and Y. Meir, Nature 442, 900 (2006).
- (13) S. M. Cronenwett, H. J. Lynch, D. Goldhaber-Gordon, L. P. Kouwenhoven, C. M. Marcus, K. Hirose, N. S. Wingreen, and V. Umansky, Phys. Rev. Lett. 88, 226805 (2002).
- (14) G. Seelig and K. A. Matveev, Phys. Rev. Lett. 90, 176804 (2003).
- (15) K.A. Matveev, Phys. Rev. Lett. 92, 106801 (2004).
- (16) B. R. Bulka, T. Kostyrko, M. Tolea and I. V. Dinu, J. Phys.: Condens. Matter 19, 255211 (2007).
- (17) A. C. Graham, K. J. Thomas, M. Pepper, N. R. Cooper, M. Y. Simmons, and D. A. Ritchie, Phys. Rev. Lett. 91, 136404 (2003).
- (18) A. C. Graham, M. Pepper, M. Y. Simmons, and D. A. Ritchie, Phys. Rev. B 72, 193305 (2005).
- (19) S. M. Cronenwett, PhD thesis, Stanford University (2001).
- (20) M. Büttiker, Phys. Rev. B 41, 7906 (1990).
- (21) N. K. Patel, J. T. Nicholls, L. Martn-Moreno, M. Pepper, J. E. F. Frost, D. A. Ritchie, and G. A. C. Jones, Phys. Rev. B 44, 10973 (1991).
- (22) J. H. Davies and I. A. Larkin, J. Appl. Phys. 77, 4504 (1995).
- (23) M. Chen, W. Porod, and D.J. Kirkner, J. Appl. Phys. 75, 2545 (1993).
- (24) S.E. Laux, D.J. Frank, and F. Stern, Surf. Sci. 196, 101 (1988).
- (25) R. M. Hannak, M. Oestreich, A. P. Heberle, W. W. Rühle, and K. Köhler, Solid State Commun. 93, 319 (1995).
- (26) I. Pallecchi, Ch. Heyn, J. Lohse, B. Kramer, and W. Hansen, Phys. Rev. B 65, 125303 (2002).
- (27) A. Majumdar, J. Appl. Phys. 83, 297 (1998).
- (28) A. D. Klironomos, J. S. Meyer and K. A. Matveev, Europhys. Lett. 74, 679 (2006).
- (29) P. Jaksch, I. Yakimenko, and K.-F. Berggren, Phys. Rev. B 742, 235320 (2006).
- (30) E. J. Koop, A. I. Lerescu, J. Liu, B. J. van Wees, D. Reuter, A. D. Wieck and C. H. van der Wal, arXiv:0706.0792v1 [cond-mat.mes-hall] (2007).
- (31) D. Goldhaber-Gordon, H. Shtrikman, D. Mahalu, D. Abusch-Magder, U. Meirav and M. A. Kastner, Nature 391, 156 (1998).
- (32) S.M. Cronenwett, T.H. Oosterkamp, and L.P. Kouwenhoven , Science 281, 540 (1998).
- (33) L.P. Kouwenhoven and L.I. Glazman, Physics World 14, 33 (2001).