Searching for Stable Na-ordered Phases in Single Crystal Samples of -NaxCoO2
Abstract
We report on the preparation and characterization of single crystal phase NaxCoO2 with using a non-aqueous electrochemical chronoamperemetry technique. By carefully mapping the overpotential versus (for ), we find six distinct stable phases with Na levels corresponding to 0.75, 0.71, 0.50, 0.43, 0.33 and 0.25. The composition with appears to have a critical Na concentration which separates samples with different magnetic behavior as well as different Na ion diffusion mechanisms. Chemical analysis of an aged crystal reveals different Na ion diffusion mechanisms above and below , where the diffusion process above has a diffusion coefficient about five times larger than that below . The series of crystals were studied with X-ray diffraction, susceptibility, and transport measurements. The crystal with shows a weak ferromagnetic transition below K in addition to the usual transitions at and . The resistivity of the Curie-Weiss metallic Na0.71CoO2 composition has a very low residual resistivity, which attests to the high homogeneity of the crystals prepared by this improved electrochemical method. Our results on the various stable crystal compositions point to the importance of Na ion ordering across the phase diagram.
pacs:
61.10.Nz, 61.50.Nw, 66.30.-h, 75.20.Hr, 75.30.Cr, 71.27.+a
I Introduction
The lamellar cobaltates NaxCoO2 have attracted much attention since the discovery of superconductivity in the hydrated composition Na0.3CoO21.4H2O.Takada et al. (2003) The complete phase diagram of NaxCoO2 shows a variety of rich phenomena, such as A-type antiferromagnetic (AF) ordering for 0.75, large thermopower enhancement for , and AF ordering with a metal-to-insulator transition for .Bayrakci et al. (2005); Foo et al. (2004); Bobroff et al. (2006); Gasparovic et al. (2006); Lee et al. (2006) NaxCoO2 is composed of alternating layers of Na and CoO2, where the Na ions are surrounded by six oxygens which form a prismatic cage in the phase.Delmas et al. (1981) Sodium de-intercalation in powder samples has been effectively performed via chemical extraction, such as a topochemical process using a Br2/acetonitrile solution.Takada et al. (2003) We have demonstrated previously an electrochemical method as an alternative route to produce homogeneous compounds using a controlled overpotential (above the open circuit potential).Chou et al. (2005) Using an aqueous NaOH/H2O solution as the electrolyte, high quality single crystals were obtained, and measurements of their conducting, superconducting and magnetic properties have been reported.Balicas et al. (2005); Chou et al. (2004a) However, detailed studies of the voltage versus Na concentration diagram for have been hindered due to difficulties related to an oxygen evolution side-reaction in the aqueous solution.Chou et al. (2005)
Na ordering - in particular its impact on the geometry of the Fermi surface - is a key issue that requires further study in order to better understand the transport and magnetic properties.Balicas et al. (2005); Singh (2000); Bobroff et al. (2006); Lee et al. (2005); Zhou and Wang (2007) Local density approximation (LDA) calculations indicate that a band with a1g character should create a large hexagonal Fermi surface centered around the point.Singh (2000) The existence of such a large Fermi surface has been verified from angle-resolved photo-emission(ARPES).Yang et al. (2004); Hasan et al. (2004) However, subtle effects due to possible superstructure formation and/or strong electron correlation remain elusive, such as the missing small hole pockets predicted by LDA calculation. Bobroff et al. proposed a nesting scenario based on an orthorhombic reduced Brillouin zone caused by Na ordering to interpret the antiferromagnetic and metal-to-insulator transitions found in Na0.5CoO2.Bobroff et al. (2006) A reconstructed Fermi surface may also explain the small hole pocket found in Na0.5CoO2 and Na0.3CoO2 by Shubnikov-de Haas oscillation measurements.Balicas et al. (2005, 2006) Several superstructures have been observed and modeled from electron diffraction studies of NaxCoO2 with between 0.15 and 0.75.Zandbergen et al. (2004) Calculations based on electrostatic interaction between Na ions alone have been used to propose several types of Na ordering patterns.Zhang et al. (2005) Other calculations point to the importance of the coupling between Na-vacancy ordering and Co3+/Co4+ charge ordering, indicating that Na+–Na+ repulsion and the Na(1)–Na(2) site energy difference alone is not enough to describe the observed superlattices.Meng et al. (2005) A recent neutron diffraction study and associated numerical simulations have elucidated aspects of the Na ordering in single crystals of NaxCoO2 with x 0.75 - 0.92.Roger et al. (2007)
Much still remains to be understood regarding the possible Na ordering patterns across the phase diagram. Currently, Na ordering has been studied mostly in samples with and . However, reproducibly preparing precise stoichiometries of these phases is not straightforward. Many early studies of samples with did not pay much attention to the exact ordering of Na ions and often assumed substantial defect formation due to Na loss at high temperatures.Motohashi et al. (2001) Although Na0.5CoO2 shows the highest ordering and phase stability among the NaxCoO2 series, phase inhomogeneity and phase separation have been discussed based on electron microscopy studies of Na0.5CoO2.Zandbergen et al. (2004); Yang et al. (2005) A reliable procedure for controlling the Na content and the rate of de-intercalation of single crystal samples of NaxCoO2 is highly desirable, especially in light of the possibility of producing Na ordered phases.
We find that an electrochemical method which carefully controls the overpotential at the sample surface is a particularly reliable route that can approach the real equilibrium state and, moreover, is suitable for single crystal samples. The topochemical method is an effective method to produce powder samples as reported previously.Schaak et al. (2003) However, the Na level in powders is more susceptible to Na loss due to the much shorter diffusion path and significantly larger surface-to-bulk ratio. In fact, we find that over time, Na diffusion under normal storage conditions can affect surface layer stoichiometry as deep as 50 m as we discuss below. Here, we have used electrochemistry in a non-aqueous solution to carefully prepare a series of homogeneous single crystals. Characterization of these samples reveals that six distinctively stable phases fall in the stoichiometry of 0.75, 0.71, 0.50, 0.43, 0.33 and 0.25. Most phases are clearly near simple commensurate filling fractions, while 0.71 and 0.43 require further modeling and simulation. Magnetic susceptibility and transport measurements have been performed on these samples and the results are discussed.
II Experimental
All single crystals in this study were cleaved from a crystal grown using the floating-zone method as described previously.Chou et al. (2004a); Prabhakaran et al. (2004) In order to minimize any possible Na content differences between the surface and bulk, we performed all electrochemical experiments using thin crystals with thicknesses as small as 100 m. The electrochemical cell was assembled using crystal sample as working electrode, Pt as counter electrode, and Ag/AgCl with sieved liquid junction as reference electrode. In contrast to our previous work, a non-aqueous electrolyte was used: 1N NaClO4 in propylene carbonate. Single crystals of Na0.84CoO2 with size near 220.1 mm3 were sandwiched into a spring-loaded cell to make the working electrode. A DC voltage was applied between the working and reference electrodes at each applied voltage step, spanning the range from -0.25 V to 2.5 V relative to the Ag/AgCl reference. Equilibration is achieved by waiting until the induced anodic current reaches saturation and maintained for at least 12 hours. For chemical analysis of the stoichiometry, electron probe microanalysis (EPMA) was performed on freshly cleaved inner surfaces. To avoid electron-beam damage, EPMA data were collected using a low beam energy of 15 keV for 1 min duration on each fresh spot. Structural and bulk magnetic data were obtained from X-ray diffraction and SQUID magnetometry measurements, respectively. For the X-ray diffraction, single crystal samples were oriented, and the (00L) reflections at high angles were used to determine the c-axis. In-plane resistivity data of our various samples were obtained by performing four terminal DC measurements on single crystal samples. The crystals were cut to average size. The leads were attached with DuPont 4922N silver paint on a cleaved surface and dried in air, yielding contact resistances between .
III Results and Analysis
III.0.1 Sodium ion self diffusion
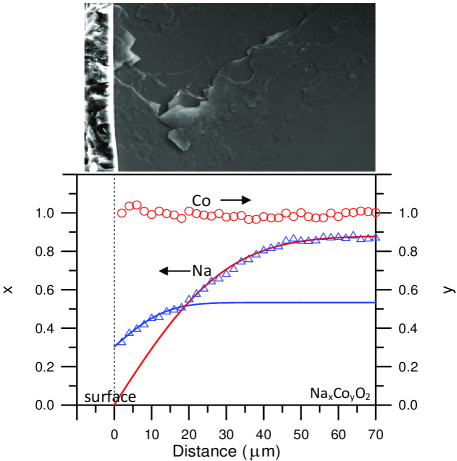
When the as-grown single crystal of NaxCoO2 with is not stored properly within a moisture-free environment, a white precipitate builds up on the surface. We believe the surface Na ions readily react with the water in the air to form white NaOH precipitate. The vacated sites would induce further Na ion self diffusion. In order to better understand the diffusion mechanism of Na ions, we have examined the Na distribution profile of an ”aged” single crystal of Na0.88CoO2 that has been stored in ambient environment of average humidity of 55% for about two and a half years. The original single crystal was prepared using floating-zone method as reported previously.Chou et al. (2004a) The ”aged” crystal rod had a layer of white precipitate built up on the surface of the boule. We performed EPMA to examine the Na/Co ion distribution on a cleaved surface (-plane) which extends radially from the core area to the edge of the rod as shown in Fig. 1(b). An SEM photograph is shown in Fig. 1(a), where the crystal surface is defined as the zero position. We find that the Na concentration rapidly drops from in the interior of the rod to at the surface layer within a depth of 50 m. The white layer outside the crystal consists of a rich concentration of Na (Na/Co 1.67) and has been confirmed with X-ray diffraction to be NaOH. The Na+ ions, with ionic radius Å, may diffuse through the rectangular pores of threshold radius Å formed by the oxygen ions of the NaO6 prismatic cage.Shin et al. (2002) Since Na+ ions diffuse along the -plane toward the surface boundary through a vacancy hopping mechanism, the observed Na distribution shown in Fig. 1 would follow Fick’s second law. The diffusion topography and the diffusion coefficient can be described by the diffusion equation in one dimension. Although it is tempting to fit the whole data set with a single diffusion coefficient, we note the profile has a pronounced crossover near . The best fit is obtained under the assumption of two different diffusion coefficients above and below the crossover point, as indicated by the solid lines in Fig. 1. Leaving the boundary conditions of at the crossover point and the surface edge as free fit parameters, the best fit values of are 3.49 and 0.76 for diffusion above and below the crossover point, respectively. We note that this is close to the lower limit of for LixCoO2 reported in the literature.Jang et al. (2001) The diffusion coefficients extrapolated from single crystals are less susceptible to errors due to geometric factors and electrolyte permeation, compared to powder samples.
Interestingly, the observed crossover point is , which is just above half filling. The end point at the surface boundary is near , right below 1/3 filling. The fit value of for is nearly five times of that from below. This indicates two distinctly different types of diffusion species dominated above and below half filling, which are most likely to be Na vacancy and Na+ ion, respectively. For NaxCoO2 with x 0.5, vacancy ordering is expected as demonstrated by the di-vacancy or tri-vacancy ordering patterns proposed by Roger et al.Roger et al. (2007) In the multi-vacancy model, energy is gained through Na(2) vacancy cluster formation plus promotion of additional sodium ions from the preferred Na(2) site to Na(1) site. The larger diffusion coefficient for vacancy-dominated diffusion is also reflected in the lower overpotential required in electrochemical de-intercalation process, as will be discussed below. The concentration near the surface boundary is very close to , which is exactly the Na concentration that becomes superconducting after fully hydrated.Takada et al. (2004) The energy gap between and appears to be large enough to prevent additional Na loss from the surface. The crossover point near also separates the two main classes of magnetic behavior within NaxCoO2, i.e. the Curie-Weiss metal above and Pauli paramagnetic metal below.Foo et al. (2004) The observed different diffusion mechanisms and thus different Na (vacancy) ordering patterns have shown profound influence on the magnetic and conducting properties of NaxCoO2.
III.0.2 Electrochemical de-intercalation
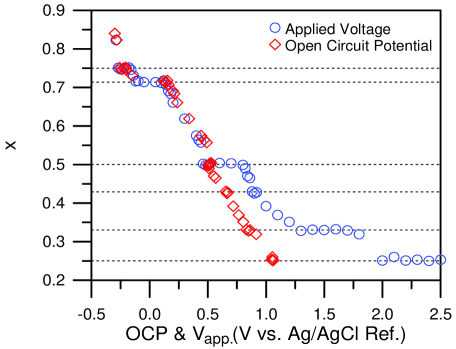
The electrochemical de-intercalation method relies on the sharp concentration gradient at the sample/electrolyte interface. Na ions diffuse to the surface layer due to the non-zero overpotential until a new equilibrated surface chemical potential is reached. A plot of of the Na concentration (determined using EPMA) versus the applied electrochemical voltage () is shown in Fig. 2 for our single crystal samples. As the applied voltage increases, the Na content decreases similar to previously reported results on powder samples.Chou et al. (2005); Delmas et al. (1981) The stability of the resulting phases is evidenced by the wide plateau near regions of = 0 at near 0.71, 0.5, 0.33 and 0.25.
Crystals prepared with applied voltages between 0.5 and 0.8 V show nearly constant Na content of . In addition, higher voltages near 1.3 – 1.6 V and 2.0 – 2.5 V produce samples with stable phases of close to 0.33 and 0.25 respectively, which had been difficult to produce due to the high current side reactions in previous studies.Chou et al. (2005) We also measured the open circuit potential (OCP) after each equilibrium phase is reached as shown in Fig. 2. The OCP is slightly higher than Vapp for x 0.5, but is significantly lower than Vapp for due to the side reaction. Since the OCP primarily reflects the surface energy, the trend of OCP for suggests the bulk is equilibrating with a that is lower than the surface energy. The results shown in Fig. 2 provide us with new insights into the formation of phases below using instead of OCP. The plateaus in the plot indicate phase coexistence regions with around 0.5 ,1.3 and 2.0 V. The corresponding stables phases are near , 0.33 and 0.25, which are near the simple fractional fillings of 1/2, 1/3, and 1/4.
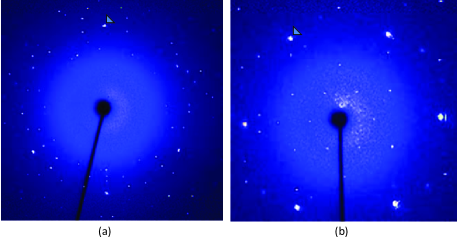
Single crystal quality is demonstrated by transmission Laue photography as shown in Fig. 3 using synchrotron X-rays ( = 0.4959 ), where is the original as-grown crystal and is the most de-intercalated sample. A Na superstructure indicated by 12 peaks forming a ring surrounding (100) is observed, just like that reported in Ref.Roger et al. (2007). An orthorhombic superstructure is found in , which is different from that observed in with electron diffraction.Zandbergen et al. (2004). Details of the superstructure analysis will be presented separately.Chou
In addition to the expected phases such as , 1/3 and 1/4, stable phases of , 0.71 and 0.75 are also clearly visible in Fig. 2. Although most early reports suggest that is a preferred equilibrated phase, it failed to show up in the versus data. This result is in agreement with the prediction from Density Functional Theory (DFT) calculation, which suggests is not a ground state due to the lack of a commensurate Na ordering pattern.Zhang et al. (2005) Our data indicate that is the most stable phase among 0.75, 0.71 and 0.67, as reflected on the significantly wider applied voltage range of the plateau. The stable phase of can be prepared with between -0.1 – 0.1V, while is barely defined by a plateau of width less than 60 mV. The phase has been shown to be at the lower boundary of the range () for compositions that possess A-type AF ordering at low temperature.Mendels et al. (2005); Sakurai et al. (2004) In addition, falls at the exact boundary that minor fluctuations would separate Na(2) to occupy either high symmetry 2c (2/3, 1/3, 1/4) or low symmetry 6h (2x, x, 1/4) sites within the space group P63/mmc.Huang et al. (2004) Such behavior indicates that is likely to be a metastable transient phase rather than a truly equilibrated ground state. The phase is very close to a simple fractional filling of 5/7 that has been predicted to be a ground state from Density Function Theory (DFT) model calculation;Zhang et al. (2005) however, there are many other choices for a simple fraction that are near 0.71. Roger et al. have proposed an ordering of multi-vacancy clusters within the Na layer for , i.e., Na ions shift from the preferred Na(2) site to the unfavorable Na(1) site that is directly on top of the Co ions to further reduce stabilization energy.Roger et al. (2007)
Another equilibrated phase below half filling is . Although the plateau for is less pronounced than that for , the narrow plateau sits between two distinctly different slopes as shown in Fig. 2. Considering the dominant diffusion species for x 0.5 are vacancy clusters, the diffusion species for would be Na ions. The fact that 0.43 being close to a simple fractional filling of 3/7 suggests that Na ions partially fill a superlattice consisting of 7 Na ions per unit supercell. Indeed Na trimer ordering of simple hexagonal unit a’ = a has recently been observed on the surface of an in-situ cleaved Na0.84CoO2 crystal using scanning tunneling microscopy, where half of the Na ions (x ) are supposed to occupy each cleaved surface pair equally.Pai Whether such 3/7 superlattice ordering exists within the bulk requires further Laue transmission diffraction analysis.
III.0.3 Phase homogeneity
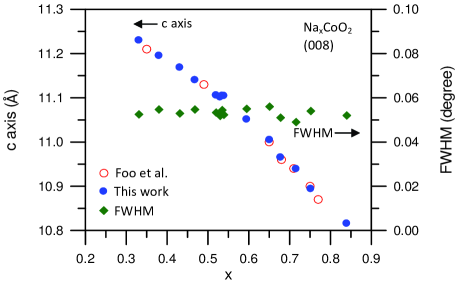
One of the major concerns in the experimental study of NaxCoO2 compounds is the question of phase homogeneity. When Na ions are de-intercalated through topochemical or electrochemical routes, the remaining Na ions should rearrange to find the ground state for each Na layer while maintaining the original CoO6 stacking. The -lattice parameters for our series of crystals were determined with X-ray diffraction and are summarized in Fig. 4. Since NaxCoO2 samples have highly oriented at (00L) planes even after the crystal is pulverized, X-ray diffraction has been performed on aligned crystals measuring the (00L) Bragg peaks. The -axis is known to strongly depend on Na content as reported by several other groups.Foo et al. (2004); Chen et al. (2004); Prabhakaran et al. (2003) Our -axis lattice size is extracted from the (008) peak angle, and our results are consistent with those reported previously.Foo et al. (2004) We notice the -lattice parameter depends almost linearly on with a weak deflection near . This behavior may suggest two regimes which follow the empirical Vegard’s rule for substitutional impurities. The -axis expansion as a function of lower has also been reflected on the softening A1g mode along the -direction.Lemmens et al. (2006) As shown in the inset of Fig. 4, phase homogeneity is evidenced by a consistently narrow full width at half-maximum (FWHM) for of the (008) peak. This width is comparable to our instrumental resolution limit, which is determined using a Si standard to be 0.05 degrees.
.
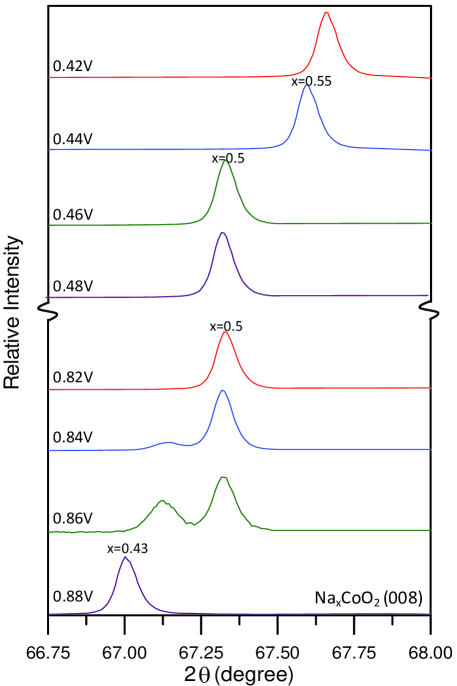
The possibility of mixed-phase crystals is ruled out within our X-ray resolution limit for nearly all of the samples prepared by our method, except for samples prepared using between 0.82 – 0.88 V as shown in Fig. 5. Two-phase behavior is observed within the narrow voltage range between 0.82 – 0.86 V, which corresponds to Na levels slightly below . The sample evolves from single phase of to a single phase of through mixed-phase intermediate states. In contrast, there is no two-phase signature observed between single phase and . No other samples exhibited two-phase signatures regardless of whether Vapp falls in the plateau range. This suggests that phases of solid-solution without specific Na ordering do exist, at least in the time frame of days during preparation and characterization. Since the FWHM of (00L) peaks provide us only with coherence information along the -axis, it is possible that in-plane ordering may yield potential microscopic phase separated domains as commonly found in this series.Zandbergen et al. (2004); Yang et al. (2005)
III.0.4 Magnetic properties
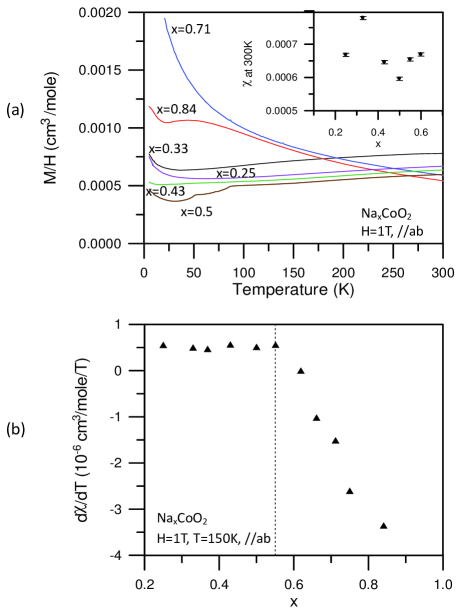
Additional evidence of phase purity is provided by magnetic susceptibility measurements. Figure 6 displays the complete susceptibility data measured under a magnetic field of 1 Tesla applied along the -direction. These results are consistent with most of the studies reported so far: magnetic behavior evolves from Curie-Weiss-like to Pauli-like as Na ions are de-intercalated from 0.84 to 0.25, without any trace of CoO or Co3O4 impurity.Chou et al. (2004b); Foo et al. (2004); Prabhakaran et al. (2003); Yokoi et al. (2005) Assuming identical Van Vleck susceptibility contribution for the Pauli paramagnetic metal region, the temperature independent portion of the average susceptibility ((300K)) should be proportional directly to the density of states at the Fermi level. The susceptibility at K (300K) for are shown in the inset of Fig. 6, where (300K) for appears as a local maximum and x = 0.5 sits at the local minimum. This trend agrees well with values extracted from specific heat measurement, where is directly proportional to the density of states at Fermi level.Jin et al. (2005) The enhancement of density of state at Fermi level for reflects its unique superconducting properties after hydration.Takada et al. (2003) The local minimum of (300K) for also indicates its proximity to the insulating state that sets in below K.Foo et al. (2004) The slope of the spin susceptibility at 150K in Fig. 6a is an indicator that separates Curie-Weiss (negative) and Pauli (positive) behaviors.Yokoi et al. (2005) The crossover point is close to as shown in Fig. 6b, which is consistent with the crossover points that have been observed in Fig. 1 of Na self diffusion and -lattice parameter as shown in Fig. 4.
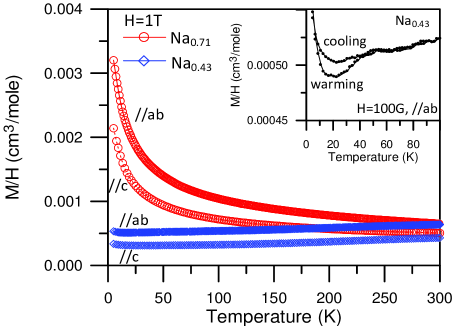
In Fig. 6a, the in-place susceptibility (T) for and are nearly identical above 100K, but x = 0.71 does not show any magnetic ordering down to 1.8 K. This behavior suggests is the first equilibrated phase below that does not possess the well known A-type AF ordering below 22-28 K.Bayrakci et al. (2005); Mendels et al. (2005) Magnetic properties of the newly identified Na0.71CoO2 and Na0.43CoO2 compositions are summarized in Fig. 7. The Curie-Weiss-like low temperature upturn for agrees very well with the recent 23Na NMR Knight shift data on samples with .Mukhamedshin et al. (2007) Powder average of and can be fitted to a simple relationship of ).Chou et al. (2004b) Fitting over the temperature range K yields cm3K/mole and -42K. In a simple ionic picture, this corresponds to about a 72% concentration of Co4+ ions that participate in the weak antiferromagnetically correlated paramagnetic behavior. Then the electrons on the remaining 28% of the Co ions are itinerant. We speculate that a special Na ion ordering of may form a large supercell that provides the underlying potential for such partial charge delocalization.
Na0.43CoO2 shows Pauli-like behavior just like all other samples with . However, low field measurement revealed a weak thermal hysteretic behavior below 40 K as shown in the inset of Fig. 7. The hysteresis onset near 40K for is very close to the metal-to-insulator transition found in , which seems to suggest the inclusion of nearby phase. In addition, there are traces of weak 51 K and 88 K anomalies observable at the level of a few percent. However, the transition at 51 K for does not show thermal hysteresis, instead, the onset of hysteresis is found to set in below the weak ferromagnetic phase 27K.Gasparovic et al. (2006) Based on the room temperature structural evidence shown in Fig. 5, we can produce samples with no phase inclusion within the matrix. We cannot rule out the possibility of phase segregation below room temperature. The observed thermal hysteresis of the susceptibility below 40 K may be related to either weak ferromagnetism or spin glass behavior.
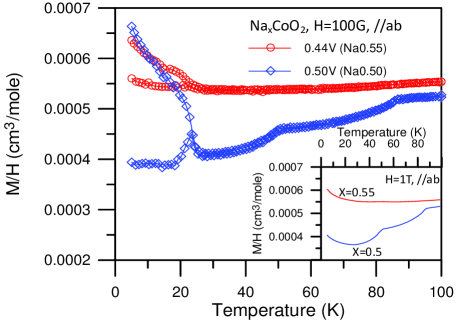
For Na0.5CoO2, three phase transitions can be identified at 27, 51 and 88 K in the magnetic susceptibility measured along the -direction under low magnetic field, as shown in Fig. 8. The transition at 88 K is due to a novel antiferrmagnetic ordering transition, where the ordered spin arrangement and direction has been deduced from polarized neutron diffraction.Gasparovic et al. (2006) The transition at 51 K correlates to a metal-to-insulator transition which may be related to nesting of the Fermi surface.Bobroff et al. (2006) Most of the magnetic measurement results of Na0.5CoO2 at high field before show low temperature upturns below 30 K of various sizes, usually attributed to trace amount of isolated paramagnetic spins.Watanabe et al. (2006); Pedrini et al. (2005) Interestingly, we find the transition at 27 K shows ferromagnetic character with thermal hysteresis at low field as well as field hysteresis at 5 K (not shown). The significant thermal hysteresis found below 27K for Na0.5CoO2 strongly implies its weak ferromagnetic nature. This transition below 27 K appears to further increase the in-plane resistivity.Gasparovic et al. (2006)
The Na0.55CoO2 composition has been previously reported to have a strong in-plane ferromagnetic ordering below 20K with no magnetic anomalies found near 51 or 88 K.Wang et al. (2006) One immediate concern on preparing pure NaxCoO2 crystal with is how to separate the potentially mixed phases between Na0.55CoO2 and Na0.5CoO2. A series of fully equilibrated crystals have been prepared with different applied voltage in small steps between 0.40 – 0.50 V; the results of structure evolution are shown in Fig. 5 and magnetic susceptibilities are plotted together with that of in Fig. 8. High field susceptibility measurements show a clear difference: nearly temperature independent behavior for to the one with positive slope for . Low field measurements indicates our Na0.55CoO2 crystal has a weak ferromagnetic transition near 27 K without any 51 K or 88 K anomalies, in contrast to Na0.5CoO2. This rules out the possibility of a mixed phase within such a small concentration range. Na0.55CoO2 and Na0.5CoO2 should be considered as two distinctly different phases, although the former is closer to a critical transient state with an extremely narrow plateau as indicated in Fig. 2. We note that the saturated moment and coercive field for Na0.55CoO2 obtained from the electrochemical method is lower than that prepared by the chemical extraction method using iodine/acetonitrile solution.Wang et al. (2006) In Na0.5CoO2, the size of the magnetic susceptibility upturn below 27 K appears to be highly sample dependent in the literature.Bobroff et al. (2006); Gasparovic et al. (2006); Pedrini et al. (2005); Yokoi et al. (2005) One major difference between chemical and electrochemical methods has been compared on LixCoO2. Chemical de-intercalation method has a significantly higher charging rate, and thus easier to access the metastable states.Venkatraman and Manthiram (2002) We believe the chemical method with a much higher charging rate may yield metastable phases of Na0.55CoO2 of higher weak FM moment, and these may eventually fall into a more equilibrated phase similar to that obtained using the electrochemical route.
III.0.5 Transport properties
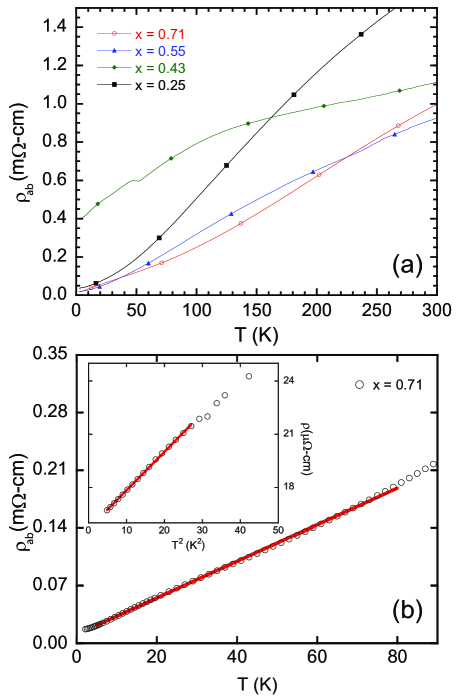
The transport properties of four of our newly synthesized
compositions are summarized in Fig. 9. As shown in
Fig. 9(a), the compositions with and
exhibit metallic conductivity, and are consistent with the trend
suggested by the phase diagram previously proposed.Foo et al. (2004)
The sample with , does not behave like a good metal and
appears to have a large residual resistivity. This particular sample
may contain coexisting regions of different phases, such as
, which are more stable at the local scale. Indeed, after
annealing at K for several hours (not shown), this sample
displays a transition to an insulating regime below K,
which is a particular feature of the
compositionGasparovic et al. (2006).
The resistivity of the sample at lower temperatures is
shown in detail in Fig. 9(b). A roughly -linear
temperature dependence is observed between K and 80 K,
consistent with previous measurements.Foo et al. (2004) Fermi liquid
behavior is recovered at low temperatures where electron-electron
scattering dominates, as noted previously.Li et al. (2004) Here,
below K the data may be fit by the function of . Our fit (plotted as the solid line) yields
values of and . The residual resistivity may
arise from scattering due to domain boundaries and/or perturbations
to the periodic potential felt by electrons within the plane,
such as defects in the Na arrangement. The observed value of
is about three times smaller than previous
measurementsLi et al. (2004) and attests to the high homogeneity of
the current Na-ordered sample. The value of , while
somewhat smaller than previous measurements, is still relatively
large and indicates an large Kadowaki-Woods ratio, , assuming is similar to previous
measurements.Li et al. (2004)
IV Summary
In summary, we have demonstrated that a non-aqueous electrochemical
de-intercalation process can be used to prepare high quality single
crystal samples of -NaxCoO2 with well-defined Na
superlattices. The sodium ion self diffusion mechanism has been
demonstrated to be well fit by a 1D diffusion model on an aged
single crystal. The dominant diffusion species above
is consistent with Na vacancies, and the diffusion coefficient is
higher for , compared to . The existence of stable
phases are reflected in the plateaus, among which , 1/3 and 1/4 are the most stable. The data suggest that , 0.55 and 0.43 are somewhat less stable. On the other
hand, is a very stable phase with a sizeable
plateau width. This stable phase is
intriguing for its potential Na ordering but without any magnetic
ordering down to 1.8K. The absence of A-type AF ordering for and the presence of weak FM in and 0.55 may be
related to subtle interactions between the Co ions and the specific
potential caused by Na ion ordering, as it is known that Na
superstructures can affect the Fermi surface geometry. Clearly more
work is required to investigate the effects of Na order across the
NaxCoO2 phase diagram. Our progress with this electrochemical
technique opens the door for further studies of the physical
properties of the stable Na ordered phases in single crystal
samples.
†corresponding author: fcchou@ntu.edu.tw
Acknowledgements.
FCC and GJS acknowledge B. X. Xie’s help on fitting of diffusion equation. We acknowledge the helpful discussions with M. W. Chu, Larry Pai, and Patrick Lee. This work was support by the National Science Council of Taiwan under project number NSC-95-2112-M-002. The work at MIT was supported by the U.S. Department of Energy under Grant No. DE-FG02-04ER46134.References
- Takada et al. (2003) K. Takada, H. Sakurai, E. Takayama-Muromachi, F. Izumi, R. A. Dilanian, and T. Sasaki, Nature 422, 53 (2003).
- Bayrakci et al. (2005) S. P. Bayrakci, I. Mirebeau, P. Bourges, Y. Sidis, M. Enderle, J. Mesot, D. P. Chen, C. T. Lin, and B. Keimer, Phys. Rev. Lett. 94, 157205 (2005).
- Foo et al. (2004) M. L. Foo, Y. Wang, S. Watauchi, H. Zandbergen, T. He, R. J. Cava, and N. P. Ong, Phys. Rev. Lett. 92, 247001 (2004).
- Bobroff et al. (2006) J. Bobroff, G. Lang, H. Alloul, N. Blanchard, and G. Collin, Phys. Rev. Lett. 96, 107201 (2006).
- Gasparovic et al. (2006) G. Gasparovic, R. A. Ott, J. H. Cho, F. C. Chou, Y. Chu, J. W. Lynn, and Y. S. Lee, Phys. Rev. Lett. 96, 046403 (2006).
- Lee et al. (2006) M. Lee, L. Viciu, L. Li, Y. Wang, M. L. Foo, S. Watauchi, R. A. P. Jr., R. J. Cava, and N. P. Ong, Nature Materials 5, 537 (2006).
- Delmas et al. (1981) C. Delmas, J. J. Braconnier, C. Fouassier, and P. Hagenmuller, Solid State Ionics 3-4, 165 (1981).
- Chou et al. (2005) F. C. Chou, E. T. Abel, J. H. Cho, and Y. S. Lee, J. Phys. Chem. Sol. 66, 155–160 (2005).
- Balicas et al. (2005) L. Balicas, M. Abdel-Jawad, N. E. Hussey, F. C. Chou, and P. A. Lee, Phys. Rev. Lett. 94, 236402 (2005).
- Chou et al. (2004a) F. C. Chou, J. H. Cho, P. A. Lee, E. T. Abel, K. Matan, and Y. S. Lee, Phys. Rev. Lett. 92, 157004 (2004a).
- Singh (2000) D. J. Singh, Phys. Rev.B 61, 13397 (2000).
- Lee et al. (2005) K. W. Lee, J. Kunes, P. Novak, and W. E. Pickett, Phys. Rev. Lett. 94, 026403 (2005).
- Zhou and Wang (2007) S. Zhou and Z. Wang, Phys. Rev. Lett. 98, 226402 (2007).
- Yang et al. (2004) H. B. Yang, S. C. Wang, A. K. P. Sekharan, H. Matsui, S. Souma, T. Sato, T. Takahashi, T. Takeuchi, J. C. Campuzano, R. Jin, et al., Phys. Rev. Lett. 92, 246403 (2004).
- Hasan et al. (2004) M. Z. Hasan, Y. D. Chuang, D. Qian, Y. Li, Y. Kong, A. Kuprin, A. V. Fedorov, R. Kimmerling, E. Rotenberg, K. Rossnagel, et al., Phys. Rev. Lett. 92, 246402 (2004).
- Balicas et al. (2006) L. Balicas, J. G. Analytis, Y. J. Jo, K. Storr, H. Zandbergen, Y. Xin, N. E. Hussey, F. C. Chou, and P. A. Lee, Phys. Rev. Lett. 97, 126401 (2006).
- Zandbergen et al. (2004) H. W. Zandbergen, M. Foo, Q. Xu, V. Kumar, and R. J. Cava, Phys. Rev.B 70, 024101 (2004).
- Zhang et al. (2005) P. Zhang, R. B. Capaz, M. L. Cohen, and S. G. Louie, Phys. Rev. B 71, 153102 (2005).
- Meng et al. (2005) Y. S. Meng, A. V. der Ven, M. K. Y. Chan, and G. Ceder, Phys. Rev. B 72, 172103 (2005).
- Roger et al. (2007) M. Roger, D. J. P. Morris, D. A. Tennant, M. J. Gutmann, J. P. Goff, J.-U. Hoffmann, R. Feyerherm, E. Dudzik, D. Prabhakaran, A. T. Boothroyd, et al., Nature 445, 631 (2007).
- Motohashi et al. (2001) T. Motohashi, E. Naujalis, R. Ueda, K. Isawa, M. Karppinen, and H. Yamauchi, App. Phys. Lett. 79, 1480 (2001).
- Yang et al. (2005) H. X. Yang, Y. G. Shi, C. J. Nie, D. Wu, L. X. Yang, C. Dong, H. C. Yu, H. R. Zhang, C. Q. Jin, and J. Q. Li, Mater. Chem. Phys. 94, 119 (2005).
- Schaak et al. (2003) R. E. Schaak, T. Klimczuk, M. L. Foo, and R. J. Cava, Nature 424, 527 (2003).
- Prabhakaran et al. (2004) D. Prabhakaran, A. T. Boothroyd, R. Coldea, and N. R. Charnley, Journal of Crystal Growth 271, 74 (2004).
- Shin et al. (2002) Y.-J. Shin, M.-H. Park, J.-H. Kwak, H. Namgoong, and O. H. Han, Solid State Ionics 150, 363– 372 (2002).
- Jang et al. (2001) Y.-I. Jang, B. J. Neudecker, and N. J. Dudney, Electrochemical and Solid-State Letters, 4, A74 (2001).
- Takada et al. (2004) K. Takada, K. Fukuda, M. Osada, I. Nakai, F. Izumi, R. A. Dilanian, K. Kato, M. Takata, H. Sakurai, E. Takayama-Muromachid, et al., J. Mater. Chem. 14, 1448 (2004).
- (28) F. C. Chou et al., unpublished
- Mendels et al. (2005) P. Mendels, D. Bono, J. Bobroff, G. Collin, D. Colson, N. Blanchard, H. Alloul, I. Mukhamedshin, F. Bert, A. Amato, et al., Phys. Rev. Lett. 94, 136403 (2005).
- Sakurai et al. (2004) H. Sakurai, S. Takenouchi, N. Tsujii, and E. Takayama-Muromachi, J. Phys. Soc. Jpn. 73, 2081 (2004).
- Huang et al. (2004) Q. Huang, B. Khaykovich, F. C. Chou, J. H. Cho, J. W. Lynn, and Y. S. Lee, Phys. Rev. B 70, 134115 (2004).
- (32) W. W. Pai et al., unpublished.
- Chen et al. (2004) D. P. Chen, H. C. Chen, A. Maljuk, A. Kulakov, H. Zhang, P. Lemmens, and C. T. Lin, Phys. Rev.B 70, 024506 (2004).
- Prabhakaran et al. (2003) D. Prabhakaran, A. T. Boothroyd, R. Coldea, L. M. Helme, and D. A. Tennant, cond-mat/0312493 (2003).
- Lemmens et al. (2006) P. Lemmens, K. Y. Choi, V. Gnezdilov, E. Y. Sherman, D. P. Chen, C. T. Lin, F. C. Chou, and B. Keimer, PRL (2006).
- Chou et al. (2004b) F. C. Chou, J. H. Cho, and Y. S. Lee, Phys. Rev. B 70, 144526 (2004b).
- Yokoi et al. (2005) M. Yokoi, T. Moyoshi, Y. Kobayashi, M. Soda, Y. Yasui, M. Sato, and K. Kakurai, J. Phys. Soc. Jpn. 74, 3046 (2005).
- Jin et al. (2005) R. Jin, B. C. Sales, S. Li, and D. Mandrus, Phys. Rev.B 72, 060512 (2005).
- Mukhamedshin et al. (2007) I. Mukhamedshin, H. Alloul, G. Collin, and N. Blanchard, cond-mat/0703561 (2007).
- Watanabe et al. (2006) H. Watanabe, Y. Mori, M. Yokoi, T. Moyoshi, M. Soda, Y. Yasui, Y. Kobayashi, M. Sato, N. Igawa, and K. Kakurai, 0601538 (2006).
- Pedrini et al. (2005) B. Pedrini, J. L. Gavilano, S. Weyeneth, E. Felder, J. Hinderer, M. Weller, H. R. Ott, S. M. Kazakov, and J. Karpinski, Phys. Rev. B 72, 214407 (2005).
- Wang et al. (2006) C. H. Wang, X. H. Chen, T. Wu, X. G. Luo, G. Y. Wang, and J. L. Luo, Phys. Rev. Lett. 96, 216401 (2006).
- Venkatraman and Manthiram (2002) S. Venkatraman and A. Manthiram, Chem. Mater. 14, 3907 (2002).
- Li et al. (2004) S. Y. Li, L. Taillefer, D. G. Hawthorn, M. A. Tanatar, J. Paglione, M. Sutherland, R. W. Hill, C. H. Wang, and X. H. Chen, Phys. Rev. Lett. 93, 056401 (2004).