Discreteness-induced Transition in Catalytic Reaction Networks
Abstract
Drastic change in dynamics and statistics in a chemical reaction system, induced by smallness in the molecule number, is reported. Through stochastic simulations for random catalytic reaction networks, transition to a novel state is observed with the decrease in the total molecule number , characterized by: i) large fluctuations in chemical concentrations as a result of intermittent switching over several states with extinction of some molecule species and ii) strong deviation of time averaged distribution of chemical concentrations from that expected in the continuum limit, i.e., . The origin of transition is explained by the deficiency of molecule leading to termination of some reactions. The critical number of molecules for the transition is obtained as a function of the number of molecules species and that of reaction paths , while total reaction rates, scaled properly, are shown to follow a universal form as a function of .
pacs:
87.16.Yc, 82.39.Rt, 05.40.-aI 1. Introduction
In intra-cellular biochemical reaction processes, some chemical species often play an important role at extremely low concentrations, amounting to only a few molecules per cellcell1 ; cell2 ; cell3 ; cell4 . In such situations, the fluctuations and discreteness in the molecule number are obviously important. On the other hand, in rate equations, generally adopted in chemical kinetics, the concentration of each chemical species is treated as a continuous variable, and the fluctuations and the discreteness of the number of molecules are neglected. However, if the molecule number is not very large, the number fluctuations as well as discreteness in the number, rather than a continuous concentration, has to be considered seriously.
Of course, effects of fluctuations in concentrations are considered by using stochastic differential equations. Indeed, several non-trivial noise-induced phenomena have been reportedsto1 ; sto2 ; sto3 . However, in most of such studies, discreteness in the molecule numbers, i.e., the number being 0,1,2,.., has not been considered seriously.
Recently, Togashi and Kaneko reported a drastic change in the steady distribution of chemical concentrations as a result of discreteness in the molecule number, by studying a catalytic reaction network with a few molecules speciestogashi1 ; togashi2 . Novel types of dissipative structure formation, induced by very low concentration molecules, have also been investigatedmif1 ; mif2 ; Solomon ; togashi3 ; marion ; zhdanov in a class of reaction-diffusion systems or the models of biochemical reactions in cells. The observed novel states in these studies are a result of fluctuations and discreteness in the molecular numbers, in particular of extinction and re-emergence of some molecule species, which alternate in time.
Relevance of such discreteness in molecule number to emergence of novel states should not be restricted to a simple reaction network with a few molecule species, but is also expected to exist in a wide variety of chemical reaction systems with a large number of species. Here, dynamics and statistics of chemical reaction systems with a finite (small) number of molecules and a large number of molecule species have to be investigated. Such study is important not only for biochemical reaction kinetics generally, but also as a problem of non-equilibrium statistical mechanics. Here, the criterion on “smallness” in the number itself should be clarified as a condition for discreteness-induced transition for a given chemical reaction network system.
In this paper, we study discreteness-induced transition in a reaction network where a large number of chemical species is connected by catalytic reaction paths chosen randomly. Use of random catalytic reaction network is pioneered by Kauffman Kauffman ; Kaneko-Adv for the problem of the origin of life, while studies in a growing cell model consisting of such reaction network have unveiled universal statistical behaviors of chemical concentrations, which are confirmed in the gene expression data in the present cellsFurusawa ; Ito . Here, we are interested in how discreteness in the molecule numbers affect global behavior of chemical reaction dynamics in such network. For simplicity, we only consider the reaction network whose steady state is unique and stationary when the number of molecules is infinite, i.e., the corresponding rate equation has just a unique fixed point attractor. Even in such a simple system, we find the following transition to a discreteness-induced state, which appears when the total number of the molecules is below a critical value;
A) Chemical concentrations exhibit intermittent switching among several states with distinct chemical compositions.
B) The long time average of the chemical concentrations deviate distinctly from those expected in the continuum limit with a large number of molecules where the rate equation description is valid.
We will also obtain the critical molecule number for this discreteness induced transition, whose dependence on the number of chemical species and path ratio of the reaction network will be derived.
In the next section, we introduce a specific reaction network model, while numerical results to show the above transition with the decrease in the molecule number are presented in section 3. Possible mechanism for the transition is described in section 4, where deficiency in some molecules is shown to introduce switching among several effective reaction networks that consist only of non-vanishing chemical species. In section 5, we obtain the critical number of molecules for the transition as a function of the number of molecule species and connectivity in the network. Summary and discussion will be given in section 6.
II 2. Model
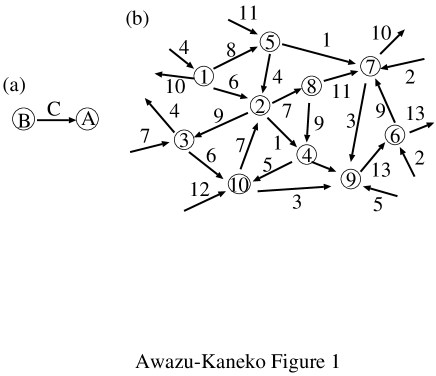
Now, we introduce a simple model of a network of elementary reactions that consists of a variety of chemical speciesFurusawa . State of the system is represented by a set of numbers , where indicates the number of molecules of the chemical species (), with as a total number of molecule species. Here, the total number of molecules is fixed at , and accordingly . For the chemical reaction dynamics, we choose a catalytic network among these chemical species, where each reaction from a chemical to another chemical is assumed to be catalyzed by a third chemical ; i.e., (see Fig. 1). The reaction coefficients are set to be identical for all reactions for simplicity, and chosen to be . Then, the growth rate in (or the decay rate in ) through this reaction is give by , on the average.
The connection paths in a reaction network are chosen randomly (and then fixed), where the average number of the reaction paths from a chemical to any other chemical species catalyzed by a chemical is set at a given connection number . We do not include auto-catalytic reaction in the form of , because such type of reaction is not usually elementary but is realized as a result of a series of (non-auto-catalytic) elementary reactions. Also, inclusion of auto-catalytic paths sometimes leads to non-fixed-point or multiple attractors, which makes discussion on the discreteness effect complicated.
We also include a flow of chemicals into and out of the system from the reservoir. With this process, the total number of molecules is fixed so that a molecule is regarded to be replaced by some other with a certain rate. Instead of considering such flow, one can equivalently consider a combination of decomposition and synthesis of some chemicals, or non-catalytic changes between different molecule species that are chosen randomly from all chemicals with equal probability. For simplicity, we assume that this ‘non-catalytic’ change occurs with equal probability for all molecules, while its rate is much smaller than that of the catalytic reaction.
Numerical simulations are carried out by iterating the following stochastic processes. First, we randomly pick up a pair of molecules and if the pair is a substrate and catalyst according to the reaction network, the substrate molecule is transformed to the product molecule according to the reaction. Second, we randomly pick up a molecule and transform it by a non-catalytic change, with a given, much lower, rate. Here, a unit time is given as the time span in which Monte-Carlo steps for catalytic reactions are repeated times and those for non-catalytic processes are repeated times. In each time, each molecule collides with another molecule once on average, to check if the catalytic reaction occurs, while it is transformed transformed to some other chemical with probability by non-catalytic process. Numerically, we apply this stochastic simulation, while in the cases with (i.e., continuous limit), the reaction dynamics are represented by the following rate equation,
| (1) |
where is 1 if there is a reaction , and 0 otherwise.
In the following sections, we present numerical results of the stochastic simulations and show how the steady state properties of such catalytic reaction networks depend on the number of chemical species and of molecules . In this paper, we consider the case with as where indicates the critical connection number of the percolation transition in random networks. It is noted that the rate equation (1) in the continuum limit has only a unique fixed point attractor that gives the concentrations at the steady state.
III 3. Discreteness-induced Transition
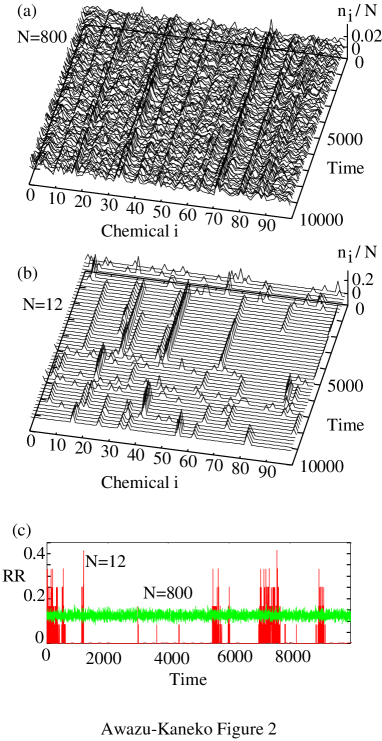
We show the results of the stochastic simulation of catalytic reaction networks with . We study how dynamical aspects of the system change depending on the number of molecules , by taking a given reaction network. Figures 2(a) and (b) show typical temporal evolutions of the concentrations of each chemical species for a reaction network with and . Two cases with (a) large () and (b) small () are plotted, while Figure 2(c) shows the reaction ratio () of these cases, where is defined by [Number of reacting molecules] at each time. If is much larger than (e.g., ), as seen in Figs. 2(a) and (c), the distribution of is almost stationary and takes a constant value except for small fluctuations.
On the other hand, if is much smaller than some value (that is of the order of ) (e.g., ), the distribution of exhibits remarkable changes in time, and fluctuates intermittently between large values and , as seen in Figs. 2(b) and (c). Such non-stationary behavior is caused by the discreteness in the molecular number. When is much smaller than some threshold of the order of , the concentrations of some chemical species go to at some time instance. Then the number of reactive chemicals or of the catalysts often goes to , for all reaction paths. Then, the catalytic reactions of the system freeze, while the system can escape from such freezing state as a result of non-catalytic changes (flow of molecules). Thus, changes intermittently with time.
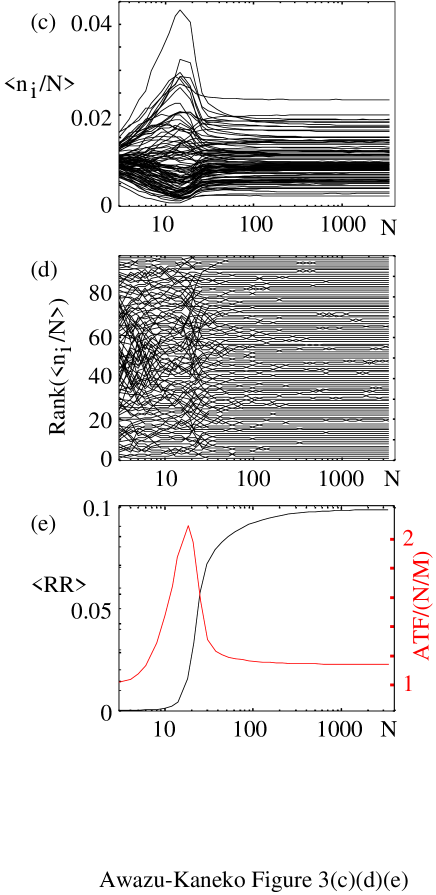
Next, we focus on typical statistical aspects of the system by changing . Long time average of the distributions of the chemical concentrations for a typical reaction network with and is plotted in Fig. 3(a) (for large , ) and Fig. 3(b) (for a small , ). As seen in these figures, the profiles of the average distribution are quite different between the two. In Figs. 3(c) and (d), we show and the rank of abundances of each chemical concentration, which is labeled in the order of magnitude of . These are plotted as a function of for a given reaction network, where each successive curve indicates the change in and the rank of each chemical concentration.
The results in Figs. 3(c) and (d) suggest the existence of a critical value of , denoted by . For smaller than , the chemical abundances of each species or their rank changes sensitively with . The variance of over time takes a maximum at some slightly smaller than this critical value . On the other hand, for larger than , are almost constant except for the small fluctuations, and indeed the profile of for such larger agrees with that obtained by the rate equation (1), i.e., the system is well described by the continuum limit .
Now, we focus on the transition of reaction dynamics at . For larger than , the temporal evolution of the distribution of is almost stationary except for small fluctuations as in Fig. 2(a). On the other hand, for , there appears intermittent switching between different distributions of as shown in Fig. 2(b). In this case, the total reaction ratio is much smaller and the temporal fluctuation of each chemical concentration is much larger than the case with . We have computed dependence of the average reaction ratio and the average temporal fluctuation (ATF) of all chemical concentrations. Here, is defined as the long time average of , and ATF is defined as the long time average of .
Figure 3(e) shows and ATF/(), plotted as a function of for the same reaction network. In this figure, starts to decrease drastically with the decrease in , at the above mentioned critical value. This figure also shows that ATF is proportional to for , while ATF/() increases sharply with the decrease in for . This increase in the fluctuation is consistent with the fact that the switching behavior becomes dominant for .
As shown in Fig. 1, switching over several states with different effective network occurs for small , as will be also discussed in the next section. As is decreased further below , the reaction occurs rarely, and thus the frequency of such switching decreases, while for large , the dynamics exhibit only small fluctuations around a stationary state. Thus, the fluctuation is expected to have a peak around where the switching occurs most frequently.
IV 4. Effects of molecular deficiency in a small reaction network
The behavior observed in the previous section is rather common over a variety of catalytic reaction networks. The dynamics and the time averaged distributions of for a case with differ distinctly from those with , because of the discreteness in the number of molecules. Here we discuss the mechanism of this transition, by taking a simple example of the catalytic reaction network with a small number of chemical species. This example system is a little specific but can illustrate the changes in the steady distribution and the effective network structure consisting only of non-vanishing chemical components. (see togashi4 for a discreteness-induced switching over states in an autocatalytic network).
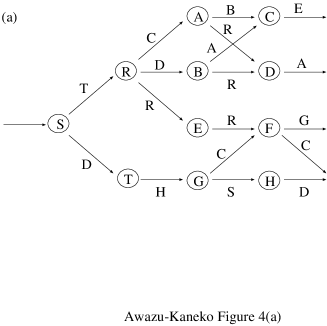
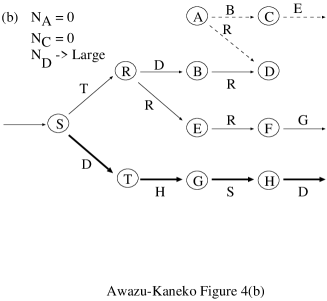
We consider a network of catalytic reactions displayed in Fig.4 (a). Here, we assume that always holds. By straightforward calculation, the rate equation for the chemical concentrations has a unique fixed-point attractor, which satisfies the relations, .
On the other hand, for small , some of often happens to be . In such cases, the above relationship on the fixed concentrations no longer holds, where the distribution of the chemical concentrations changes temporally among some characteristic distributions with different relations among , , , , and .
I) State with and : When happens to be , also goes to , if the decrease in by the reaction progresses before the reaction takes place. This state is also reached when happens to be and if goes to by the reaction or by the non-catalytic process. Once both and vanish, this state with extinction of both chemical species is preserved over a long time, because neither nor is synthesized by catalytic reactions, and only slow non-catalytic changes can produce such chemicals.
At this state, none of the reactions catalyzed by or take place. Then, as long as for , , the effective structure of the reaction network is reduced to that shown in Fig. 4(b). Only molecules within this sub-network exist. (In Fig. 4(b), the arrows indicating the reactions catalyzed by or are removed.) In this case, increases, because the reaction to decrease catalyzed by does not take place. Accordingly, the reaction takes place frequently so that the reaction through the series progresses with a high rate.
II) The state with and : When happens to be , also goes to , if decreases by the reaction . It also appears when happens to be and decreases to by the reaction . Once both and vanish, this state is preserved over a long time.
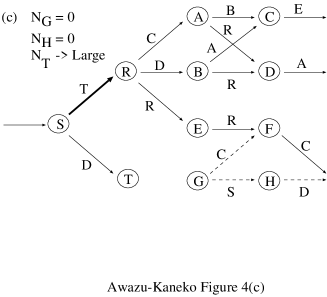
Here, when for , , the effective structure of the reaction network is given in Fig. 4(c). Similarly with the case I), chemicals are localized within this subnetwork. In this effective network the reaction progresses through the series , and with a high rate.
III) For , , and , is soon recovered even if it happens to be 0. For example, even if happens to be , as long as does not reach 0, is soon recovered by the reaction . Other chemical species also behave in a similar manner. Then, disconnection of the reaction paths does not occur.
Each of these three states has a long life time when the number of molecules is much smaller than the number of the chemical species. Stochastic switching over such states is commonly observed for a reaction network system with small , as given in Fig. 2(b). Due to these switchings, the temporal fluctuation of each chemical concentration is enhanced, as given in Fig. 3(e). Thus, the behavior for small is distinct from that obtained in the case with .
Here the relations between , , and differ distinctly from that in the continuum limit. For example, and are obtained here. This deviation from the continuum limit is understood easily by considering the number distribution at the states I) and II).
In general, we expect that situations similar to this simple example should appear in some part of the reaction networks for a system with a large number of the chemical species, as discussed in the last section. This leads to the transition at , with drastic difference in the number distribution from the continuum limit, as given in Fig. 3(a), (b) and (c).
V 5. Critical value of molecular number
In section 3, we suggested the existence of the critical total number of molecules , at which the behaviors of random catalytic networks change drastically. For , the behavior is well represented by continuum description, while for , deficiency in some molecule species suppresses the ongoing reaction. In this section, we study dependence of this critical number on and quantitatively, by computing the reaction rate .
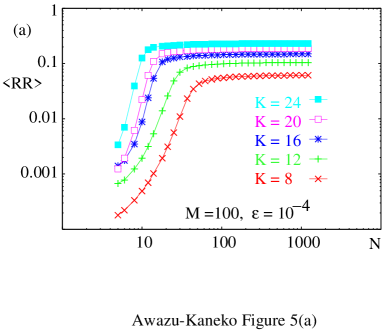
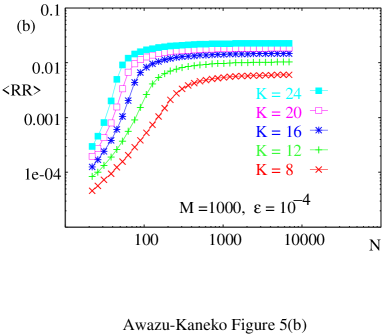
Figure 5 shows examples of dependence of on for several values of , and , and , (a) with , (b) with . As is decreased, there is a drastic drop in at some value of . When is sufficiently larger than this value, is almost constant, approaching a value at the continuum limit where chemical concentrations are almost stationary except for small fluctuations. On the other hand, for smaller than this critical value, the chemical concentrations exhibit intermittent switching among several states.
Now, we consider for a specific case with ; for all chemical species, the number of the reaction path from other chemical species and those to other chemical species are given a unique value . In such cases, the distribution of the chemical concentrations goes to uniform. In each time step, each molecule collides one molecule on average, and the probability that the molecule catalyzes the reaction from the collided molecule is . Then, is given by .
If the fluctuation of the number of the reaction paths for each chemical specie increases, the reaction from the chemical species which have small number of reaction paths limit the reaction rate. Then, is smaller than in general.
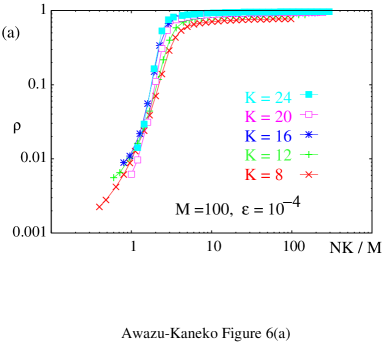
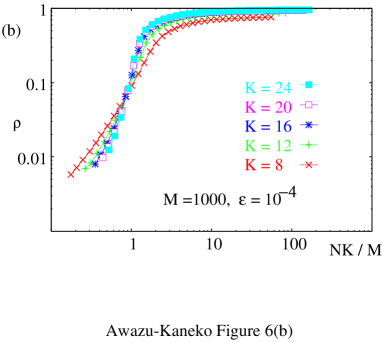
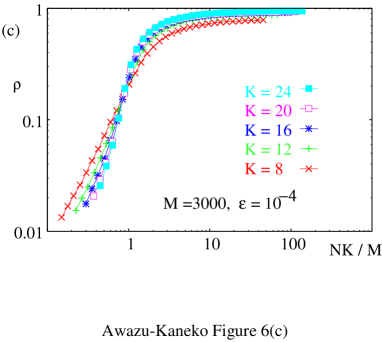
Now, to study dependence of on , , and , we introduce the following scaling functions; as a normalized reaction rate and . Note that is nothing but the average molecular number of each chemical, which gives the average probability that each reaction path is catalyzed. Thus, gives the average number of the effective reaction paths in the network. Based on these considerations, we plot this normalized reaction rate as a function of , to see dependence.
Figure 6 shows as a function of for several values of , and , and , (a) , (b) and (c) with . As is increased, this scaled function approaches a form independent of . Here we note that there is a specific value of at which all the curves of for different values of crosses. Below this value , the normalized reaction rate decreases with the increase in , suggesting that the deficiency in molecule number per reaction path further suppresses the ongoing reaction. On the other hand beyond , the normalized reaction rate slightly decreases with the decrease in , due to the increase in the reaction path number fluctuation per path. As the reaction is suppressed due to deficiency in molecule number for , this value of gives a criterion for discreteness induced transition.
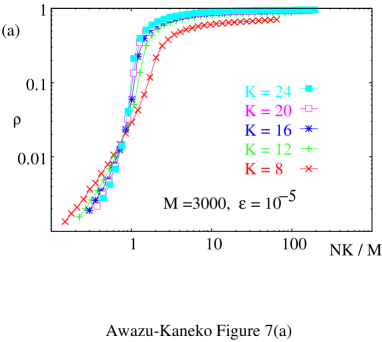
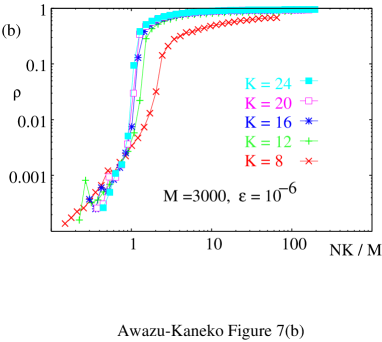
Dependence of the reaction rate on is shown in Fig. 7. Here, the value of seems to be independent of and for larger (, or larger ) and smaller (as is also compared with that in Fig.6), where holds. On the other hand, the value of at decreases as , as shown in Fig. 6(c) and Fig. 7. Then, for , the reaction rate approaches 0, while at is almost unchanged. In other words, as goes to zero, the normalized reaction rate seems to approach a step function with 0 for . This means that the catalytic reactions often freeze. Some reaction paths are terminated frequently if , and only non-catalytic changes give dominant contributions to the reaction dynamics. On the other hand, for , all chemicals can react along the connected paths in the catalytic reaction network for most of time, so that the behavior at the continuum limit is valid, i.e., . To sum up the value gives a criterion for the discreteness-induced transition, i.e., for large .
VI 6. Summary and discussions
In this paper, we have reported a discreteness-induced transition in catalytic reaction networks with random connections. When the total number of the molecules is smaller than a critical value, transition to a novel dynamical state is observed with a distinct behavior from that expected in the continuum limit, i.e., the molecular number . The behavior is characterized by switching over quasi-stationary states where some reaction paths are terminated effectively due to deficiency in molecule numbers. Each quasi-stationary state is characterized by a smaller set of effective reaction networks.
The critical molecule number for this transition is shown to be proportional to the number of chemical species divided by the average number of reaction path per species , with a proportion coefficient, estimated to be in a limit with large . Whether the number of molecules is large enough to be approximated by the continuous rate equation or not is thus determined by .
So far we have not succeeded in estimating this value of analytically. It could possibly be related with the percolation threshold of a random network, although the relationship is not so straightforward. The percolation transition point in general random networks is known to increase logarithmically with the increase in the number of nodes of the networkgraph while decreases to converge to a constant value, with the increase in the number of nodes (chemical species). Thus, the relation between and is still unclear, and analytic estimate of is still an open question.
It is noted that the random network does not give a good approximation of the real biological network. However, the results obtained in such simplest reaction network should give a base to characterize the behaviors in several types of networks. The present study gives a starting point for the statistical physics of several catalytic reaction networks.
On the other hand even by random catalytic reaction networks, some universal features such as Zipf’s law in the gene expressions and log normal distributions of the fluctuations of chemical concentration in cells are reproducedFurusawa ; Ito . We may expect our results provide some insight to biological phenomena.
In the presented model, below the critical number of molecules (or beyond the critical number of molecule species), there appears intermittent transitions over several states, which leads to the change in the structure of effective reaction network. Such dynamics may give a hint to uncover possible mechanisms of switching behavior in the signaling pathwayssig .
Also, dominantly acting paths in the metabolic reaction network of E. coli change in accordance with the concentration of the nutrient, as observed by the flux analysismeta . In the nutrient poor environment, some chemical species may be deficient in a cell. The discreteness induced transition studied here may be relevant to such switch in the effective network.
Recently, large phenotype fluctuations in isogenetic cells are reported in several organismsIto ; Laha ; Miha . In such cells, abundances of some molecule species are not so large (10 - 100 molecules) while there exist more than 1000 chemical speciesGupt . The intermittent switching induced by molecular deficiency may underlie such large fluctuations.
Last, we briefly discuss dependences of the transition on the network topology or a connecting distribution. We have confirmed that the value of as well as the peak (or dip) in and ATF are almost unchanged, even if the reaction coefficients are distributed uniformly between ands , or take two distinct values, say 0.1 and 0.9 randomly. The results are not changed either, even if there are some chemical species that catalyze many reaction paths and those catalyzing only a few paths.
However, the value of can be shifted if the auto-catalytic productions are dominant. If the reaction to a chemical species is catalyzed by itself, its concentration can increase rapidly, which may decrease the number of the species at the upstream of this reaction towards zero. The probability that some molecule species goes extinct is increased, as has been recently reported for a simple reaction network of a few species togashi1 ; togashi2 .
Dependence of the discreteness-induced transition on the network topology is an important future issue both for chemical reaction network dynamics in general and also for the understanding of intra-cellular chemical reactions.
VII ACKNOWLEDGMENT
The authors would like to thank Y. Togashi, K. Fujimoto, M. Tachikawa and S. Ishihara for stimulating discussions.
References
- (1) B. Alberts, et. al., Molecular Biology of the Cell 4th ed. (Garland Science, New York, 2002).
- (2) N. Olsson,, E. Piek, P. ten Dijke and G. Nilsson, J. Leuko. Biol. 67 (2000) 350.
- (3) P. Guptasarma, BioEssays 17 (1995) 987.
- (4) H. H. McAdams and A. Arkin, Trends Genet. 15 (1999) 65.
- (5) K. Matsumoto and I. Tsuda, J. Stat. Phys. 31 (1983) 87.
- (6) W. Horsthemke and R. Lefever, Noise-induced-transitions, ed. H. Haken (Springer, Heidelberg, 1984)
- (7) K. Wiesenfeld and F. Moss, Nature 373 (1995) 33.
- (8) Y. Togashi and K. Kaneko, Phys. Rev. Lett. 86 (2001) 2459.
- (9) Y. Togashi and K. Kaneko, J. Phys. Soc. Jpn. 72 (2003) 62.
- (10) B. Hess and A. S. Mikhailov, Science 264 (1994) 223; J. Theor. Biol 176 (1995) 181.
- (11) P. Stange, A. S. Mikhailov and B. Hess, J. Phys. Chem B 104 (2000) 1844.
- (12) N. M. Shnerb, Y. Louzoun, E. Bettelheim, and S. Solomon, Proc. Nat. Acad. Sci. 97 (2000) 10322.
- (13) Y. Togashi and K. Kaneko, Physica D 205 (2005) 87.
- (14) G. Marion, X. Mao, E. Renshaw and J. Liu, Phys. Rev. E 66 (2002) 051915
- (15) V. P. Zhdanov, Eur. Phys. J. B 29 (2002) 485.
- (16) S. A. Kauffman, The Origin of Order, Oxford Univ. Press. 1993.
- (17) K. Kaneko, Adv. Chem. Phys. 130 (2005) 543.
- (18) C. Furusawa and K. Kaneko, Phys. Rev. Lett. 90 (2003) 088102.
- (19) C. Furusawa, et. al., BIOPHYSICS, 1(2005) 25
- (20) G. Lahav, et. al., Nature Genetics. 36 (2004) 147.
- (21) Y. Togashi and K. Kaneko, J. Phys. Cond. Matt. 19 (2007) 065150.
- (22) R. Diestel, Graph Theory (Springer-Verlag New York)
- (23) U. Alon, MG. Surette, N. Barkai and S. Leibler, Nature 397 (1999) 6715.
- (24) E. Fisher and U. Sauer, J. Bio. Chem. 278 (2003) 46446.
- (25) G. Lahav, N. Rosenfeld, A. Sigal, N. Geva-Zatorsky, A. J. Levine, M. B. Elowitz and U. Alon, Nature Gene. 36 (2004) 147.
- (26) I. Mihalcescu, W. H. Hsing and S. Leibler, Nature 430 (2004) 81.
- (27) P. Guputasarma, BioEsseys 17 (1995) 987.
- (28) H. Jeong et al. Nature (London) 407 (2000) 651.
- (29) H. Jeong, M. P. Mason, and A-L. Barabasi, Nature (London) 411 (2001) 41.