A Comprehensive View of Circumstellar Disks in Chamaeleon I:
Infrared Excess, Accretion Signatures and Binarity
Abstract
We present a comprehensive study of disks around 81 young low-mass stars and brown dwarfs in the nearby 2 Myr-old Chamaeleon I star-forming region. We use mid-infrared photometry from the Spitzer Space Telescope, supplemented by findings from ground-based high-resolution optical spectroscopy and adaptive optics imaging. We derive disk fractions of and based on 8 m and 24 m colour excesses, respectively, consistent with those reported for other clusters of similar age. Within the uncertainties, the disk frequency in our sample of K3–M8 objects in Cha I does not depend on stellar mass. Diskless and disk-bearing objects have similar spatial distributions. There are no obvious transition disks in our sample, implying a rapid timescale for the inner disk clearing process; however, we find two objects with weak excess at 3–8 m and substantial excess at 24 m, which may indicate grain growth and dust settling in the inner disk. For a sub-sample of 35 objects with high-resolution spectra, we investigate the connection between accretion signatures and dusty disks: in the vast majority of cases (29/35) the two are well correlated, suggesting that, on average, the timescale for gas dissipation is similar to that for clearing the inner dust disk. The exceptions are six objects for which dust disks appear to persist even though accretion has ceased or dropped below measurable levels. Adaptive optics images of 65 of our targets reveal that 17 have companions at (projected) separations of 10–80 AU. Of the five AU binaries, four lack infrared excess, possibly indicating that a close companion leads to faster disk dispersal. The closest binary with excess is separated by AU, which sets an upper limit of AU for the outer disk radius. The overall disk frequency among stars with companions () is lower than (but still statistically consistent with) the value for the total sample.
1 Introduction
Circumstellar disks are a natural outcome of star formation and the potential birth sites of planets. Thus studies of disk evolution can provide useful constraints on both pre-main-sequence stellar evolution and planet formation timescales. Dusty disks may be identified most easily by their infrared emission. Observations in the mid-infrared are much more sensitive to disks than those in the near-infrared, since the stellar photospheric flux declines rapidly at longer wavelengths while the disk emission rises. The Spitzer Space Telescope, with its Infrared Array Camera (IRAC) and Multiband Imaging Photometer (MIPS) operating in the 3.6–160 m range, has greatly improved our ability to identify and study disks surrounding young stars (e.g., Hartmann et al., 2005; Sicilia-Aguilar et al., 2006; Lada et al., 2006). Processes of grain growth and dust settling to the midplane, along with the possible formation of planetesimals, are thought to occur in the inner disks. The consequent reduction of small dust grain abundance results in weak or absent near-infrared emission but the mid- to far-infrared disk emission remains strong, leading to the characteristic signature of “transition disks” (D’Alessio et al., 2005; Calvet et al., 2005; Muzerolle et al., 2006). The spectral energy distribution (SED) in 4–25 m wavelength range is thus ideal for probing dust in the inner disk.
Since gas constitutes most () of the disk mass and is essential for building giant planets, it is important to know whether gas and dust disperse on similar timescales. While it is difficult to detect the bulk of the disk gas directly, its presence can be inferred from signatures of accretion from the inner disk edge onto the central star. The most prominent signature of infalling gas is a broad, asymmetric and strong H emission line (Mohanty et al., 2005; Muzerolle et al., 2005; Jayawardhana et al., 2006). A comparison between accretion signatures and infrared emission can reveal whether the timescales for dust and gas dissipation are similar. Another important question related to planet formation is whether the presence of a binary companion has a considerable effect on disk evolution (Bouwman et al., 2006, and references therein).
Here we present a comprehensive study of disks surrounding 81 stars and brown dwarfs in the nearby ( pc; Whittet et al., 1997), young (2 Myr; Luhman, 2004, and references therein) Chamaeleon I cloud (abbreviated Cha I in the following), using S͡pitzer IRAC 4–8 m and MIPS 24 m data. We study the overall disk frequency as well as its possible dependence on stellar spectral type, and look for transition disk candidates. For 35 of the targets, for which high-resolution optical spectra are available (Nguyen et al., in prep.; Mohanty et al., 2005; Muzerolle et al., 2005), we investigate the connection between infrared excess and accretion signatures. For 65 objects –the largest such sample to date– the availability of adaptive optics images (Ahmic et al., in prep.) allows us to explore how multiplicity affects disk dissipation.
2 Spitzer Data and Photometry
We used publicly available images of the Cha I star-forming region from the IRAC and MIPS instruments aboard the Spitzer Space Telescope (GTO programs # 6 and 37, PI: G. Fazio). The IRAC images of the southern and northern cloud cores in Cha I at 3.6, 4.5, 5.8 and 8.0 m were obtained in June and July 2004 (AOR keys 3960320 and 3651328). The plate scale and the spatial resolution of IRAC are and , respectively (Fazio et al., 2004). For these programs, the Spitzer Science Center (SSC) pipeline (ver S14.0.0) provides two shallow (exp. time 20.8 s) maps for all of the four IRAC channels, each performed twice with an offset of a few arcseconds. These dual maps for the southern cloud have centers at , (J2000) for 3.6 and 5.8 m and at , (J2000) for 4.5 and 8.0 m. The northern cloud core maps have centers at , (J2000) for 3.6 and 5.8 m and at , (J2000) for 4.5 and 8.0 m. The dimensions of the maps are . In each of the four bands, BCD images for each of the shallow maps were taken through the post-BCD pipeline at the SSC, where the pointing refinement and mosaicing with standard MOPEX tool were performed. We used these archived final post-BCD shallow mosaics for IRAC photometric measurements in our analysis.
The observations of the northern and southern Cha I cloud cores using MIPS were taken in April 2004 and February 2005 (AOR keys 3661312 and 3962112). The relevant MIPS imaging band for the purpose of this analysis is the one centered at 24 m, since the sensitivity limits and background emission in MIPS channels at 70 m and 160 m do not allow detection of any but the brightest mid-infrared sources. The plate scale of the 24 m array is ; it has a spatial resolution of 6 (Rieke et al., 2004). The Cha I maps have a total size of about . The total effective exposure time per pointing at 24 m is about 80 s. After calibration and correction for distortion, images were combined into the final mosaics within the standard post-BCD SSC pipeline. We used these archived MIPS mosaics for 24 m flux measurements.
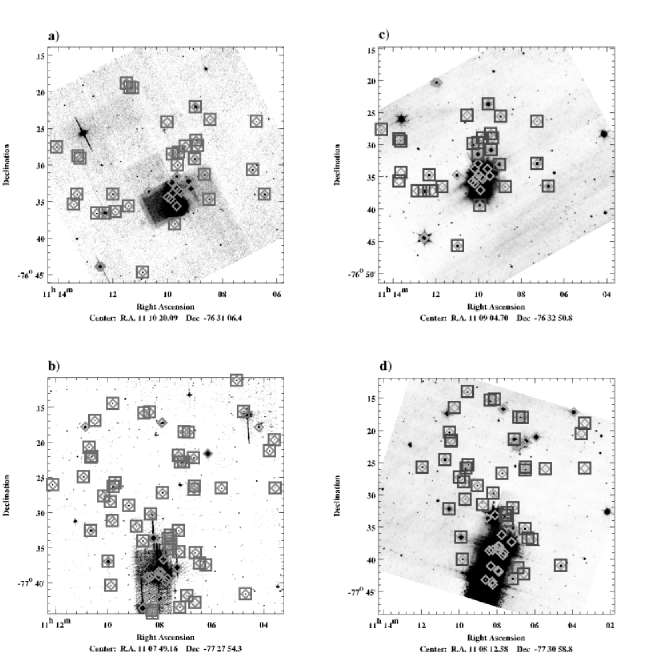
We considered the 157 Cha I members listed in Luhman (2004). These are mostly late-type stars with spectral classes in the range of K0–M8, including eight likely brown dwarfs with spectral types later than M6. More than 100 members of Cha I are found in the IRAC and MIPS images used in our analysis. Two small areas in the covered regions, one each for the northern and the southern field, are affected by localized extended emission associated with bright stars, overlapping PSF structures, as well as saturation effects (see Fig. 1). For objects in those areas, aperture photometry does not give reliable results. To be conservative, we excluded such objects from our analysis – 35 out of 116 in IRAC and 39 out of 126 in MIPS. We note that this excludes all stars brighter than K3. Our final list of targets contains 81 Cha I objects with spectral types that span from K3 to M8. Out of these, 69 have detectable fluxes in all four IRAC channels and in the MIPS 24 m band. Additional 18 objects with measured 24 m fluxes were not present in the IRAC field of view. IRAC 8 m and MIPS 24 m mosaics with all detected objects are presented in Fig. 1.
We performed photometry using the aperture photometry routine aper.pro in the IDLPHOT package. The IDLPHOT routines were integrated into a custom IDL program that uses the World Coordinate System information in the image headers to find the star within the image. The program then determines the centroid of the star and extracts the photometry. For IRAC data, we used a 5-pixel () aperture for each object, with a sky annulus extending from 5 to 10 pixels for sky flux measurements. We applied an aperture correction following the instructions given in the IRAC handbook, version 3.0. For eight Cha I brown dwarfs with IRAC fluxes previously published by Luhman et al. (2005), our photometry is consistent with theirs to within the errors. For MIPS 24 m images, we chose a aperture, with a sky annulus in the range of 7-13. In order to account for the aperture correction, we used values tabulated in the MIPS handbook, version 3.2.1. The final list of Cha I targets with their fluxes in units of mJy measured in the 3.6, 4.5, 5.8, 8 m and 24 m bands is given in Table I. The colour for all Cha I members listed in Table I is from the Two Micron All Sky Survey (2MASS) Point Source Catalog.
3 Disk Frequency
It is possible to distinguish between diskless (so-called Class III) and disk-harboring (Class II) stars using the IRAC colours, as suggested by Allen et al. (2004). The two classes of objects are indeed well separated in our IRAC colour-colour diagram (Fig. 2): diskless stars do not show colour excess in the IRAC channels and thus fall near the origin of the coordinate system, while those with disks are concentrated in a region demarcated by model colours and measured IRAC colours for objects in various other star-forming regions (Allen et al., 2004; Hartmann et al., 2005).
Another way to distinguish stars with disks from those without is to plot mid-infrared flux ratios against the colour, which is a reasonable proxy for the stellar photosphere. We do this in Fig. 3 for the 8 m to 4.5 m and 24 m to 4.5 m flux ratios. The presence of two populations of stars is evident. The population with lower flux ratios shows the infrared emission dominated by the stellar photospheres: these are comparable to the blackbody emission function with the temperature range that includes the effective temperatures of all Cha I members in our sample (dashed line in both panels of Fig. 3). Objects with the higher flux ratios are the ones likely to harbor circumstellar disks; dust emission from the surrounding disk contributes substantially to the infrared emission coming from these objects. Interestingly, there is a clear gap between diskless and disk-bearing stars in both panels, indicating a rapid transition between these two phases (see § 4 for further discussion).
Based on 8 m excess, the disk fraction among Cha I members included in our analysis is () while for objects detected at 24 m, it is ()111Cautious note: Since we excluded a significant fraction of the Cha I members located close to bright stars (see § 2), our disk frequencies may be biased.. Thus, the disk frequency we derive for Cha I is comparable to that found in the 2 Myr-old IC 348 cluster () from IRAC observations (Lada et al., 2006), but somewhat lower than the disk fraction reported for the 1 Myr-old Taurus star-forming region, based on 3.6 m excess measurements (Haish et al., 2001). On the older side, only of K+M stars in the 5 Myr-old Upper Scorpius OB association show disk excess at 8 m and 16 m (Carpenter et al., 2006). A similar steep decline in the frequencies of the low-mass stars with disks is also seen in the 8 Myr-old TW Hydrae association (Jayawardhana et al., 1999) and in the 10–12 Myr old NGC 7160 cluster (Sicilia-Aguilar et al., 2006).
There have been suggestions that the disk fraction among young stars depends on spectral type and stellar mass (Lada et al., 2006; Carpenter et al., 2006; Sicilia-Aguilar et al., 2006). However, in the case of Cha I, circumstellar disks appear to be distributed evenly among late-type ( K3) stars (Fig. 4). The fraction of disk-bearing stars in our sample ranges from for M0–M4 stars to for M4.25–M8 stars and for K3–K8 stars. These disk fractions are similar to that () reported by Luhman et al. (2005) for very low mass objects in this region. In order to consider a possible dependance on stellar mass, we can convert the effective temperatures of Cha I members in our sample (Luhman, 2004) to masses using the Baraffe et al. (1998) pre-main-sequence (PMS) evolutionary tracks for an age of Myr. We find that stars with masses M☉ have a disk fraction of while of those in the 0.3 M☉– M☉ range harbor dusty disks. Again, we do not find a significant mass-dependance in the disk frequency, for Cha I members with masses of 0.1–1.4 M☉. On the other hand, Lada et al. (2006) have found the highest percentage of circumstellar disks in the IC 348 cluster to be among K6–M2 stars (), which have masses comparable to the Sun, while the disk fraction for stars K6 is only . For Upper Scorpius, the highest disk fraction is for K and M stars with masses in the 0.1–1 M☉ range (Carpenter et al., 2006), although the peak value () is much lower than in the younger Cha I and IC 348 regions. Meanwhile, of G–M2 stars in Trumpler 37 (4 Myr) show infrared excess (Sicilia-Aguilar et al., 2006). In summary, the evidence to date suggests that primordial disks survive for 5 Myr around 20–50% of the stars with masses M☉, thus providing conditions for planet formation. The disk lifetime seems to be a function of object mass in some regions, but not in Cha I, thus it may also depend on the environment.
We also investigated whether there is a difference between the spatial distribution of diskless stars versus disk-bearing stars, especially in terms of their apparent distance from the two intermediate-mass stars in Cha I. The Herbig Ae/Be star HD 97048 is located in the lower cloud core, while the likely zero-age main sequence A star HD 97300 is in the upper cloud core. Figure 5 shows the positions of our targets along with those of the two early-type stars. There does not appear to be a difference between the spatial distributions of stars with 8 m excess and those without (filled and open circles in Fig. 5, respectively), outside of from HD 97300 in the upper cloud and from HD 97048 in the lower cloud core; at smaller distances contamination from the bright stars and cloud core emission prevent reliable flux measurements (see § 2). Average positions of the two types of objects in the lower and upper cloud regions, denoted as open pentagons for disk-bearing and open squares for diskless stars, might suggest that disk-bearing objects are slightly displaced towards the central region of Cha I. However, this displacement is too small to be statistically significant. Thus, we conclude that there is no evidence for intermediate mass stars influencing disk dissipation in low-mass stars in Cha I.
4 Transition Disks
Objects that exhibit fluxes at 3–8 m fully consistent with photospheric emission, but higher flux levels at longer wavelengths are thought to be caught in the process of inner disk clearing. These disks may have an optically thin inner region devoid of small dust grains, as in the case of CoKu Tau/4 in Taurus (D’Alessio et al., 2005). Theoretical models proposed to explain the clearing process include photoevaporation by ultraviolet radiation from the central star and grain growth related to planet formation processes (Muzerolle et al., 2006).
To identify transition disk candidates among Cha I members in our sample, we have searched for objects with no infrared colour excess at 3–8 m (i.e., lying under the dotted line in the upper panel of Fig. 3), but with excess flux at 24 m (i.e., lying above the dotted line in the lower panel of Fig. 3). We found two candidates: K8-type star T35 and M5-class star C7-1. We then plotted the infrared spectral energy distributions (SEDs) of these two objects, including near-infrared fluxes from the 2MASS Point Source Catalog, along with the SED of the disk-bearing star T46 (K8) for comparison (Fig. 6). All fluxes have been dereddened using given in Luhman (2004) and the reddening law of Mathis (1990). All three objects show excess above the expected photospheric emission at m (based on the STARdusty 2000 models of stellar atmospheres by Allard et al. 2000), but the excess is less pronounced in T35 and C7-1. Since small ( m), warm ( K) dust grains dominate emission in this wavelength region, the flatter SEDs of T35 and C7-1 may imply that their inner disks are undergoing grain growth and dust settling to the optically thick midplane (Scholz et al., 2007). However, their inner disks are not completely devoid of small grains, unlike the case in previously studied transition objects (e.g., D’Alessio et al., 2005; Muzerolle et al., 2006).
5 Connections with Accretion and Binarity
Our Cha I sample is ideally suited for investigating the effects of stellar properties and immediate environment on disk dissipation, because high-resolution optical spectra and high-angular resolution images are available for a substantial fraction of the targets. The optical spectra, obtained with MIKE on the Magellan/Clay 6.5 m telescope, include tracers of disk accretion for 35 objects (Nguyen et al., in prep.; Mohanty et al., 2005; Muzerolle et al., 2005). Adaptive optics (AO) imaging with NACO on the ESO Very Large Telescope has been carried out for 65 of our targets (Ahmic et al., in prep.).
5.1 Accretion
The strength of the H emission line is widely used as a signature of (gas) accretion from a disk onto the central star (e.g., Jayawardhana et al., 2006). In the spectra of accreting objects, the line is dominated by emission produced in the infalling gas, whereas in non-accretors the line is weaker because it comes only from chromospheric activity. Traditionally, young stars were classified as either classical T Tauri stars (CTTS) if the H equivalent width (EW) is Å or as weak-line T Tauri stars (WTTS) if the EW Å. But, since the EW depends on the spectral type, White & Basri (2003) proposed the full width of the line at 10 of the peak as a more robust accretion diagnostic. Based on empirical and physical arguments, Jayawardhana et al. (2003) adopted an H width of km s-1 as a dividing line between accretors and non-accretors, to be applicable to the very low mass regime as well. In fact, Natta et al. (2004) have found that the H correlates well with the mass accretion rate derived in other ways, and that the km s-1 threshold corresponds to the mass acretion rate M☉ yr-1.
To examine the connection between dusty inner disks and gas accretion, in Fig. 7 we show the 8 m excess versus H widths for those Cha I members for which both measurements are available. (The error bars on the H width refer to the standard deviations of the estimates over four epochs of observations.) Out of 35 objects in this sub-sample, 14 do not show evidence of accretion or dust emission (cf. lower left region in Fig. 7), implying that their inner disks have probably been cleared of both dust and gas. Of 21 objects with infrared excess, 15 appear to be accreting.222For two of the objects –CHX 18N and T35– the 8 m excess is relatively weak; the latter does have substantial excess at 24 m (see § 4) while for the former we could not measure it reliably due to background contamination. Thus, in the vast majority of cases (29/35) the signature of accretion is well correlated with evidence of a dusty disk. This finding suggests that, on average, the gas dissipation timescale is comparable to the timescale for clearing the inner disk of small dust grains.
However, six out of the 21 disk-bearing objects in this sub-sample lie below the accretion threshold (upper left part of Fig. 7). Five out of these six objects are in the low-mass regime, with the masses M☉ (see Table A Comprehensive View of Circumstellar Disks in Chamaeleon I: Infrared Excess, Accretion Signatures and Binarity). One possible explanation is that accretion rates have dropped below measurable levels even though dust disks persist in these cases. Another explanation is variable accretion: it may well be the case that quiescent phases dominate in the latest stages of accretion, so some objects with disks are observed during the non-accreting epochs (see Hartmann et al., 2005; Lada et al., 2006; Sicilia-Aguilar et al., 2006; Scholz et al., 2007).
5.2 Binarity
Theoretical models of the evolution of T Tauri disks in binary systems show that the individual circumstellar disks are truncated due to tidal effects. Once truncated, the two disks evolve independently, unless gap-clearing and circumbinary disk formation occur (Lubow & Artymowicz, 1996).
Of the Cha I members in our sample, 65 have also been imaged with AO on the ESO VLT (Ahmic et al., in prep.). Among them, there are 15 binaries and two triple systems. In Fig. 8, we show the 8/4.5 m flux ratio against projected binary separation for this sub-sample. Given the relatively poor angular resolution of IRAC and MIPS (§ 2), these multiple systems are unresolved in the Spitzer images; thus, we cannot determine which companion is responsible for the infrared excess. Nine of the binaries do not show infrared excess, while other six appear to harbor disks based on the 8/4.5 m flux ratio. Neither of the two triples shows mid-infrared excess.
The projected separations of the AO-resolved binaries range from AU to AU. Of the five binaries with AU separations, four –including the two closest pairs– exhibit low 8/4.5 m flux ratios typical for diskless objects. This implies that either the disks have dissipated completely or a large inner hole is carved out by the companion; in the latter scenario, the disk would be circumbinary and undetectable with the near- and mid-IR data used in our analysis. The closest pair with detectable disk excess –Hn 13– is separated by AU. Theoretical modeling suggests that tidally truncated disks would have outer radii between 0.3–0.4 times the physical separation between the two stars for binaries with mass ratios close to one (Papaloizou & Pringle, 1977). Thus, the disk(s) in the Hn 13 binary system would have an outer radius of AU: emission from dust within this radius may explain the excess at 8 and 24 m.
The two triple systems detected, CHXR 28 and T39, do not exhibit 8 m or 24 m excess. Their projected separations are 24, AU and , AU, respectively. Again, the lack of mid-infrared excess may indicate faster disk dissipation due to the presence of companions or growth of large inner holes.
In a recent study of the Myr old Chamaeleontis star cluster, Bouwman et al. (2006) reported that disks clear out more rapidly in binary systems with projected separations AU. Their analysis of 15 K- and M-type stars, using their own Spitzer observations and AO-imaging by Brandeker et al. (2006), shows that only one out of six binaries () retains a dusty disk while eight out of nine single stars () harbor disks. Thus, they concluded that circumstellar disks and binarity are anti-correlated. We also find that the disk excess fraction is lower among multple systems () than among (apparently) single stars () in Cha I, but the difference is less pronounced in this (younger) region. (The disk frequency for the total sample of 65 objects is , a value slightly higher than that for multiple systems.) If we consider only those binaries with AU separations, 4/5 do lack infrared excess. It may be that companions at (projected) distances AU do not have a strong effect on inner disk dissipation (at least not within Myr).
6 Summary
We have presented a comprehensive view on the disks around stars and brown dwarfs in the nearby, young Cha I dark cloud. In the following, we summarize our results:
-
1.
We used archival Spitzer data to measure mid-infrared fluxes in the wavelength range 3-24 m for 81 known members of the Cha I star forming region. Our sample shows a clear bimodality in their Spitzer colours (flux ratios 8/4.5 m and 24/4.5 m). For about half of the objects, the mid-infrared colours are consistent with purely photospheric emission, while the other half shows substantial mid-infrared colour excess, interpreted as emission from a dusty disk. In both colours, there is a clear gap between the two groups of objects.
-
2.
The overall disk frequency in our sample is based on the 8/4.5 m colour and based on the 24/4.5 m colour. This value is consistent with the disk fractions found in similarly aged regions like IC 348 and Taurus (Haish et al., 2001; Hartmann et al., 2005; Lada et al., 2006). In contrast, the stellar disk frequency in the somewhat older star forming region Upper Scorpius (age Myr) appears to be significantly lower (%, Carpenter et al. 2006).
-
3.
The disk fraction in our sample is, within the statistical uncertainties, not a function of spectral type: independent of the chosen binning, it ranges between 47% and 55% for spectral types between K3 and M8. This is in contrast to recent findings in other star forming regions, where the disk frequency has been found to change significantly in the same spectral range (Lada et al., 2006; Carpenter et al., 2006; Scholz et al., 2007). Environmental differences and mass-dependent disk evolution might be important aspects to explain these findings.
-
4.
There is no clear difference in the spatial distribution of stars with and without disks. The presence of bright stars in Cha I does not seem to have any effect on the spatial distribution of dusty disks at distances grater than few arcmin. Although average positions of stars with disks within the two Cha I cores are slightly displaced with respect to the average positions of disk-bearing stars, the difference is too small to be statistically important.
-
5.
In our sample, there are no definitive transition disks, i.e. objects without excess at 3–8 m, but significant excess at longer wavelengths. These transition disks are often discussed as objects caught in the process of inner disk clearing. However, we find two objects which have weak excess emission at 3–8 m (and no colour excess at these wavelengths), but substantial excess at 24 m. These objects may be potential pre-cursors to transition disks. This type of SED is best seen in the late-K type star T35, which shows a rising SED at 24 m.
-
6.
For 35 objects in our sample, we combined the Spitzer data with results from high-resolution optical spectroscopy. As a proxy for accretion, we use the H 10% width and adopt a threshold of 200 km s-1 between accretors and non-accretors. Among the vast majority (29/35), there is a correlation between accretion signatures and infrared excess, consistent with the idea that the dust clearing of the inner disk coincides with a cessation of the gas accretion. However, six of the non-accretors still show signs of an inner dust disk. Thus, in some cases young objects can retain their disks, after continuous accretion has stopped or at least dropped below measurable levels.
-
7.
We use the results from a Cha I imaging survey with high spatial resolution using the AO system NACO at ESO/VLT to investigate the impact of multiplicity on the disk properties. AO images have been obtained for 65 objects in our Spitzer sample, 17 of them have companions at separations between and , corresponding to (projected) physical separations of 10–800 AU. The disk frequency among the objects with companions () is lower than (but still consistent with) the value for the total sample, which might hint that the presence of a companion contributes to faster disk dispersal. However, the existence of six objects with disks and companions (at separations between 20–300 AU) suggests that the dispersion of the inner disk is not strongly affected by companions at AU. For the closest binary with disk, the companion sets an upper limit for the outer disk radius of AU. (Note that all multiple systems are unresolved in Spitzer images, implying that we cannot determine which component is responsible for the mid-infrared excesss.)
References
- Allard et al. (2000) Allard, F, Hauschildt, P. H., & Schwenke D. 2000, ApJ, 540, 1005
- Allen et al. (2004) Allen, L. E., Calvet, N., D’Alessio, P., et al. 2004, ApJS, 154, 363
- André et al. (2000) André, P., Ward-Thompson, D., & Barsony, M. 2000, in Mannings, v., Boss, A. P., & Russell, S. S., eds, Protostars and Planets IV, Tuscon: Univ. Arizona Press, p.59
- Baraffe et al. (1998) Baraffe, I., Chabrier, G., Allard, F., & Hauschildt, P. H. 1998, A&A, 337, 403B
- Bouwman et al. (2006) Bouwman, J., Lawson, A., Dominik, C., et al. 2006, ApJ, 653, L57
- Brandeker et al. (2006) Brandeker, A., Jayawardhana, R., Khavari, P., et al. 2006, ApJ, 652, 1572
- Calvet et al. (2005) Calvet, N., D’Alessio, P., Watson, P. D., et al. 2005, ApJ, 630, L185
- Carpenter et al. (2006) Carpenter, J. M., Mamajek, E. E., Hillenbrand, L. A., & Meyer, M .R. 2006, ApJ, 651, L49
- D’Alessio et al. (2005) D’Alessio, P., Hartmann, L., Calvet, N., et al. 2005, ApJ, 621, 461
- Fazio et al. (2004) Fazio, G. G., et al. 2004, ApJS, 154, 10
- Haish et al. (2001) Haish, H. E., Lada, E. A., & Lada, C. J. 2001, ApJ, 533, L153
- Hartmann et al. (2005) Hartmann, L., Megeath, S. T., Allen, L., et al. 2005, ApJ, 629, 881
- Jayawardhana et al. (1999) Jayawardhana, R., Hartmann, L., Fazio, G., et al. 1999, ApJ, 521, L129
- Jayawardhana et al. (2003) Jayawardhana, R., Mohanty, S., & Basri, G. 2003, ApJ, 592, 282
- Jayawardhana et al. (2006) Jayawardhana, R., Coffey, J. Scholz, A., et al. 2006, ApJ, 648, 1206
- Lada et al. (2006) Lada, C. J., Muench, A. A., Luhman, K. L., et al. 2006, ApJ, 131, 1574
- López Martí et al. (2004) López Martí, B., Eislöffel, J., Scholz, A., & Mundt, R. 2004, A&A, 416, 555
- Lubow & Artymowicz (1996) Lubow, S. H. & Artymowicz, P. 1996, in Wijers, R. A. M. J., Davies, M. B., & Tout, C. A., eds, Evolutionary Processes in Binary Stars. Kluwer Academic Publishers, p.53
- Luhman (2004) Luhman, K. L. 2004, ApJ, 602, 816
- Luhman et al. (2005) Luhman, K. L., D’Alessio, P., Calvet, N., et al. 2005, ApJ, 620, L516
- Mathis (1990) Mathis, J. S. 1990, ARA&A, 28, 37
- Mohanty et al. (2005) Mohanty, S., Jayawardhana, R., & Basri, G. 2005, ApJ, 626, 498
- Muzerolle et al. (2005) Muzerolle, J., Luhman, k. L., Briceño, C., et al. 2005, ApJ, 625, 906
- Muzerolle et al. (2006) Muzerolle, J., Adame, L., D’alessio, P., et al 2006, ApJ, 643, 1003
- Natta et al. (2004) Natta, A., Testi, L., Muzerille, J., et al. 2004, A&A, 424, 603
- Papaloizou & Pringle (1977) Papaloizou, J. & Pringle, J. E. 1997, MNRAS, 181, 441
- Rieke et al. (2004) Rieke, G. H., et al. 2004, ApJS, 154, 25
- Scholz et al. (2007) Scholz, A., Jayawardhana, R., Wood, K., et al. 2007, ApJ, 660, 1517
- Sicilia-Aguilar et al. (2006) Sicilia-Aguilar, A., Hartmann, L., Calvet, N. et al. 2006, ApJ, 638, 897
- White & Basri (2003) White, R. J., & Basri, G. 2003, ApJ, 582, 1109
- Whittet et al. (1997) Whittet, D. C. B., Prusti, T., Franco, G. A. P., et al. 1997, A&A, 327, 1194


| ID | SpTaa Luhman 2004 | J-Hbb 2MASS Point Source Catalog | 3.6 mcc IRAC data | 4.5 mcc IRAC data | 5.8 mcc IRAC data | 8 mcc IRAC data | 24 mdd MIPS data |
|---|---|---|---|---|---|---|---|
| (mag) | (mJy) | ||||||
| ISO 28 | M5.5 | 0.89 | 9.1 0.7 | 6.5 0.7 | 4.6 0.9 | 2.0 0.5 | 0.6ee upper limit |
| Hn 2 | M5 | 0.90 | 37 2 | 25 1 | 17 2 | 8.9 0.7 | 1.2 0.6 |
| CHXR 12 | M3.5 | 0.80 | 45 2 | 30 2 | 20 2 | 10.9 0.7 | 1.4 0.6 |
| ISO 52 | M4 | 0.81 | 29 1 | 24 1 | 17 2 | 18.4 0.9 | 40 4 |
| T16 | M3 | 1.21 | 26 1 | 21 1 | |||
| Hn 4 | M3.25 | 0.91 | 39 2 | 13.8 0.8 | |||
| CHXR 15 | M5.25 | 0.64 | 33 2 | 24 1 | 12 2 | 9.7 0.7 | 1.1 0.5 |
| Cam2-19 | M2.75 | 1.66 | 35 2 | 23 1 | 15 1 | 9.6 0.8 | 1.0 0.5 |
| CHXR 73 | M3.25 | 1.36 | 22 1 | 14.5 0.8 | 10 2 | 5.1 0.6 | 1.1 0.5 |
| Cha H 12 | M6.5 | 0.71 | 8.6 0.7 | 6.4 0.7 | 6 2 | 2.1 0.5 | 0.9ee upper limit |
| ISO 79 | M5.25 | 1.64 | 8.3 0.7 | 8.9 0.8 | 4 1 | 8.5 0.7 | 16 2 |
| Hn 5 | M4.5 | 0.84 | 63 2 | 66 2 | 71 2 | 94 2 | 77 5 |
| T22 | M3 | 1.03 | 65 2 | 42 2 | 32 2 | 16.3 0.9 | 1.9 0.7 |
| CHXR 20 | K6 | 0.99 | 113 2 | 86 2 | 81 3 | 109 2 | 99 6 |
| Ced 110-IRS 4 | 19 1 | 28 2 | 30 2 | 29 1 | |||
| CHXR 74 | M3 | 0.93 | 30 2 | 20 1 | 12 2 | 7.7 0.7 | 1.0 0.5 |
| T23 | M1.5 | 0.78 | 32 2 | 27 1 | 20 2 | 32 2 | 47 4 |
| Ced 110-IRS 6 | 197 3 | 314 4 | 356 4 | 394 4 | |||
| ISO 91 | M2.5 | 2.32 | 27 1 | 27 1 | 23 2 | 27 1 | 45 4 |
| CHSM 9484 | M5.25 | 0.76 | 5.6 0.6 | 2.7 0.5 | 3.0 0.6 | 1.2 0.6 | |
| T24 | M0.5 | 0.96 | 98 2 | 79 2 | 70 2 | 70 2 | 96 5 |
| CHXR 22E | M3.5 | 1.32 | 40 2 | 28 1 | 21 2 | 10.6 0.8 | 11 2 |
| ISO 97 | M1 | 42 2 | 51 2 | 57 2 | 64 2 | ||
| Cha H 1 | M7.75 | 0.67 | 6.7 0.7 | 5.8 0.7 | 4 2 | 8.2 0.7 | |
| Cha H 9 | M5.5 | 1.24 | 11.8 0.8 | 12.0 0.8 | 11 2 | 11.0 0.8 | 8 2 |
| B35 | M2 | 2.83 | 43 2 | 51 2 | 61 2 | 82 2 | 214 8 |
| CHXR 76 | M4.25 | 0.85 | 16.7 0.9 | 11.6 0.8 | 4 2 | 4.2 0.5 | 1.3 0.6 |
| CHXR 26 | M3.5 | 1.55 | 89 2 | 63 2 | 47 2 | 25 1 | 2.7 0.8 |
| Cha H 7 | M7.75 | 0.71 | 5.5 0.6 | 3.7 0.5 | 4 2 | 1.6 0.4 | |
| Cha H 2 | M5.25 | 0.97 | 30 1 | 26 1 | 20 2 | 24 1 | 21 3 |
| CHXR 28 | K6 | 1.16 | 290 4 | 186 3 | 130 3 | 70 2 | 7 2 |
| T34 | M3.75 | 0.86 | 34 2 | 23 1 | 16 2 | 8.3 0.8 | |
| Cha H 13 | M5.5 | 0.73 | 22 1 | 15.6 0.9 | 9 2 | 6.7 0.7 | |
| ISO 143 | M5 | 0.92 | 20 1 | 20 1 | 17 2 | 21 1 | 19 3 |
| ISO 147 | M5.75 | 0.83 | 5.0 0.7 | 4.8 0.6 | 5 1 | ||
| T35 | K8 | 1.27 | 100 2 | 45 2 | 101 6 | ||
| Cha H 6 | M5.75 | 0.78 | 19 1 | 15.9 0.9 | 11 2 | 12.3 0.8 | 12 2 |
| CHXR 33 | M0 | 0.90 | 67 2 | 45 2 | 36 2 | 17.9 0.9 | 1.8 0.7 |
| T37 | M5.25 | 0.73 | 15.1 0.8 | 13.1 0.9 | 11 2 | 11.1 0.7 | 9 2 |
| CHXR 78C | M5.25 | 0.76 | 13.4 0.8 | 10.2 0.8 | 6 2 | 4.0 0.6 | 1.2ee upper limit |
| ISO 165 | M5.5 | 1.00 | 13.8 0.9 | 13.4 0.9 | 13 2 | 9.4 0.7 | 9 2 |
| T39 | M2 | 0.78 | 124 3 | 80 2 | 53 2 | 29 1 | 3.3 0.9 |
| CHXR 35 | M4.75 | 0.64 | 17.6 0.9 | 12.3 0.8 | 8.0 0.9 | 4.3 0.5 | 1.2ee upper limit |
| CHXR 37 | K7 | 0.95 | 118 2 | 77 2 | 56 2 | 29 1 | 3.1 0.9 |
| CHXR 79 | M1.25 | 1.54 | 191 3 | 191 3 | 163 3 | 161 3 | 230 9 |
| T40 | K6 | 1.23 | 406 4 | 424 4 | 370 4 | 366 4 | 272 10 |
| CHXR 40 | M1.25 | 0.84 | 87 2 | 55 2 | 39 2 | 21 1 | 2.2 0.8 |
| C7-1 | M5 | 1.15 | 43 2 | 35 2 | 24 2 | 18.1 0.9 | 13 2 |
| B43 | M3.25 | 1.54 | 67 2 | 69 2 | 53 2 | 49 2 | 123 6 |
| ISO 209 | M1 | 2.0 | 7.8 0.7 | 7.3 0.7 | 8 2 | ||
| KG 102 | M5.5 | 0.83 | 10.0 0.7 | 7.7 0.7 | 6 2 | 2.3 0.5 | 1.2ee upper limit |
| ISO 217 | M6.25 | 0.99 | 15.3 0.8 | 14.9 0.9 | 13 2 | 13.5 0.8 | 12 2 |
| CHSM 15991 | M3 | 1.17 | 4.0 0.6 | 5.9 0.7 | 5 2 | 7.5 0.7 | 8 2 |
| ISO 220 | M5.75 | 1.28 | 7.5 0.7 | 7.4 0.7 | 5 1 | 6.4 0.7 | 7 2 |
| T43 | M2 | 1.29 | 109 2 | 103 2 | 107 3 | 121 3 | 185 8 |
| ISO 225 | M1.75 | 1.25 | 9.0 0.7 | 12.0 0.8 | 21 2 | 22 1 | 68 5 |
| T45 | K8 | 1.07 | 458 5 | 446 4 | 393 4 | 390 4 | 303 11 |
| T46 | K8 | 0.95 | 235 3 | 218 3 | 218 3 | 255 3 | 236 9 |
| ISO 235 | M5.5 | 1.45 | 18.9 0.9 | 17.1 0.9 | 19 2 | 17.7 0.9 | 16 2 |
| CHSM 17173 | M8 | 0.63 | 4.3 0.6 | 3.2 0.6 | 7 1 | 1.4 0.5 | 0.6ee upper limit |
| Hn 12W | M5.5 | 0.62 | 14.8 0.9 | 5.5 0.6 | 1.2ee upper limit | ||
| 2MASS 11103481-7722053 | M4 | 1.32 | 40 2 | 30 2 | 23 2 | 11.3 0.8 | 1.4 0.6 |
| ISO 250 | M4.75 | 1.36 | 26 1 | 20 1 | 13 2 | 5.9 0.7 | 1.0 0.5 |
| CHXR 47 | K3 | 1.05 | 241 3 | 201 3 | 193 3 | 199 3 | 227 9 |
| ISO 252 | M6 | 0.97 | 7.0 0.7 | 7.0 0.7 | 5 2 | 7.8 0.7 | 9 2 |
| ISO 256 | M4.5 | 1.76 | 45 2 | 48 2 | 42 2 | 50 2 | 66 5 |
| Hn 13 | M5.75 | 0.74 | 56 2 | 50 2 | 48 2 | 45 2 | 54 4 |
| CHXR 48 | M2.5 | 0.78 | 45 2 | 29 1 | 19 2 | 11.1 0.7 | 1.3 0.6 |
| T49 | M2 | 0.96 | 120 3 | 117 2 | |||
| CHX 18N | K6 | 0.83 | 358 4 | 196 3 | |||
| CHNR 49NE | M0 | 0.67 | 49 2 | 18.8 0.9 | |||
| CHXR 84 | M5.5 | 0.66 | 19 1 | 14.8 0.8 | 12 2 | 5.5 0.6 | 1.2ee upper limit |
| ISO 282 | M4.75 | 1.04 | 13.2 0.8 | 12.2 0.8 | 10 2 | 9.3 0.7 | 9 2 |
| T50 | M5 | 0.78 | 52 2 | 44 2 | 35 2 | 39 2 | 50 4 |
| T51 | K3.5 | 0.75 | 377 4 | 367 4 | 344 4 | 487 5 | 242 9 |
| CHXR 55 | K4.5 | 0.66 | 60 2 | 38 2 | 24 2 | 14.0 0.8 | 1.8 0.7 |
| Hn 18 | M3.5 | 0.75 | 27 1 | 24 1 | 20 2 | 19.1 0.9 | 24 3 |
| CHXR 59 | M2.75 | 0.74 | 46 2 | 31 1 | 19 2 | 11.6 0.7 | 1.2 0.6 |
| CHXR 60 | M4.25 | 0.71 | 22 1 | 17.1 0.9 | 11 2 | 5.4 0.5 | 1.2ee upper limit |
| T55 | M4.5 | 0.60 | 20 1 | 12.8 0.9 | 13 2 | 4.5 0.6 | 1.2ee upper limit |
| CHXR 62 | M3.75 | 0.82 | 33 2 | 23 1 | 15 2 | 9.3 0.7 | 1.4 0.6 |
| ID | SpT | H 10% width | Reference | Multiplicity | Projected separation |
|---|---|---|---|---|---|
| (km s-1) | (AU) | ||||
| CHXR 12 | M3.5 | 110 20 | 1 | single | |
| ISO 52 | M4 | 107 8 | 1 | single | |
| Cha H 12 | M6.5 | 107 | 2 | single | |
| Hn 5 | M4.5 | 340 20 | 1 | single | |
| CHXR 20 | K6 | 70 30 | 1 | single | |
| CHXR 74 | M3 | 100 20 | 1 | single | |
| T23 | M1.5 | 247 | 2 | single | |
| T24 | M0.5 | 430 50 | 1 | single | |
| Cha H 1 | M7.75 | 151 | 2 | single | |
| Cha H 9 | M5.5 | 91 | 2 | single | |
| CHXR 76 | M4.25 | 88 7 | 1 | single | |
| Cha H 7 | M7.75 | 114 | 2 | single | |
| Cha H 2 | M5.25 | 317 | 2 | binary | |
| T34 | M3.75 | 90 20 | 1 | single | |
| Cha H 13 | M5.5 | 122 | 1 | single | |
| T35 | K8 | 450 30 | 1 | single | |
| Cha H 6 | M5.75 | 282 | 1 | single | |
| CHXR 33 | M0 | 129 2 | 1 | single | |
| CHXR 37 | K7 | 140 30 | 1 | binary | |
| T40 | K6 | 350 40 | 1 | single | |
| CHXR 40 | M1.25 | 130 20 | 1 | binary | |
| ISO 217 | M6.25 | 334 | 2 | single | |
| T43 | M2 | 170 80 | 1 | single | |
| T45 | K8 | 620 30 | 1 | binary | |
| T46 | K8 | 320 60 | 1 | single | |
| ISO 252 | M6 | 274 | 2 | single | |
| CHXR 48 | M2.5 | 110 10 | 1 | single | |
| T49 | M2 | 280 30 | 1 | single | |
| CHX 18N | K6 | 400 40 | 1 | single | |
| T50 | M5 | 250 60 | 1 | single | |
| T51 | K3.5 | 240 30 | 1 | single | |
| Hn 18 | M3.5 | 120 40 | 1 | single | |
| CHXR 59 | M2.75 | 130 20 | 1 | binary | |
| CHXR 60 | M4.25 | 100 20 | 1 | single | |
| CHXR 62 | M3.75 | 140 20 | 1 | binary |