Narrow-line Seyfert 1 Galaxies and the Relation
Abstract
We have studied the location of narrow-line Seyfert 1 (NLS1) galaxies and broad-line Seyfert 1 (BLS1) galaxies on the relation of non-active galaxies. We find that NLS1 galaxies as a class – as well as the BLS1 galaxies of our comparison sample – do follow the relation of non-active galaxies if we use the width of the [SII]6716,6731 emission lines as surrogate for stellar velocity dispersion, . We also find that the width of [OIII]5007 is a good surrogate for , but only after (a) removal of asymmetric blue wings, and, more important, after (b) excluding core [OIII] lines with strong blueshifts (i.e., excluding galaxies which have their [OIII] velocity fields dominated by radial motions, presumably outflows). The same galaxies which are extreme outliers in [OIII] still follow the relation in [SII]. We confirm previous findings that NLS1 galaxies are systematically off-set from the relation if the full [OIII] profile is used to measure . We systematically investigate the influence of several parameters on the NSL1 galaxies’ location on the plane: [OIII]core blueshift, , intensity ratio FeII/H, NLR density, and absolute magnitude. Implications for NLS1 models and for their evolution along the relation are discussed.
1 Introduction
Correlations between the properties of galaxies and the masses of their central black holes are of fundamental importance for our understanding of galaxy formation and evolution. The relations between black hole mass and bulge stellar velocity dispersion, , (Ferrarese & Merritt 2000, Gebhardt et al. 2000, Merritt & Ferrarese 2001) and between black hole mass and bulge mass (Marconi & Hunt 2003, Häring & Rix 2004) imply a close link between black hole and bulge formation and growth (e.g., Haehnelt & Kauffmann 2000).
Mathur et al. (2001) emphasized the importance of studying the locus of NLS1 galaxies on the plane. NLS1s are a subclass of Active Galactic Nuclei (AGN) characterized by small widths of their broad Balmer lines (e.g., Veron-Cetty et al. 2001). They are believed to have low-mass black holes (BHs) accreting close to the Eddington limit (e.g., Boroson 2002). As such, they are an ’extreme’ class of AGN in the local universe, potentially holding important clues as to the origin of the relation (see Sect. 1 of Li et al. 2006 for a review on models), and whether it holds at all times and for all types of galaxies, and at low BH masses.
However, previous studies of NLS1 galaxies, employing different samples and methods, led to partially conflicting results regarding the galaxies’ location on the relation. When using the width of the narrow [OIII]5007 emission line, FWHM[OIII], as replacement for stellar velocity dispersion , most authors found that, on average, NLS1 galaxies are off the relation (Mathur et al. 2001, Grupe & Mathur 2004, Mathur & Grupe 2005a,b, Bian et al. 2006, Watson et al. 2007), while in the study of Wang & Lu (2001) most NLS1s are, on average, on the relation (with a significant scatter in all cases). Furthermore, NLS1 galaxies were found to be off (Wandel 2002, Ryan et al. 2007) or on (Botte et al. 2004) the black-hole-mass – bulge-luminosity, , relation; and on (Botte et al. 2005, Barth et al. 2005) or off (Zhou et al. 2006) the relation. Most larger samples are actually based on FWHM[OIII]/2.35 as surrogate for (Nelson 2000), because the bulge velocity dispersion is very difficult to measure in NLS1 galaxies due to superposed emission-line complexes.
Given the potentially far-reaching consequences of a deviation of low BH mass, highly accreting AGN from the relation, independent studies of large(r) samples of NLS1 galaxies are important. No matter whether they turn out to be on or off the relation of non-active galaxies and BLS1 galaxies, any result has important consequences: if NLS1s lie off the relation, for the formation of the relation (how do objects move onto the relation ?) and/or the gaseous kinematics of their NLRs. If they lie on the relation the question is raised how to preserve along the relation in objects which are rapidly growing their BHs but are typically in non-merging galaxies (Krongold et al. 2001).
We have used an independent, large, homogeneously analyzed sample of NLS1 galaxies (55 objects) plus a comparison sample of BLS1 galaxies (39 objects), in order to study their locus on the plane. We conclude that the width of the [SII] emission line, and of the narrow core of the [OIII] line (but only after removal of [OIII] lines with high blueshifts), are the best available surrogates for stellar velocity dispersion . Using these lines puts NLS1 galaxies (and BLS1 galaxies), as a class, on the relation of non-active galaxies. Throughout this paper, we use a cosmology with =70 km s-1 Mpc-1, =0.3 and =0.7.
2 Sample selection and data analysis
We use the sample of NLS1 and BLS1 galaxies of Xu et al. (2007). Sample selection, data preparation, and data analysis methods are described in detail in that work. In brief: the sample consists of NLS1 galaxies from the catalogue of Veron-Cetty & Veron (2003), plus a comparison sample of BLS1 galaxies from Boroson (2003) at , which have detectable (S/N5) [SII] emission in their Sloan Digital Sky Survey (SDSS) DR3 (Abazajian et al. 2005) spectra. The galaxies of the two samples have similar redshift and absolute magnitude distributions. Xu et al. (2007) corrected the SDSS spectra for Galactic extinction, decomposed the continuum into stellar and AGN components, and then subtracted the stellar continuum contribution and the FeII complexes from the spectra. Emission lines were fit with Gaussian profiles.
Special attention was paid to [OIII] profile shapes. The deviation of [OIII] profiles from single Gaussians is well known, and NLS1 galaxies show strong blue wings particularly often (Boroson 2005 and ref. therein). Authors who previously used from NLS1 galaxies were aware of this complication, and most of them did correct for it. In most cases they did so by using only the ‘red’ half of the [OIII] line profile to measure the FWHM. Wang & Lu (2001) decomposed the [OIII] profiles into core and wing. We followed two approaches in measuring FWHM[OIII]: (a) determination of the total FWHM of the summed two-component Gaussian from a careful decomposition into a core and a blue wing component whenever present, FWHM; and (b) the FWHM of the core component of [OIII], FWHM. Emission lines other than [OIII] are well represented by a single Gaussian. The lines [SII]6716,6731 (hereafter referred to as [SII]) were both fit with the same width. We follow the standard procedure of using the radius()-luminosity() relation of BLS1 galaxies (which appears to hold for NLS1 galaxies; Peterson et al. 2000) to compute BH masses, following Kaspi et al. (2005). We then compare our results with the relation of Tremaine et al. (2002; their eqn. 1 and 19) and of Ferrarese & Ford (2005, FF05 hereafter; their eqn. 20). An error in black hole mass of 0.5 dex (as in Grupe & Mathur 2004) was conservatively assumed. Formal measurement errors in FWHM are typically 5-20%.
We note that all SDSS observations of our sample include emission from the entire NLR (so we are not systematically excluding the outer parts of the NLR in the nearest objects). At the lowest redshift in our sample, =0.034, an SDSS fiber diameter of 3′′ corresponds to 2 kpc, larger than typical NLRs.
3 Results
We investigated how the following factors affect the galaxies’ location on the plane: (a) different methods of fitting the [OIII] profile; (b) the use of other emission lines as surrogates for ; and (c) the influence of other parameters, like [OIII] blueshift and .
3.1 NLS1 galaxies on the plane
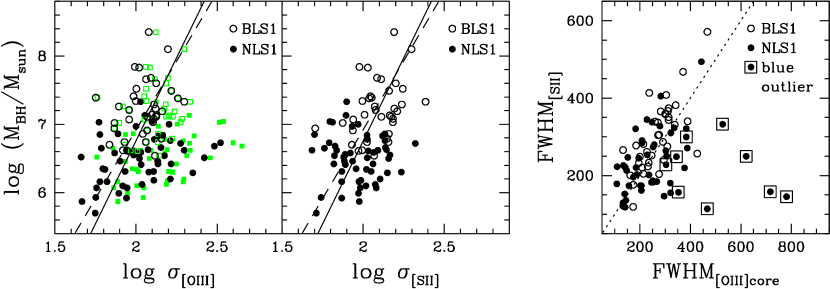
First, we confirm that NLS1 galaxies as a class deviate from the relation of non-active galaxies if we use the full profile of [OIII] to measure (Fig. 1). We computed the deviation of the NLS1 and BLS1 galaxies from the FF05 relation. Applying a Kolmogorov-Smirnov (K-S) test shows that the two samples are drawn from different parent distributions (K-S probability of being drawn from the same population: 0.002). NLS1 galaxies follow the relation much better if only the narrow core of [OIII] is used to measure (Fig. 1). However, there are still a number of NLS1 galaxies with very broad [OIII] profiles and these lie systematically below the relation. In Sect. 3.3 we identify the cause of this. We show that the majority of these ‘[OIII] outliers’ are characterized by high NLR outflow velocities, and therefore, their velocity fields are not dominated by the bulge potential and their line widths cannot be used as surrogates for .
3.2 Widths of other NLR lines as surrogate for
The strongest (high-ionization) emission line in AGN spectra is [OIII]5007, which is commonly used for estimates. Because of its strength, we are able to decompose the line into a core and blue wing. Low-ionization emission lines generally do not show this spectral complexity, and we therefore also consider using their widths as surrogates for . The strongest lines in the commonly available wavelength range between Å are [NII]6584,6548, [SII] and [OI]6300. [NII] is, however, blended with H except in high-resolution spectra (see Zhou et al. 2006 for the use of as a surrogate for ). We focus on [SII] here, which is detected in all galaxies of our sample. As shown by Greene & Ho (2005), is indeed a good substitute for in Seyfert 2 galaxies.
Using the width of [SII] as a surrogate for , NLS1 galaxies as a class are now on the relation (Fig. 1). Repeating the K-S test on the distribution of NLS1 and BLS1 galaxies (Fig. 3) shows that the two samples are consistent with being drawn from the same parent distribution (K-S probability of 0.4). We note that the FWHMs of [SII] and [OIII]core correlate well with each other (after removal of ‘blue outliers’; Sect. 3.3), demonstrating that both emission lines trace similar NLR velocity fields (Fig. 1). Only 40% of the NLS1 galaxies of our sample have [OI] detected. The scatter in is relatively small and most galaxies are close to the FF05 relation, except two outliers with large .
3.3 Influence of several parameters on the galaxies’ location on the plane
We investigated the influence of several quantities – [OIII]core blueshift, , intensity ratio FeII4570/H, NLR density, and absolute magnitude – on the galaxies’ location on the plane. We divided each of these parameters into 3 bins: low values, intermediate values, and high values, such that about equal numbers of NLS1 galaxies fell in each bin. We measured the velocity shift of [OIII]core, , relative to [SII] (we use positive velocity values for blueshifts). was derived from the black hole mass, according to MBH/M⊙ erg/s. The bolometric luminosity was estimated from the luminosity at 5100Å, , and a bolometric correction of . The NLR density was derived from the density-sensitive [SII] intensity ratio, [SII]6716/[SII]6731 (Xu et al. 2007), and the absolute magnitude from the SDSS i-band magnitude. Our aim is to search for trends across the plane in order to see whether we can identify physical mechanisms that determine an object’s location on the plane, and, in particular, that are responsible for the [OIII] outliers.
First, we find that almost all outliers in actually show a very high blueshift of [OIII]core with a velocity shift 150 km s-1 [hereafter referred to as ‘blue outliers’ (Zamanov et al. 2002); marked in Fig. 2]. More generally, we find the trend across the plane that [OIII] lines of higher also show higher outflow velocity, revealing the presence of an extra radial velocity field presumably due to outflows. Among the galaxies with positive (those below the FF05 relation) 49% are in the highest-velocity bin, while only 26% are in the lowest bin. However, if we exclude all galaxies with in the highest bin (75 km s-1), NLS1 and BLS1 galaxies show similar scatter and agree with the relation of normal galaxies (Fig. 3; the K-S test shows that the two samples are not statistically distinguishable with K-S probability 0.5). We have checked that [SII] is not systematically influenced by the outflow components that appear in [OIII]core. NLS1 galaxies with blue outliers in [OIII]core are uniformly distributed across the plane in [SII].
In order to see whether other parameters affect an object’s location on the plane (Fig. 2), we first removed all objects with the highest [OIII] outflow velocities ( km/s), and then studied the correlation of each parameter with the object’s deviation from the FF05 relation, measured in terms of . We cannot identify a strong dependence of on (Spearman rank correlation coefficient =0.10)111Note that this does not imply an inconsistency with Mathur & Grupe (2005a,b), since their (soft X-ray selected) sample includes a significant number of NLS1 galaxies with very high , above the highest value in our sample., FeII4570/H (=0.05), and density (=0.01). However, if we keep all objects with high blueshifts, and are correlated (=0.34). Galaxies with higher absolute magnitudes Mi are, on average, located at higher BH masses, as expected, but there is no systematic trend horizontally across the plane.
4 Discussion and conclusions
We confirm the well-known result (e.g., Grupe 2004) that NLS1 galaxies have, on average, lower BH masses than BLS1 galaxies (in our sample, masses range between M⊙, while M⊙). We further confirm that NLS1s are off the relation when [OIII]totl is used as surrogate for , and that – after removing blue wings – [OIII]core gives more consistent results. However, after correction for blue wings several blue outliers still stick out with very large values. If these were to reach the relation moving vertically on the plane by growing their black holes, they would have to increase their current BH masses by factors 100, and become more massive than the most massive BHs in the BLS1 comparison sample. Instead, the fact that all show high outflow velocities in [OIII]core demonstrates that the properties of the NLR (unusual outflows in the high-ionization NLR) drive the deviation of these NLS1 galaxies from the relation. Those galaxies which are extreme outliers in [OIII] still follow the relation in [SII].
There is good evidence that many NLS1 galaxies are accreting at a high rate relative to the Eddington rate (even if not as high as in high-redshift quasars; Warner et al. 2004), so, as emphasized by Mathur & Grupe (2005a,b) their BHs must be rapidly growing. Since we find that they are on the relation now, their tracks on the plane must be diagonal, else they would deviate in the future. We distinguish two possibilities: (1) NLS1 galaxies as a class evolve into BLS1 galaxies with respect to their BH mass distribution. Then, on average, the BHs of NLS1 galaxies have to grow by a factor 10. If accreting at =1.0 this would take them 108 years. If they did so, a corresponding change in of the bulge of the host galaxy is required in order to ensure that the relation still holds. Recent host galaxy studies of NLS1s indicate that they are not preferentially merging systems (Krongold et al. 2001, Ryan et al. 2007), but have a relatively high bar fraction (Crenshaw et al. 2003, Ohta et al. 2007). In that case, some secular mechanism must be at work to adjust the bulge properties. At this stage, we can only speculate that some of the feedback mechanisms (Silk & Rees 1998) studied in the context of merger-induced BH fuelling (e.g., di Matteo et al. 2005, King 2005) also hold for bar-induced fuelling. Alternatively, (2) the NLS1 mass distribution does not evolve into the BLS1 mass distribution. In this picture, NLS1s are simply low-mass extensions of the BLS1 phenomenon (e.g., McHardy et al. 2006). In that case, the high values could just represent a relatively short-lived accretion phase which would only insignificantly grow their BHs. Then, within the large scatter of , no adjustment of the host’s bulge would be needed. Sources with relatively low could be before or after an accretion event.
In summary, we conclude that the NLS1 and BLS1 galaxies of our sample, as a class, follow the relation if we use as surrogate for the widths of emission lines which are not strongly affected by outflow components ([SII]; or [OIII]core after removing galaxies with high outflow velocities ). Further studies of the evolution of highly accreting AGN along the relation will shed new light on the evolution of galaxies in general and NLS1s in particular.
References
- Abazajian et al. (05) Abazajian, K., et al. 2005, AJ, 129, 1755
- Barth et al. (05) Barth, A.J., Greene, J.E., & Ho, L.C. 2005, ApJ, 619, L151
- (3) Bian, W., Yuan, Q., & Zhao, Y., 2006, MNRAS, 367, 860
- Boroson (2002) Boroson, T.A. 2002, ApJ, 565, 78
- Boroson (2003) Boroson, T.A. 2003, ApJ, 585, 647
- Boroson (2005) Boroson, T.A. 2005, ApJ, 130, 381
- Botte et al. (04) Botte, V., et al. 2004, , AJ, 127, 3168
- Botte et al. (05) Botte, V., et al. 2005, MNRAS, 356, 789
- Crenshaw et al. (03) Crenshaw, D.M., Kraemer, S.B., & Gabel, J.R. 2003, AJ, 126, 1690
- di Matteo et al. (2005) di Matteo, T., Springel, V., & Hernquist, L. 2005, Nature, 433, 604
- Ferrarese and Ford (2005) Ferrarese, L., & Ford, H. 2005, Space Science Reviews, 116, 523
- Ferrarese and Merritt (2000) Ferrarese, L., & Merritt, D. 2000, ApJ, 539, L9
- Gebhardt et al. (00) Gebhardt, K., et al. 2000, ApJ, 539, L13
- Greene and Ho (2005) Greene, J.E., & Ho, L.C. 2005, ApJ, 627, 721
- Grupe (04) Grupe, D., 2004 AJ, 127, 1799
- Grupe et al (04) Grupe, D., & Mathur, S., 2004 ApJ, 606, L41
- (17) Haehnelt, M., & Kauffmann, G., 2000 MNRAS, 318, L35
- Haering and Rix (04) Häring, N., Rix, H.-W. 2004, ApJ, 604, L89
- Kaspi et al. (2005) Kaspi, S., et al. 2005, ApJ, 629, 61
- King (2005) King, A., 2005 ApJ, 635, L121
- Krongold et al. (01) Krongold, Y., Dultzin-Hacyan, D., & Marziani, P. 2001, AJ, 121, 702
- Li et al. (06) Li, Y., Haiman Z., & MacLow, M.-M. 2006, astro-ph/0607444
- Marconi and Hunt (03) Marconi, A., & Hunt, L.K. 2003, ApJ, 589, L21
- Mathur et al. (2001) Mathur, S., Kuraszkiewicz, J., & Czerny, B. 2001, NewA, 6, 321
- (25) Mathur, S., & Grupe, D. 2005a, ApJ, 633, 688
- (26) Mathur, S., & Grupe, D. 2005b, A&A, 432, 463
- McHardy et al. (2006) McHardy, I.M., et al. 2006, Nature, 444, 730
- Merritt and Ferrarese (2000) Merritt, D., & Ferrarese, L. 2001, ApJ, 547, 140
- Nelson (2000) Nelson, C.H. 2000, ApJ, 544, L91
- Ohta et al. (2007) Ohta, Y., et al. 2007, ApJS, 169, 10
- Peterson (00) Peterson, B.M., et al. 2000, ApJ, 542, 161
- Ryan et al. (2007) Ryan, C.J., et al. 2007, ApJ, 654, 799
- (33) Silk, J., & Rees, M. 1998, A&A, 331, L1
- Tremaine et al. (2002) Tremaine, S., et al. 2002, ApJ, 574, 740
- (35) Veron-Cetty, M.P., et al. 2001, A&A, 372, 730
- Veron-catalogue (2003) Veron-Cetty, M.P., & Veron, P. 2003, A&A, 412, 399
- Wandel (2002) Wandel, A. 2002, ApJ, 565, 762
- Wang and Lu (01) Wang T., & Lu Y. 2001, A&A, 377, 52
- Warner (04) Warner, C., Hamann, F., & Dietrich, M. 2004, ApJ, 608, 136
- Watson et al. (07) Watson L., Mathur S., & Grupe D. 2007, AJ, 133, 2435
- (41) Xu, D., Komossa, S., Zhou, H., Wang, T., & Wei, J. 2007, ApJ, in press; [arXiv:0706.2574 at astro-ph]
- Zamanov et al. (2004) Zamanov, R., et al. 2002, ApJ, 576, L9
- Zhou et al. (06) Zhou, H.-Y., et al. 2006, ApJS, 166, 128