SDSS J150722.30+523039.8: a CV formed directly from a detached white dwarf/brown dwarf binary?
)
Abstract
We present high-speed, three-colour photometry of the eclipsing cataclysmic variable SDSS J150722.30+523039.8 (hereafter SDSS J1507). This system has an orbital period of 66.61 minutes, placing it below the observed “period minimum” for cataclysmic variables. We determine the system parameters via a parameterised model of the eclipse fitted to the observed lightcurve by minimisation. We obtain a mass ratio of and an orbital inclination . The primary mass is . The secondary mass and radius are found to be and respectively. We find a distance to the system of pc. The secondary star in SDSS J1507 has a mass substantially below the hydrogen burning limit, making it the second confirmed sub-stellar donor in a cataclysmic variable.
The very short orbital period of SDSS J1507 is readily explained if the secondary star is nuclearly evolved, or if SDSS J1507 formed directly from a detached white dwarf/brown dwarf binary. Given the lack of any visible contribution from the secondary star, the very low secondary mass and the low He I /H emission line ratio, we argue that SDSS J1507 probably formed directly from a detached white dwarf/brown dwarf binary. If confirmed, SDSS J1507 will be the first such system identified. The implications for binary star evolution, the brown-dwarf desert and the common envelope phase are discussed.
keywords:
binaries: close - binaries: eclipsing - stars: dwarf novae - stars: individual: SDSSJ1507+5230 - novae, cataclysmic variables1 Introduction
Cataclysmic variable stars (CVs) are a class of interacting binary system undergoing mass transfer, usually via a gas stream and accretion disc, from a Roche-lobe filling secondary to a white dwarf primary. A bright spot is formed at the intersection of the disc and gas stream, giving rise to an ‘orbital hump’ in the lightcurve at phases due to foreshortening of the bright-spot. Warner (1995) gives a comprehensive review of CVs. The lightcurves of eclipsing CVs can be quite complex, with the accretion disc, white dwarf and bright-spot all being eclipsed in rapid succession. With sufficient time-resolution, however, this eclipse structure allows the system parameters to be determined to a high degree of precision (Wood et al., 1986).
SDSS J1507 was discovered as part of the systematic effort to catalog and characterise the CVs found by the Sloan Digital Sky Survey (Szkody et al., 2005). Its spectrum shows a strong blue continuum and absorption lines from the white dwarf, as well as the broad, double-peaked emission lines from the accretion disc, which are characteristic of high inclination systems (Horne & Marsh, 1986). Follow up photometry of SDSS J1507 (Szkody et al., 2005) showed deep eclipses, and an orbital period of minutes. The orbital period of SDSS J1507 places it below the period minimum, a sharp cut-off in the number of CVs at mins. Whilst there are objects related to CVs with orbital periods of less than 78 minutes, known as AM CVn stars, they are believed to contain a white dwarf and a degenerate helium white dwarf or a semi-degenerate helium secondary star (Nelemans et al., 2001). Only two other CVs exist with orbital periods below the period minimum, V485 Cen (Augusteijn et al., 1996) and EI Psc (Thorstensen et al., 2002). Possible explanations for the presence of CVs below the period minimum include a donor which has undergone significant nuclear evolution in its core prior to mass transfer (e.g. Thorstensen et al., 2002), or the direct formation of a CV from a detached white dwarf/brown dwarf binary (Politano, 2004). The presence of deep eclipses in SDSS J1507 allows a precise determination of the donor star’s mass, which may in turn allow us to decide between these two scenarios.
2 Observations
| Date | Start Phase | End Phase | Filters | Exposure time (s) | Data points | Eclipses | Seeing (arcsec) | Airmass |
|---|---|---|---|---|---|---|---|---|
| 2006 Mar 03 | -0.50 | 0.22 | u′g′r′ | 1.995 | 1450 | 1 | 1.1–1.5 | 1.092–1.096 |
| 2006 Mar 04 | 17.57 | 18.18 | u′g′r′ | 1.995 | 1206 | 1 | 1.4–2.8 | 1.441–1.630 |
| 2006 Mar 04 | 19.83 | 20.14 | u′g′r′ | 1.995 | 636 | 1 | 1.4–2.2 | 1.138–1.164 |
| 2006 Mar 05 | 38.53 | 39.16 | u′g′r′ | 1.995 | 1257 | 1 | 2.0–4.0 | 1.620–1.900 |
| 2006 Mar 05 | 41.39 | 42.14 | u′g′r′ | 1.995 | 1504 | 1 | 2.0–5.0 | 1.112–1.164 |
| 2006 Mar 07 | 86.48 | 87.42 | u′g′r′ | 1.995 | 1893 | 1 | 0.8–1.6 | 1.096–1.141 |
| 2006 Mar 08 | 103.72 | 104.29 | u′g′r′ | 1.995 | 1161 | 1 | 1.4–2.4 | 1.473–1.666 |
| 2006 Mar 08 | 104.91 | 105.14 | u′g′r′ | 1.995 | 454 | 1 | 1.0–1.5 | 1.286–1.327 |
On nights between Mar 03rd 2006 and Mar 08th 2006, SDSS J1507 was observed simultaneously in the SDSS- colour bands using ultracam (Dhillon et al., 2007) on the 4.2-m William Herschel Telescope (WHT) on La Palma. A complete journal of observations is shown in table 1. The observations were taken between airmasses of 1.0–1.9, in typical seeing conditions of 1.5 arcsecs, but with a range of 0.6–5.0 arcsecs. The data were taken in photometric conditions. Eight eclipses were observed in total. Data reduction was carried out in a standard manner using the ultracam pipeline reduction software, as described in Feline et al. (2004), and a nearby comparison star was used to correct the data for transparency variations. Because of the absence of a comparison star which was sufficiently bright in the -band, the -band data was corrected using the -band data for the comparison star, with appropriate corrections for extinction.
3 Results
3.1 Orbital Ephemeris
| Cycle No. | g′ | r′ |
|---|---|---|
| 0 | 0.738841 | 0.738845 |
| 18 | 1.571497 | 1.571508 |
| 20 | 1.664004 | 1.664012 |
| 39 | 2.542924 | 2.542920 |
| 42 | 2.681689 | 2.681683 |
| 87 | 4.763315 | 4.763321 |
| 104 | 5.549707 | 5.549720 |
| 105 | 5.595994 | 5.595964 |
The times of white dwarf mid-ingress and mid-egress were determined by locating the minimum and maximum times, respectively, of the lightcurve derivative. Mid-eclipse times, , were determined by assuming the white dwarf eclipse to be symmetric around phase zero and taking . Mid-eclipse timings are shown in table 2. The errors on our mid-eclipse times were adjusted to give . The -band and the -band lightcurves only were used, given the significantly poorer quality of the -band lightcurve. The results from the two lightcurves were combined with a weighted mean, giving an ephemeris of:
There was no significant deiviation from linearity in the times. This ephemeris was used to phase our data for the analysis which follows.
3.2 Lightcurve morphology and variations

Figure 1 shows the eight observed eclipses of SDSS J1507, folded on the orbital phase. The white dwarf ingress and egress features are clearly visible, as are the ingress and egress features of the bright spot (see chapter 2.6.2 of Warner, 1995, for an illustrated example of an eclipse in a typical dwarf nova system). The lightcurve is dominated by emission from the bright spot and the white dwarf. The eclipse of the accretion disc is difficult to discern by eye, implying that the accretion disc contributes little light to this system. There is no indication of ellipsoidal variations from the secondary star, but a double-humped morphology is seen. This double-humped morphology likely arises from the bright spot being visible throughout the orbit, which implies the accretion disc in this system is optically thin. There is very little variation between the individual eclipse lightcurves, implying that photometric precision and flickering dominate over systematic errors in lightcurve measurement for this system.
3.3 A parameterised model of the eclipse
To determine the system parameters we used a physical model of the binary system to calculate eclipse lightcurves for each of the various components. Feline et al. (2004) showed that this method gives a more robust determination of the system parameters in the presence of flickering than the derivative method of Wood et al. (1986). We used the technique developed by Horne et al. (1994) and described in detail therein. This model relies on two critical assumptions: that the bright spot lies on the ballistic trajectory from the secondary star, and that the white dwarf is accurately described by a theoretical mass-radius relation. The error introduced by the latter assumption can be estimated by comparing the results from different theoretical models, and we show later in this section that it is smaller than the statistical errors. Whilst the former assumption cannot be directly tested, Feline (2005) show that masses derived with this model are consistent with other methods commonly employed in cataclysmic variables over a wide range of orbital periods, including systems with similar accretion discs to SDSS J1507.
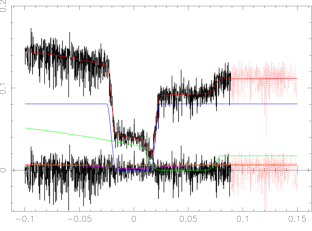
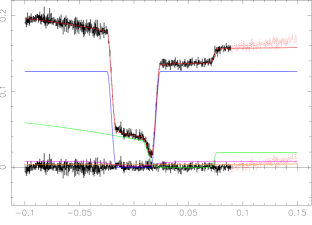
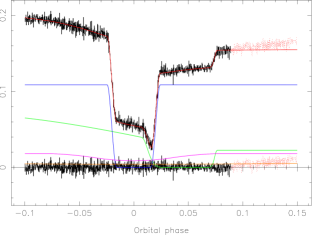
We fit the model to all the observed eclipses, which were phase-folded and binned into groups of three data points. The data and their model fits are shown in figure 2. The 10 parameters that control the shape of the lightcurve are as follows:
-
1.
The mass ratio, .
-
2.
The white dwarf eclipse phase full-width at half-depth, .
-
3.
The outer disc radius, .
-
4.
The white dwarf limb-darkening coefficient, .
-
5.
The white dwarf radius, .
-
6.
The bright-spot scale, . The bright-spot is modelled as a linear strip passing through the intersection of the gas stream and disc. The intensity distribution along this strip is given by , where is the distance along the strip.
-
7.
The bright-spot tilt angle, , measured relative to the line joining the white dwarf and the secondary star. This allows adjustment of the phase of the orbital hump.
-
8.
The fraction of bright-spot light which is isotropic, .
-
9.
The disc exponent, , describing the power law of the radial intensity distribution of the disc.
-
10.
A phase offset, .
The amoeba algorithm (downhill simplex; Press et al. 1986) was used to adjust all parameters bar to find the best fit. A linear regression was used to scale the four lightcurves (for the white dwarf, bright-spot, accretion disc and secondary) to fit the observed lightcurves in each passband. The excellent agreement between model and data gives us confidence that our simple model accurately describes the system. However, the model is a poorer fit to the data after eclipse. This is most likely because the accretion disc in SDSS 1507+5230 is optically thin, allowing the bright spot to remain visible when on the far side of the accretion disc. Such an effect is not included in our simple model. To limit the effects that the poor fit to post-eclipse data may have on the resulting system parameters we excluded the regions shown in red (light grey) in figure 2 from the fit.
In order to estimate the errors on each parameter once the best fit had been found, we perturbed one parameter from its best fit value by an arbitrary amount (initially 5 per cent) and re-optimised the rest of them (holding the parameter of interest, and any others originally kept constant, fixed). We then used a bisection method to determine the perturbation necessary to increase by , i.e. . The difference between the perturbed and best-fit values of the parameter gave the relevant error (Lampton, Margon & Bowyer, 1976). In the absence of systematic errors, or flaws in the model’s assumptions, the method described above produces errors and parameters which are robust, and unique (Littlefair et al., 2006). We are able to estimate the effects of systematic errors in our photometry by fitting each of our eight oberved eclipses separately, and comparing the spread of results with the formal errors produced by the method above. Only the - and -band lightcurves are of sufficient quality to do this. We find that the spread in parameters estimated from each individual -band eclipse are in good agreement with the formal errors, whilst the spread in parameters estimated from the individual -band eclipses suggest that the formal errors underestimate the true uncertainty in some parameters, by up to a factor of two. The - and -band lightcurves have almost identical signal/noise ratios, and so we might expect them to suffer from systematic errors in the photometry at roughly the same level. On the other hand, the -band lightcurve shows much more flickering prior to eclipse (the RMS before eclipse is about 3 times higher in than ). It is possible that the presence of flickering affects the model estimation in a systematic way. In this case, the formal error is an appropriate estimate. Alternatively, the -band lightcurve might be more affected by systematic errors in the photometry than the -band lightcurve, in which case the formal errors underestimate the true uncertainty by up to a factor of two. Since it is not clear which error estimate is more reliable, in each case we adopt the largest of the two estimates. These errors are shown in table 3.
The data were not good enough to determine the white dwarf limb-darkening coefficient, , accurately. To find an appropriate limb-darkening coefficient, we obtained an estimate of the effective temperature and mass of the white dwarf from a first iteration of the method below, and assuming a limb-darkening coefficient of 0.5. The mass and effective temperature were then used in conjunction with the stellar atmosphere code of Gänsicke et al. (1995) to generate angle-dependent white dwarf model spectra. To convert the spectra to observed fluxes the model spectra were folded through passbands corresponding to the instrumental response in each filter; the effects of the SDSS filter set, the ultracam CCD responses and the dichroics used in the instrumental optics were taken into account. These fluxes were then fit as a function of the limb position in order to derive limb-darkening parameters for each band. The values adopted are given in table 3. A second iteration using these values for the limb-darkening parameter gave the final values for each parameter. Comparison of the limb-darkening parameters provided by different atmosphere models (Gänsicke et al., 1995; Hubeny & Lanz, 1995) suggests an uncertainty in of percent. This corresponds to an uncertainty in of percent, which was added in quadrature to the error in provided by the fitting process.
| Band | u′ | g′ | r′ |
|---|---|---|---|
| Mass ratio | |||
| Eclipse phase width | |||
| Outer disc radius | |||
| White dwarf limb darkening | |||
| White dwarf radius | |||
| bright-spot scale | |||
| bright-spot orientation | |||
| Isotropic flux fraction | |||
| Disc exponent | |||
| Phase offset | |||
| of fit | 2555 | 2108 | 1470 |
| Number of datapoints | 1269 | 1269 | 1269 |
| Flux (mJy) | |||
| White dwarf | |||
| Accretion disc | |||
| Secondary | |||
| bright-spot |
We calculated the remaining system parameters following the method described in Littlefair et al. (2006). The model fitting provides estimates of , and . The orbital inclination is determined from and , using geometrical arguments (Bailey, 1979). Independent fits to the -, - and -band lightcurves yield consistent values of , and - a weighted mean of these values was adopted for the analysis that follows. The model also yields fluxes for the white dwarf component, derived by fitting the size of the white dwarf ingress and egress. The signal-to-noise ratio of our data is good, and the white dwarf fluxes are likely to be dominated by systematic errors. We added systematic errors of 1 percent to our white dwarf fluxes to account for this. A white dwarf temperature was found by fitting the white dwarf colours to the predictions of white dwarf model atmospheres (Bergeron et al., 1995). A mass for the white dwarf can then be derived from Kepler’s 3rd Law, the orbital period, the mass ratio and a mass-radius relationship for the white dwarf. We adopted an appropriate mass-radius relationship for the white dwarf (Wood, 1995), taking into account the effective temperature found above. Comparison of different white dwarf models (Wood, 1995; Bergeron et al., 1995; Panei et al., 2000), differing hydrogen envelope masses and correction to different effective temperatures revealed that the dominant source of uncertainty in the white dwarf mass is the uncertainty in . Once the white dwarf mass is known, the mass of the donor star follows from . The volume equivalent radius of the donor star can be calculated, assuming the donor star fills its Roche Lobe. A distance to the system was derived by comparing the white dwarf fluxes in table 3, and the predicted fluxes from Bergeron et al. (1995); the uncertainty in the distance is dominated by the uncertainty in the white dwarf temperature. The final adopted system parameters are shown in table 4.
| Inclination | |
|---|---|
| Mass ratio | |
| White dwarf mass | |
| Secondary mass | |
| White dwarf radius | |
| Secondary radius | |
| Separation | |
| White dwarf radial velocity | |
| Secondary radial velocity | |
| Outer disc radius | |
| White dwarf temperature | |
| Distance |
4 Discussion
4.1 The evolutionary status of SDSS J1507
The orbital period distribution of CVs shows a sharp cut-off around mins, known as the period minimum (see figure 1 of Pretorius et al., 2007, for example). The existence of a period minimum is easily explained in terms of the response of the secondary star to mass loss (Paczynski, 1981). Above the period minimum, the secondary star shrinks in response to mass loss and the orbital period decreases. As the secondary star nears the substellar limit, however, the thermal time-scale becomes longer than the mass-transfer timescale. When this happens the secondary is not able to shrink fast enough and the period begins to increase. A long-standing problem with this theory is that theoretical models persistently predict a period minimum around 67 minutes (e.g. Kolb & Baraffe, 1999), about 10 minutes short of the observed period minimum. With an orbital period of 67 minutes and a brown dwarf donor, SDSS J1507 could represent the “true” period minimum for CVs. Indeed, the secondary star mass and radius presented in table 4 are consistent with the predicted mass and radius for a system near the predicted minimum orbital period (Kolb & Baraffe, 1999). There is one major problem with this scenario however; where are all the systems between 67 minutes and the observed period minimum at minutes? Population synthesis models predict a large number of systems near the period minimum (e.g Kolb, 1993). We can think of no plausible explanation for why these systems should be absent and thus conclude that the observed period minimum at minutes represents the true period minimum for CVs. If this is indeed the case, we must then explain why SDSS J1507 has an orbital period significantly below 78 minutes.
Calculations show that CVs containing evolved secondary stars, in which a significant fraction of hydrogen in the core is processed prior to mass transfer, can reach orbital periods significantly below the period minimum (e.g Thorstensen et al., 2002; Podsiadlowski et al., 2003). Indeed, there is good reason to suspect that the two other CVs with periods below the observed period minimum contain evolved secondary stars. EI Psc has a secondary which is unusually hot (K42 - Thorstensen et al. 2002) and unusually massive ( - Skillman et al. 2002) for its orbital period, and the secondary star in EI Psc has a very large N/C abundance (Gänsicke et al., 2003). The mass and spectral type of the secondary star in EI Psc agree well with an evolutionary sequence in which a 1.2 star begins mass transfer close to the end of its hydrogen burning phase (Thorstensen et al., 2002). V485 Cen, too, has a mass which is large for its orbital period ( - Augusteijn et al. 1996), and both stars have He I /H ratios higher than those typically seen in SU UMa systems (Augusteijn et al., 1996; Thorstensen et al., 2002), suggestive of an enhanced Helium abundance in the donor.
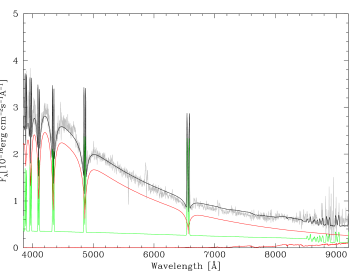
In the case of SDSS J1507, however, an extremely evolved secondary star cannot be the explanation for the short orbital period. The mass of the secondary () is a factor of two below the secondary star masses in EI Psc and V485 Cen. The absence of secondary star features in the optical spectrum also suggests a rather cool secondary star. We modelled the spectrum of SDSS J1507 using three components following the prescription outlined in Gänsicke et al. (2006). The white dwarf spectrum is computed for the parameters listed in table 4 using SYNSPEC/TLUSTY (Hubeny & Lanz, 1995). The accretion disc is described in terms of an isothermal/isobaric slab of hydrogen (Gänsicke et al., 1999) and the secondary star is represented by M/L dwarf spectral templates from Beuermann et al. (1998) and Kirkpatrick et al. (2000). The secondary star’s radius is fixed to 0.097 (table 4). Free parameters in this model are the temperature, column density and flux scaling factor of the hydrogen slab as well as a common scaling factor for the white dwarf/secondary star fluxes. A plausible fit is shown in figure 3, which implies a spectral type later than M9, which corresponds to an effective temperature of K (Vrba et al., 2004). This compares to a spectral type in EI Psc of K42 (Thorstensen et al., 2002). Also, the He I /H ratio in SDSS J1507 is 0.07. This is significantly lower than the ratio of 0.28 measured in EI Psc and closer to the average ratio amongst SU UMa stars of 0.13 (Thorstensen et al., 2002). The He I /H ratio depends sensitively on density and temperature as well as abundance, so this evidence is not conclusive, but it does agree with the general picture that the donor in SDSSJ1507 is not as evolved as those in EI Psc and V485 Cen.
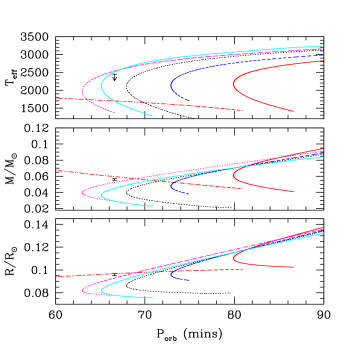
There is, of course, a continuum of possibilities between the highly evolved secondaries in EI Psc and V485 Cen, and a secondary with a normal hydrogen abundance. In order to see whether a moderately evolved secondary star could be compatible with the observed system parameters we computed a set of illustrative evolutionary sequences, based upon the models described in Kolb & Baraffe (1999). To ensure our sequences reproduced the observed period minimum, we adopted an arbitrarily enhanced angular momentum loss rate, twice that predicted by gravitational radiation. We also included the effects of distortion of the secondary due to tidal and rotational forces as quantified by Renvoizé et al. (2002). Models were calculated for an initially unevolved secondary star, as well as sequences with initial hydrogen fractions (by mass) of and 0.2. For , sequences were started with initial donor masses below 0.2 and with artificially enhanced abundances. This avoided having to search for the higher-mass progenitors of these systems (the progenitors are expected to have an intial mass and to start mass transfer toward the end of the central hydrogen burning phase, most likely for a central hydrogen mass fraction according to the calculations of Baraffe & Kolb (2000)). In order to quantify the effects of our ad-hoc assumptions about angular momentum loss on the evolved sequences, the sequence was also calculated with an angular momentum loss rate equal to that predicted by gravitational radiation. These sequences are shown in figure 4. From this figure it is apparent that both the sequence with and enhanced mass transfer, and the sequence with and “normal” mass transfer are broadly consistent with the observed mass, radius and effective temperature limit of SDSS J1507.
There are, however, a number of difficulties encountered when we try to explain the observed properties of SDSS J1507 with evolved sequences. The evolved sequences do not provide a very good fit to the observed mass and radius; if we assume a consistent (enhanced) angular momentum loss rate for both non-evolved and evolved sequences, then the hydrogen fraction must be lower than in order to reach orbital periods below minutes. Such evolved sequences under-predict the secondary mass. At a period of 66 mins, the sequence with has a mass of 0.045, which is inconsistent with the observed mass of . A good fit can be obtained with a sequence with and angular momentum loss rates equal to those predicted by gravitational radiation. Thus, to consistently explain both the system parameters of SDSS J1507 and the observed period minimum requires that the angular momentum loss rate be different in evolved and non-evolved sequences. There is no reason why this might not be so, but it does imply that the models need some degree of “tuning” to consistently explain the secondary star mass in SDSS J1507 and the observed period minimum. Additionally, sequences with an evolved secondary star are only just consistent with the upper limit to the effective temperature derived above, and fail to explain the slightly lower than average He I /H ratio in SDSS J1507. It is therefore difficult, though by no means impossible, to explain the short period of SDSS J1507 with an evolved secondary star.
A second possibility is that SDSS J1507 formed directly from a detached white dwarf/brown dwarf binary. Politano (2004) showed that CVs forming via this route could have orbital periods as short as 46 minutes. Maxted et al. (2006) recently identified the detached white dwarf/brown dwarf binary WD0137-349, with a white dwarf mass of 0.4 and a period of 116 minutes, showing that progenitors for such CVs can in principle survive the common envelope phase (although the white dwarf mass is very much lower in WD0137-349 than in SDSS J1507). Furthermore, the observed mass and radius of the secondary star in SDSS J1507 agree well with the predicted values for a system in which the initial donor mass was 0.07. Given the excellent agreement between observed and predicted system parameters, and the fact that it is the simplest evolutionary scenario consistent with the data, we believe that it is likely that SDSS J1507 formed directly from a white dwarf/brown dwarf binary.
4.2 CVs forming with brown dwarf secondaries
There are now two CVs known which have secondary stars with measured masses below the substellar limit: SDSS J1507 and SDSS J103533.03+055158.4 (Littlefair et al., 2006). With an orbital period of 82.1 minutes, SDSS J1035 is consistent with a CV which has evolved past the period minimum. As we argue above however, SDSS J1507 has likely formed directly from a detached white dwarf/brown dwarf binary. It is the first such system to be identified.
The puzzle is why there are not more. Politano (2004) found that 15% of the zero-age CV population should have formed with brown dwarf secondaries and have orbital periods below the observed period minimum. Since the evolution of these objects is slow, we might expect the present-day CV population to be broadly similar in this respect (Politano, 2004). Discounting V485 Cen and EI Psc on the basis of their evolved secondaries, there is now evidence for at least one such system, out of the 647 CVs with known periods (Ritter & Kolb, 2006). Could observational selection effects explain the discrepancy? The catalogue of Ritter & Kolb (2006) is compiled using a wide range of surveys with varying selection effects; some CVs are identified using variability, others from their blue colours and others as a result of their large outbursts (Gänsicke, 2005). However, the mass transfer rates in CVs forming from brown dwarf secondaries are predicted to be comparable to those of CVs above the period minimum (Kolb & Baraffe, 1999), of which large numbers exist in the Ritter catalogue. Furthermore, the presence of SDSS J1507 amongst the SDSS CV sample suggests that this survey, at least, is sensitive to these systems. Within the SDSS CV sample there are currently 90 CVs with known periods; even within this sub-sample there is clearly a marked absence of CVs below the observed period minimum (% compared to 15%). It is therefore unlikely that selection effects can explain the absence of significant numbers of CVs below the observed period minimum.
4.2.1 Common envelope efficiency
One way of reducing the predicted number of CVs forming with brown dwarf secondaries is to suggest that they will not survive the common envelope phase. If the orbital energy is insufficient to remove the common envelope, a merger will occur. Politano & Weiler (2007) showed that, to reconcile the observed and predicted number of CVs forming with brown dwarf secondaries, the common envelope efficiency parameter, , would have to drop to zero for secondary masses lower than . The existence of SDSS J1507 argues strongly against this scenario as, by definition, SDSS J1507 must have survived its common envelope phase. To determine the implications of this for common envelope efficiency, we adopt equation 1 of Politano & Weiler (2007), and assume the primary in SDSS J1507 was initially a main sequence star of 3.5–5.5 (Dobbie et al., 2006). We adopt a value of for the dimensionless parameter describing the structure of the primary, and assume no mass loss occurs prior to the common envelope phase. We assume that the binary components are co-eval, and determine a lower limit to by requiring that, at the end of the common envelope phase, the brown dwarf remains smaller than its Roche Lobe. For a progenitor mass of 3.5, we find that , whilst for a progenitor mass of 4.5, we find . For larger progenitor masses exceeds 1. Significant uncertainties about the evolutionary state of the primary at the onset of the common envelope phase means that our results are not unambiguous, and so these values of should be treated with caution, but our results do indicate that SDSS J1507 can survive the common envelope phase for physically plausible common envelope efficiencies. We note that WD0137-349 provides independent confirmation that close binaries with brown dwarf secondaries can survive the common envelope phase (Maxted et al., 2006). It is therefore unlikely that the shortage of CVs forming with brown dwarf secondaries is a result of mergers during the common envelope phase.
4.2.2 The brown dwarf desert
Whilst the simulations of Politano & Weiler (2007) assume a flat mass ratio distribution, observations of companions to solar-type stars indicate a relative scarcity of brown dwarf companions compared with either planetary mass or stellar companions (e.g. Duquennoy & Mayor, 1991). This has been termed the “brown dwarf desert”. Grether & Lineweaver (2006) found that nearby binaries with solar-type primaries and orbital separations AU are times more likely to have stellar companions than brown dwarf companions. Around 75% of the simulated zero-age CVs forming with brown dwarf secondaries had progenitors consisting of solar-type primaries with orbital separations less than 3 AU (Politano & Weiler, 2007). The dearth of CVs with periods below the period minimum could therefore be a simple consequence of a shortage of progenitors for these CVs. Since the observed properties of SDSS J1507 seem to indicate that the shortage of CVs with periods below the period minimum cannot be explained by observational selection effects or by mergers during the common envelope phase, we conclude that the dearth of CVs with periods shorter than the period minimum provides independent support for the reality of the brown dwarf desert.
4.3 The white dwarf temperature and ZZ Ceti pulsations
The observational ZZ Ceti instability strip ranges in effective temperature from 12270 to 10850K (Gianninas et al., 2005). Current theoretical models predict that the ZZ Ceti instability strip should be pure: all the isolated DA white dwarf stars, with temperatures within the instability strip limits should pulsate, with a small dependency on mass (Arras et al., 2006). With an effective temperature of K, the white dwarf in SDSS J1507 is inside the conventional ZZ Ceti strip. Lomb-Scargle periodograms reveal no evidence for ZZ Ceti pulsations, however, despite our rapid photometry and good signal-noise ratio.
In fact, almost all of the observed pulsating white dwarfs in CVs are outside the conventional ZZ Ceti strip (Szkody et al., 2007; Szkody et al., 2002; Araujo-Betancor et al., 2005), a result which is probably explained by the effects of a spread in white dwarf masses and accretion of small amounts of Helium from the secondary star (Arras et al., 2006). These effects may explain the absence of ZZ Ceti pulsations in SDSS J1507.
5 Conclusions
We present high-speed, three-colour photometry of the eclipsing cataclysmic variable SDSS J150722.30+523039.8. We measure an orbital period of 66.61 minutes, placing it below the observed “period minimum” for cataclysmic variables. By fitting a parameterised model to the eclipse lightcurves we obtain a mass ratio of , a primary mass of and a secondary mass and radius of and , respectively. The secondary star in SDSS J1507 has a mass substantially below the hydrogen burning limit, making it the second confirmed substellar donor in a cataclysmic variable.
We attempt to explain the short orbital period of SDSS J1507 as a result of nuclear evolution of the secondary star. We argue that given the secondary star’s low mass, the lack of any visible signature of the secondary star and the low He I /H line ratio, together with the difficulty in consistently explaining the secondary star mass in SDSS J1507 and the observed minimum period, argue against this scenario. Instead, we suggest that SDSS J1507 may have formed directly from a detached white dwarf/brown dwarf binary. If this scenario is correct, SDSS J1507 will be the first CV known to have formed this way. The effective temperature of the secondary, as well as its surface abundances, ought to be quite different in the two cases; deep infrared spectroscopy of SDSS J1507 would be highly desirable.
If SDSS J1507 did indeed form directly from a detached white dwarf/brown dwarf binary, its observed properties argue against the scarcity of such systems being explained by observational selection effects, or mergers during the common envelope phase. The best remaining explanation is that the progenitors of CVs are themselves scarce, providing independent evidence for the existence of the brown dwarf desert.
Acknowledgements
TRM acknowledges the support of a PPARC Senior Research Fellowship. CAW acknowledges the support of a PPARC Postdoctoral Fellowship. ULTRACAM and SPL are supported by PPARC grants PP/D002370/1 and PPA/G/S/2003/00058, respectively. This research has made use of NASA’s Astrophysics Data System Bibliographic Services. Based on observations made with the William Herschel Telescope operated on the island of La Palma by the Isaac Newton Group in the Spanish Observatorio del Roque de los Muchachos of the Instituto de Astrofisica de Canarias.
References
- Araujo-Betancor et al. (2005) Araujo-Betancor S., Gänsicke B. T., Hagen H.-J., Marsh T. R., Harlaftis E. T., Thorstensen J., Fried R. E., Schmeer P., Engels D., 2005, A&A, 430, 629
- Arras et al. (2006) Arras P., Townsley D. M., Bildsten L., 2006, ApJ, 643, L119
- Augusteijn et al. (1996) Augusteijn T., van der Hooft F., de Jong J. A., van Paradijs J., 1996, A&A, 311, 889
- Bailey (1979) Bailey J., 1979, MNRAS, 187, 645
- Baraffe & Kolb (2000) Baraffe I., Kolb U., 2000, MNRAS, 318, 354
- Bergeron et al. (1995) Bergeron P., Wesemael F., Beauchamp A., 1995, PASP, 107, 1047
- Beuermann et al. (1998) Beuermann K., Baraffe I., Kolb U., Weichhold M., 1998, A&A, 339, 518
- Dhillon et al. (2007) Dhillon V. S., Marsh T. R., Stevenson M. J., Atkinson D. C., Kerry P., Peacocke P. T., Vick A. J. A., Beard S. M., Ives D. J., Lunney D. W., McLay S. A., Tierney C. J., Kelly J., Littlefair S. P., Nicholson R., Pashley R., Harlaftis E. T., O’Brien K., 2007, MNRAS, p. 457
- Dobbie et al. (2006) Dobbie P. D., Napiwotzki R., Burleigh M. R., Barstow M. A., Boyce D. D., Casewell S. L., Jameson R. F., Hubeny I., Fontaine G., 2006, MNRAS, 369, 383
- Duquennoy & Mayor (1991) Duquennoy A., Mayor M., 1991, A&A, 248, 485
- Eggleton (1983) Eggleton P. P., 1983, ApJ, 268, 368
- Feline (2005) Feline W., 2005, PhD thesis, University of Sheffield
- Feline et al. (2004) Feline W. J., Dhillon V. S., Marsh T. R., Brinkworth C. S., 2004, MNRAS, 355, 1
- Feline et al. (2004) Feline W. J., Dhillon V. S., Marsh T. R., Stevenson M. J., Watson C. A., Brinkworth C. S., 2004, MNRAS, 347, 1173
- Gänsicke (2005) Gänsicke B. T., 2005, in Hameury J.-M., Lasota J.-P., eds, ASP Conf. Ser. 330: The Astrophysics of Cataclysmic Variables and Related Objects Observational population studies of cataclysmic variables - The golden era of surveys. p. 3
- Gänsicke et al. (1995) Gänsicke B. T., Beuermann K., de Martino D., 1995, A&A, 303, 127
- Gänsicke et al. (2006) Gänsicke B. T., Rodríguez-Gil P., Marsh T. R., de Martino D., Nestoras J., Szkody P., Aungwerojwit A., Barros S. C. C., 2006, MNRAS, 365, 969
- Gänsicke et al. (1999) Gänsicke B. T., Sion E. M., Beuermann K., Fabian D., Cheng F. H., Krautter J., 1999, A&A, 347, 178
- Gänsicke et al. (2003) Gänsicke B. T., Szkody P., de Martino D., Beuermann K., Long K. S., Sion E. M., Knigge C., Marsh T., Hubeny I., 2003, ApJ, 594, 443
- Gianninas et al. (2005) Gianninas A., Bergeron P., Fontaine G., 2005, ApJ, 631, 1100
- Grether & Lineweaver (2006) Grether D., Lineweaver C. H., 2006, ApJ, 640, 1051
- Horne & Marsh (1986) Horne K., Marsh T. R., 1986, MNRAS, 218, 761
- Horne et al. (1994) Horne K., Marsh T. R., Cheng F. H., Hubeny I., Lanz T., 1994, ApJ, 426, 294
- Hubeny & Lanz (1995) Hubeny I., Lanz T., 1995, ApJ, 439, 875
- Kirkpatrick et al. (2000) Kirkpatrick J. D., Reid I. N., Liebert J., Gizis J. E., Burgasser A. J., Monet D. G., Dahn C. C., Nelson B., Williams R. J., 2000, AJ, 120, 447
- Kolb (1993) Kolb U., 1993, A&A, 271, 149
- Kolb & Baraffe (1999) Kolb U., Baraffe I., 1999, MNRAS, 309, 1034
- Lampton et al. (1976) Lampton M., Margon B., Bowyer S., 1976, ApJ, 208, 177
- Littlefair et al. (2006) Littlefair S. P., Dhillon V. S., Marsh T. R., Gänsicke B. T., Southworth J., Watson C. A., 2006, Science, 314, 1578
- Maxted et al. (2006) Maxted P. F. L., Napiwotzki R., Dobbie P. D., Burleigh M. R., 2006, Nature, 442, 543
- Nelemans et al. (2001) Nelemans G., Portegies Zwart S. F., Verbunt F., Yungelson L. R., 2001, A&A, 368, 939
- Paczynski (1981) Paczynski B., 1981, Acta Astronomica, 31, 1
- Panei et al. (2000) Panei J. A., Althaus L. G., Benvenuto O. G., 2000, A&A, 353, 970
- Podsiadlowski et al. (2003) Podsiadlowski P., Han Z., Rappaport S., 2003, MNRAS, 340, 1214
- Politano (2004) Politano M., 2004, ApJ, 604, 817
- Politano & Weiler (2007) Politano M., Weiler K. P., 2007, ArXiv Astrophysics e-prints, pp astro–ph/0702662
- Press et al. (1986) Press W. H., Flannery B. P., Teukolsky S. A., 1986, Numerical recipes. The art of scientific computing. Cambridge: University Press, 1986
- Pretorius et al. (2007) Pretorius M. L., Knigge C., Kolb U., 2007, MNRAS, 374, 1495
- Renvoizé et al. (2002) Renvoizé V., Baraffe I., Kolb U., Ritter H., 2002, A&A, 389, 485
- Ritter & Kolb (2006) Ritter H., Kolb U., 2006, A&A, 404, 301
- Skillman et al. (2002) Skillman D. R., Krajci T., Beshore E., Patterson J., Kemp J., Starkey D., Oksanen A., Vanmunster T., Martin B., Rea R., 2002, PASP, 114, 630
- Szkody et al. (2002) Szkody P., Gänsicke B. T., Howell S. B., Sion E. M., 2002, ApJ, 575, L79
- Szkody et al. (2005) Szkody P., Henden A., Fraser O. J., Silvestri N. M., Schmidt G. D., Bochanski J. J., Wolfe M. A., Agüeros M., Anderson S. F., Mannikko L., Downes R. A., Schneider D. P., Brinkmann J., 2005, AJ, 129, 2386
- Szkody et al. (2007) Szkody P., Mukadam A., Gänsicke B. T., Woudt P. A., Solheim J.-E., Nitta A., Sion E. M., Warner B., Sahu D. K., Prabhu T., Henden A., 2007, ApJ, 658, 1188
- Thorstensen et al. (2002) Thorstensen J. R., Fenton W. H., Patterson J. O., Kemp J., Krajci T., Baraffe I., 2002, ApJ, 567, L49
- Vrba et al. (2004) Vrba F. J., Henden A. A., Luginbuhl C. B., Guetter H. H., Munn J. A., Canzian B., Burgasser A. J., Kirkpatrick J. D., Fan X., Geballe T. R., Golimowski D. A., Knapp G. R., Leggett S. K., Schneider D. P., Brinkmann J., 2004, AJ, 127, 2948
- Warner (1995) Warner B., 1995, Cataclysmic Variable Stars. Cambridge University Press, Cambridge
- Wood et al. (1986) Wood J. H., Horne K., Berriman G., Wade R., O’Donoghue D., Warner B., 1986, MNRAS, 219, 629
- Wood (1995) Wood M. A., 1995, LNP Vol. 443: White Dwarfs, 443, 41