Mechanical properties of Pt monatomic chains
Abstract
The mechanical properties of platinum monatomic chains were investigated by simultaneous measurement of an effective stiffness and the conductance using our newly developed mechanically controllable break junction (MCBJ) technique with a tuning fork as a force sensor. When stretching a monatomic contact (two-atom chain), the stiffness and conductance increases at the early stage of stretching and then decreases just before breaking, which is attributed to a transition of the chain configuration and bond weakening. A statistical analysis was made to investigate the mechanical properties of monatomic chains. The average stiffness shows minima at the peak positions of the length-histogram. From this result we conclude that the peaks in the length-histogram are a measure of the number of atoms in the chains, and that the chains break from a strained state. Additionally, we find that the smaller the initial stiffness of the chain is, the longer the chain becomes. This shows that softer chains can be stretched longer.
I Introduction
Since the formation of Au monatomic chains was first demonstrated in 1998 Yanson et al. (1998); Ohnishi et al. (1998), the chain formation in other materials and their quantum properties have attracted great interest of many researchers. Until now, many studies have been reported on this subject (for a review see Ref. Agraït et al., 2003), and especially the electrical properties of the chains have been investigated from the experimental and theoretical points of view. In many cases, the chains were characterized by information coming from electrical measurements, for example, conductance histogram, I-V spectroscopy, shot noise, etc Agraït et al. (2003, 2002); Smit et al. (2003). In contrast to the electrical properties, the mechanical properties of the chains have not been studied much, although these two properties are closely related Stafford (1998); Stafford et al. (1999). Understanding their mechanical properties is essential for further understanding of the chain formation, for the realization of manipulation of atoms and molecules, and for elucidation of fundamental physics of tribological phenomena such as friction, adhesion and wear.
The mechanical properties of atomic chains have been studied experimentally and theoretically for Au. Rubio-Bollinger and coworkers used a combination of a scanning tunnelling microscope (STM) with an atomic force microscope (AFM) to measure simultaneously the conductance of the chains and the tensile force for elongation and breaking of the chains Rubio et al. (1996); Rubio-Bollinger et al. (2001). Recently, a new experimental system has been independently developed by our group Valkering et al. (2005) and by Rubio-Bollinger et al. Rubio-Bollinger et al. (2004) to study directly the stiffness of the chains. Theoretical calculations and molecular dynamic simulations Torres et al. (1999); Todorov and Sutton (1996); Sorensen et al. (1998); Sánchez-Portal et al. (1999); Häkkinen et al. (2000); da Silva et al. (2001); Rubio-Bollinger et al. (2001); Dreher et al. (2005) have been performed to interpret the experimental results on Au chains. However, few experimental studies have been reported on the mechanical properties of the other chain forming metals.
Chain formation has been demonstrated experimentally Smit et al. (2001, 2003) and studied theoretically Bahn and Jacobsen (2001); García-Suárez et al. (2005); Pauly et al. (2006) for two other 5d elements, namely Pt and Ir. In this study, we address for the first time the formation and stability of Pt monatomic chains by measuring the mechanical stiffness of the nanowires. Using our newly developed system, the stiffness and conductance of Pt chains can be measured simultaneously, and the data can be analyzed by a statistical method.
II Experimental technique
In order to simultaneously measure the stiffness and conductance of Pt monatomic chains, we used a mechanically controllable break junction (MCBJ) technique combined with a miniature tuning fork as a force sensor, as described in Ref. Valkering et al., 2005. Compared to the STM-AFM system which has been used in most experiments on microscopic force measurement, the advantages of our system are as follows: (1) our system increases mechanical stability, permitting a statistical analysis on measurements of many different monatomic chains; (2) the tuning fork has a much higher stiffness (of the order of N/m) than an AFM-cantilever (typically a few tens N/m). This ensures that the formation and stability of the monatomic chains are not influenced by the motion of the force sensor. (3) In addition, the stiffness of the tuning fork allows the use of a dynamic force measurement technique where the tuning fork is excited at its resonance frequency. In AFM experiments this is only possible at amplitudes comparable to or larger than the interatomic distance.
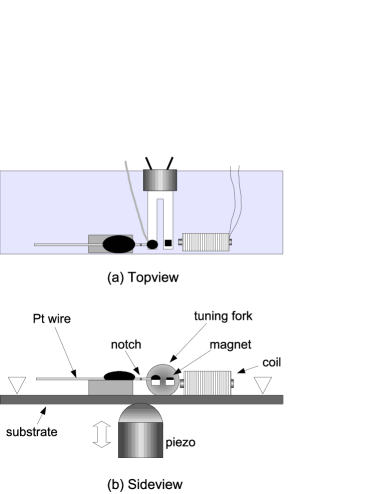
Figure 1 shows schematic drawings of (a) the top-view and (b) a side-view of the sample configuration in our MCBJ system. We used commercial tuning forks. The base of the tuning fork is soldered on a phosphorus-bronze substrate with both prongs freely standing. One end of the notched Pt wire with a diameter of 100 m is fixed on a small metallic block placed at the same height as the prongs of the tuning fork. The other end is glued on one prong of the tuning fork. The notch of the wire is located between the prong and block. On the other free prong, a magnet is glued, and a coil is fixed on the substrate next to the tuning fork. The tuning fork can be mechanically excited by an ac magnetic field generated by the coil.
The sample was mounted in an insert that is pumped down to a pressure of mbar at room temperature before being cooled down to liquid helium temperatures. The sample is elongated by bending the substrate until it is broken. By relaxing the substrate, the wire can be brought back into contact. By adjusting the voltage applied to the piezo-electric element the size of the contact can be adjusted reversibly on the atomic scale. The notched wire is only broken once the system is under cryogenic vacuum, ensuring clean surfaces in this way.
The tuning fork coupled with the contact is oscillated at its resonance frequency with an amplitude lower than 6 pm (peak to peak). Since the oscillation amplitude is kept two orders of magnitude smaller than the inter-atomic distance for Pt the oscillation does not influence the formation and stability of the contact. The resonance frequency of the tuning fork coupled through the contact will be shifted from that for a broken contact. The frequency shift () depends on the contact stiffness (), and can be related to using a harmonic oscillator model as:
| (1) |
where is the resonance frequency of the tuning fork for the broken contact, and the stiffness of the free tuning fork. was measured using two methods: (1) with a phase-locked loop (PLL) technique and (2) by measuring directly the phase shift () at a constant frequency and by relating it to , assuming that the quality factor is not changed by breaking the contact. We have confirmed that both methods give similar results. In most of the cases we have used the faster second method.

Simultaneously with we record the conductance of the contact. A constant bias voltage of 10–50 mV is applied to the contact and the resulting current is measured using a home-built current-to-voltage converter. The data acquisition and the measurement control are done by using a 16 bit analog-to-digital converter card, using home-built LabView software Lab .
III Results and Discussion
III.1 Nano-sized contact
Figure 2 shows typical traces of the stiffness and conductance measured simultaneously in the process of breaking a nano-sized Pt contact. The conductance decreases step-wise with increasing electrode displacement, i.e., the conductance trace is formed by plateaus separated by sudden drops. As reported previously, the contact evolution in the breaking process is composed of two alternating stages Rubio et al. (1996): (1) an elastic deformation stage where the conductance stays nearly constant, and (2) a plastic deformation stage where the configuration is suddenly changed to one having a smaller cross section, causing sudden drops of the conductance.
Jumps in the stiffness mostly coincide with the conductance drops, showing that the jumps are due to the plastic deformation occurring at the atomic rearrangements. Over the elastic stage, the stiffness also decreases smoothly on stretching. This shows that the contact response over the elastic deformation stage is not linear with the applied stress. The smooth decrease of the stiffness over a conductance plateau is attributed to bond weakening upon stretching, as reported for the elongation process in Au atomic-sized contacts Rubio-Bollinger et al. (2004). At the displacement of 1.55nm the stiffness shows a significant change without a clear conductance drop accompanying it. In fact, the conductance slightly decreases from 3.4G0 to 3.2G0. Probably this results from an atomic structural relaxation in the leads near the central part of the contact that does not affect the contact cross section, explaining why it is seen in the conductance only as a minor feature. Similar behavior is also observed around 0.7 nm.
III.2 Monatomic contact

In this section, we will focus on analyzing the mechanical properties of monatomic contacts. Figure 3 shows simultaneous measurement of the stiffness and conductance of a contact over the last conductance plateau, before breaking. The conductance decreases to 1.7 , which is close to the value expected for an atomic contact of Pt corresponding to a single Pt–Pt bond, i.e. a chain of two atoms Nielsen et al. (2003). As the monatomic contact is stretched further the conductance smoothly increases, then decreases and finally drops to zero when the contact is broken. Recently, García-Suárez et al. studied the electrical transport properties of Pt monatomic chains suspended by two Pt electrodes using first-principles simulations García-Suárez et al. (2005). They found that a zigzag arrangement is the most stable configuration in Pt monatomic chains. According to Ref. García-Suárez et al., 2005, the conductance is expected to increase from 1.5 to 2 when the zigzag arrangement is stretched into a linear configuration. The conductance increase from 1.7 to 2.2 in Fig.3 might be attributed to this alignment. When further stretching the contact the conductance slightly decreases just before breaking, which is likely due to stretching of the orbitals Cuevas et al. (1998). Similar to the behavior observed from the conductance the stiffness initially increases at the last conductance plateau and then decreases with increasing elongation. The stiffness of the zigzag arrangement can be expected to be smaller than that of a linear chain. The final decrease of the stiffness just before breaking would then result from bond weakening under extreme strain Rubio-Bollinger et al. (2004).
The absolute values for the stiffness measured for Pt atomic contacts are typically smaller than those reported in molecular dynamics simulations Pauly et al. (2006) and also smaller than the typical experimental values reported for Au atomic contacts Rubio et al. (1996); Rubio-Bollinger et al. (2001, 2004). Note that the measured value is an effective stiffness which results from the series connection of the chain itself, the supporting electrodes, and the interfaces between the chain and electrodes. The stiffness of the electrodes and the interfaces contributes to the measured value Pauly et al. (2006); Rubio-Bollinger et al. (2001) and will be different in each experimental run. In addition, the two Pt tips on each side of the junction may be misaligned, touching side-ways. These two effects, elasticity of the electrodes and misalignment, give rise to a significant lowering of the effective stiffness measured. Yet, since we find a clear correlation between the conductance and stiffness behavior, which is consistent with the results reported previously Valkering et al. (2005); Rubio-Bollinger et al. (2004), the measured variations in stiffness must reflect the qualitative behavior of the mechanical properties of the Pt atomic contact correctly. The absolute value of the stiffness of the monatomic chain cannot be determined with precision, and further study will be required on this point.
III.3 Monatomic chains
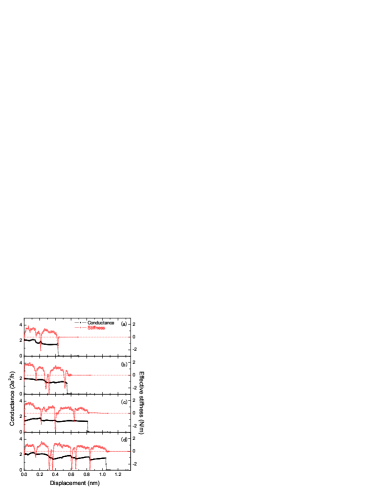
In many cases, by further stretching a monatomic contact, a chain of atoms can be formed. In Figs. 4(a)–(d), all the last conductance plateaus are (much) longer than in the case of Fig. 3. The conductance is about 2 at the starting point of the plateau, and then shows some variations until breaking of the contact at about 1.4 . The conductance values on the plateau indicate that the cross section of the contact is just one atom. The plateaus are stretched over 0.4 nm, 0.6 nm, 0.8 nm and 1.0 nm, corresponding to approximately three, four, five and six inter-atomic Pt–Pt distances in a linear arrangement, respectively. These are a strong indication that monatomic chains have formed between the electrodes, having one atom in cross-section and up to seven atoms in length. In the stiffness curve, there are several sudden drops occurring approximately periodically along the plateau, and the period is close to the inter-atomic distance of Pt atoms in a chain. The sudden drops are expected to result form the relaxation of the force during an atomic rearrangement of the contact, when a new atom accommodates into the chain. A similar behavior of the stiffness has been reported for Au monatomic chains by Rubio-Bollinger et al. Rubio-Bollinger et al. (2004).

In previous studies chain formation has been demonstrated by analyzing length-histograms, which are obtained by collecting the distribution of the lengths of the last conductance plateaus Yanson et al. (1998); Smit et al. (2001, 2003). We measured a similar length histogram from 2200 individual traces, constructed by taking a conductance dropping below 2.2 as the starting point of the chain. In addition we measured the average stiffness and conductance during the breaking of the Pt chains. The length scale was divided into a number of small bins, and the stiffness and conductance were averaged in each bin at the given length of the chains. The average stiffness and conductance as a function of the chain length are shown in Fig. 5 (a). In this figure, the length-histogram is superimposed. There are two distinct peaks in the length-histogram, and their central positions are equally spaced with a spacing of about one inter-atomic distance, 0.21nm. Looking at the data we first observe that the average stiffness shows local minima at the peak positions in the length-histogram. This supports the interpretation of the length histogram as will be discussed in more detail below. Note that the conductance does not show the same period and has an oscillation with double period that was previously reported and attributed to conductance oscillation as a function of the even-odd number of atoms in the chain Smit et al. (2003).
Further we have analyzed the behavior of the stiffness as a function of the number of atoms in the chains. We have divided the length-histogram into three main regimes, each of which is centered on the peaks in the length-histogram in order to obtain a more precise estimate of the number of atoms in the chain.foo The stiffness and conductance have been averaged just for those chains breaking at these particular lengths. The results are shown as a function of the elongation in Figs. 5 (b) and (c) for the average stiffness and conductance, respectively. For region 1, the lengths of the chains have been selected to be between 0.20 and 0.24 nm, and is attributed to a two-atom chain. The regions 2 and 3 represent three- and four-atom chains, defined by lengths ranging from 0.40 to 0.44, and from 0.63 to 0.67, respectively. In Fig. 5 (b) and (c), the averaged stiffness and conductance for two-atom chains (filled squares), three-atom chains (circles) and four-atom chains (crosses) were constructed from 290, 181 and 40 curves, respectively. When one compares the stiffness as a function of the number of atoms in the chain the following can be observed: firstly, the stiffness drops just before breaking in each curve. This is likely due to bond-weakening, showing that Pt monatomic chains break from a stretched state rather than a relaxed state. Secondly, the oscillation period of the stiffness curve is approximately the inter-atomic distance for all three regimes. During the process leading to the formation of a three-atom chain the stiffness shows a local minimum at the first peak in the length histogram. In the process of formation of a four-atom chain the stiffness also shows local minima at the first and second peaks in the length histogram. The positions of the local minima in stiffness do not depend on the final length of the chain, and the periodicity of the local minima almost agrees with the Pt–Pt inter-atomic distance in a linear arrangement. Therefore, the local minima in stiffness reflect a relaxation of the force acting on the contact by accommodation of a new atom into the chain. This supports the idea that the peaks in the length-histogram are a measure of the number of atoms in the chains. Thirdly, the stiffness just before breaking decreases with the chain length. To avoid the effect of the strong drop in stiffness due to the bond weakening the local maximum of the stiffness just before the bond weakening can be compared. The local maxima of the stiffness are about 1.1 N/m for the two-atom chain, 0.8 N/m for three-atom chain, and 0.6 N/m for four-atom chain. This decrease in stiffness with length is in qualitative agreement with the result on Au monatomic chains shown in Ref. Rubio-Bollinger et al., 2001. Fourth, the position and amplitude of the maximum in the stiffness in a given length regime depend on the final chain length. Namely, the smaller the maximum stiffness in a certain regime the longer the chain can be stretched. This can be seen for all the three sectors as follows: for the first length regime, the chains that end up having a maximum length of two atoms have a higher maximum stiffness than those that end up having a maximum of three or four atoms and the maximum is found at a longer stretch-length. The same is valid in the second length regime where the three-atom chains have a higher stiffness than those ending in four atoms. One possible explanation for this fact is that a chain can sustain a maximum force that is independent of its length, as was reported by force measurements on Au chains Rubio-Bollinger et al. (2001). Roughly speaking, one might integrate the measured stiffness over the elongation to obtain the total force and, therefore, for the same elongation a larger force acts on the chain that breaks early, for which the stiffness grows longer and higher, resulting in breaking at a shorter length. This is reasonable in view of the mechanism expected to be involved in the growing of the chain. If the atomic structure of the leads near the chain section permits releasing new atoms for addition to the chain length the structure will have a lower stiffness. Only when the leads are more rigidly ordered such that no atoms are available for lengthening of the chain can the force (and the stiffness) in the chain develop its larger intrinsic value. Finally, in the regions 1 and 2, both the stiffness and the conductance show an increase followed by a decrease before the breaking point of the chain. This is consistent with what is observed in the individual trace of Fig. 3, and might be attributed to a zigzag to linear transition.
IV Conclusion
The mechanical properties of Pt monatomic chains were studied using our newly developed MCBJ system with a tuning fork as a force sensor. The system enables us to measure simultaneously an effective stiffness and the conductance of the chain, and to obtain enough data for a statistical analysis. In the shortest contacts having a single Pt–Pt bond (the two-atom chain) the stiffness and conductance increases with stretching, which can be attributed to the transition from zigzag to linear arrangement, and then decreases due to bond weakening under extreme strain. From our statistical analysis on longer monatomic chains, it was found that the stiffness decreases with elongation of the chain, having local minima due to the bond weakening and subsequent atomic rearrangements in the chain. Moreover, the minima in the stiffness appeared at the same positions as the peaks in the length-histogram. This agrees with the interpretation that the peaks in the length-histogram are a measure of the number of atoms in the chain. The final length of the chain depends on its stiffness, that is, softer chains can grow longer.
Acknowledgements.
This work is part of the research program of the “Stichting FOM,” partly sponsored through the SONS Programme of the European Science Foundation, which is also funded by the European Commission, Sixth Framework Programme.References
- Yanson et al. (1998) A. I. Yanson, G. Rubio Bollinger, H. E. van den Brom, N. Agraït, and J. M. van Ruitenbeek, Nature 395, 783 (1998).
- Ohnishi et al. (1998) H. Ohnishi, Y. Kondo, and K. Takayanagi, Nature 395, 780 (1998).
- Agraït et al. (2003) N. Agraït, A. Levy Yeyati, and J. M. van Ruitenbeek, Phys. Rep. 377, 81 (2003).
- Agraït et al. (2002) N. Agraït, C. Untiedt, G. Rubio-Bollinger, and S. Vieira, Chem. Phys. 281, 231 (2002).
- Smit et al. (2003) R. H. M. Smit, C. Untiedt, G. Rubio-Bollinger, R. C. Segers, and J. M. van Ruitenbeek, Phys. Rev. Lett. 91, 076805 (2003).
- Stafford (1998) C. A. Stafford, Physica E 1, 310 (1998).
- Stafford et al. (1999) C. A. Stafford, F. Kassubek, J. Bürki, and H. Grabert, Phys. Rev. Lett. 83, 4836 (1999).
- Rubio et al. (1996) G. Rubio, N. Agraït, and S. Vieira, Phys. Rev. Lett. 76, 2302 (1996).
- Rubio-Bollinger et al. (2001) G. Rubio-Bollinger, S. R. Bahn, N. Agraït, K. W. Jacobsen, and S. Vieira, Phys. Rev. Lett. 87, 026101 (2001).
- Valkering et al. (2005) A. M. C. Valkering, A. I. Mares, C. Untiedt, K. Babaei Gavan, T. H. Oosterkamp, and J. M. van Ruitenbeek, Rev. Sci. Instrum. 76, 103903 (2005).
- Rubio-Bollinger et al. (2004) G. Rubio-Bollinger, P. Joyez, and N. Agraït, Phys. Rev. Lett. 93, 116803 (2004).
- Torres et al. (1999) J. A. Torres, E. Tosatti, A. D. Corso, F. Ercolessi, J. J. Kohanoff, F. D. D. Tolla, and J. M. Soler, Surface Science 426, L441 (1999).
- Todorov and Sutton (1996) T. N. Todorov and A. P. Sutton, Phys. Rev. B 54, R14234 (1996).
- Sorensen et al. (1998) M. R. Sorensen, M. Brandbyge, and K. W. Jacobsen, Phys. Rev. B 57, 3283 (1998).
- Sánchez-Portal et al. (1999) D. Sánchez-Portal, E. Artacho, J. Junquera, P. Ordejón, A. García, and J. M. Soler, Phys. Rev. Lett. 83, 3884 (1999).
- Häkkinen et al. (2000) H. Häkkinen, R. N. Barnett, A. G. Scherbakov, and U. Landman, J. Phys. Chem. B 104, 9063 (2000).
- da Silva et al. (2001) E. Z. da Silva, A. J. R. da Silva, and A. Fazzio, Phys. Rev. Lett. 87, 256102 (2001).
- Dreher et al. (2005) M. Dreher, F. Pauly, J. Heurich, J. C. Cuevas, E. Scheer, and P. Nielaba, Phys. Rev. B 72, 075435 (2005).
- Smit et al. (2001) R. H. M. Smit, C. Untiedt, A. I. Yanson, and J. M. van Ruitenbeek, Phys. Rev. Lett. 87, 266102 (2001).
- Bahn and Jacobsen (2001) S. R. Bahn and K. W. Jacobsen, Phys. Rev. Lett. 87, 266101 (2001).
- García-Suárez et al. (2005) V. M. García-Suárez, A. R. Rocha, S. W. Bailey, C. J. Lambert, S. Sanvito, and J. Ferrer, Phys. Rev. Lett. 95, 256804 (2005).
- Pauly et al. (2006) F. Pauly, M. Dreher, J. K. Viljas, M. Hafner, J. C. Cuevas, and P. Nielaba, Phys. Rev. B 74, 235106 (2006).
- (23) LabView 7.0, National Instruments, Austin, TX, USA.
- Nielsen et al. (2003) S. K. Nielsen, Y. Noat, M. Brandbyge, R. H. M. Smit, K. Hansen, L. Y. Chen, A. I. Yanson, F. Besenbacher, and J. M. van Ruitenbeek, Phys. Rev. B 67, 245411 (2003).
- Cuevas et al. (1998) J. C. Cuevas, A. Levy Yeyati, A. Martin-Rodero, G. R. Bollinger, C. Untiedt, and N. Agraït, Phys. Rev. Lett. 81, 2990 (1998).
- (26) The third peak is not very well developed in this data set, but its position was verified from a much larger set of data collected independently of the force measurement run, for the same contact.