OVRO N2H+ Observations of Class 0 Protostars: Constraints on the Formation of Binary Stars
Abstract
We present the results of an interferometric study of the N2H+ (1–0) emission from nine nearby, isolated, low-mass protostellar cores, using the OVRO millimeter array. The main goal of this study is the kinematic characterization of the cores in terms of rotation, turbulence, and fragmentation. Eight of the nine objects have compact N2H+ cores with FWHM radii of 1200 3500 AU, spatially coinciding with the thermal dust continuum emission. The only more evolved (Class I) object in the sample (CB 188) shows only faint and extended N2H+ emission. The mean N2H+ line width was found to be 0.37 km s-1. Estimated virial masses range from 0.3 to 1.2 . We find that thermal and turbulent energy support are about equally important in these cores, while rotational support is negligible. The measured velocity gradients across the cores range from 6 to 24 km s-1 pc-1. Assuming these gradients are produced by bulk rotation, we find that the specific angular momenta of the observed Class 0 protostellar cores are intermediate between those of dense (prestellar) molecular cloud cores and the orbital angular momenta of wide PMS binary systems. There appears to be no evolution (decrease) of angular momentum from the smallest prestellar cores via protostellar cores to wide PMS binary systems. In the context that most protostellar cores are assumed to fragment and form binary stars, this means that most of the angular momentum contained in the collapse region is transformed into orbital angular momentum of the resulting stellar binary systems.
1 INTRODUCTION
A major gap in our understanding of star formation concerns the origin of binary stars. Binary/multiple systems appear to be the preferred outcome of the star formation process, but at present we do not understand how this occurs (Mathieu et al. 2000). In the past two decades, statistical properties of binary stars are gradually comprehended through numerous observations and theoretical simulations, but are still subject to extensive ongoing studies (see a review by Duchêne et al. 2007). The most recent observational results and theoretical models for binary star formation can be found in the proceedings of IAU Symposium 200 (Zinnecker & Mathieu 2001), Launhardt (2004), and reviews in Protostars & Protoplanets V (Reipurth, Jewitt, & Keil 2007).
Different formation scenarios for binary stars have been proposed, of which the classical ideas of capture and fission are no longer considered major processes. Fragmentation of rotating cloud cores with initially flat density profiles, immediately after a phase of free-fall collapse, is generally considered to be the most efficient mechanism, leading to systems with a wide variety of properties (see reviews by Bodenheimer et al. 2000 and Tohline 2002). These properties are largely determined by the accretion process which, in turn, strongly depends on the initial conditions of the cloud cores, e.g., the initial distributions of mass and angular momentum (see Bate & Bonnell 1997). Some of the theoretical predictions, e.g., that close binary systems are likely to have mass ratios near unity (see Bate 2000), are already indirectly supported by statistical studies of evolved binary systems (see Halbwachs et al. 2003).
However, our current knowledge on the formation of binary stars mainly relies on observations of main sequence (MS) and pre-main sequence (PMS) stars and the constraints they put on the models. The observational link between initial conditions in a molecular cloud and the final star systems formed therein is still missing. Furthermore, as multiple systems certainly undergo dynamical evolution, important information about the formation phase is lost in the final systems. Direct observations of prestellar cores and protostars are needed therefore to answer a number of questions, e.g., how common is binarity/multiplicity in the protostellar phase? What makes a prestellar core to fragment in the collapse phase? How is angular momentum distributed? Are there differences between cores forming binaries and those forming single stars? Unfortunately, direct observations of protostellar stages, when the main collapse has started but no optical or infrared emission emerges from the protostar through the opaque infalling envelope, were long hampered by the low angular resolution of millimeter (mm) telescopes and the results were mostly interpreted in terms of single star formation. Only the recent advance of large mm interferometers has enabled us to directly observe the formation phase of binary stars, although the number of known systems is still very small and no systematic observational studies of the initial fragmentation process do exist yet (see the review by Launhardt 2004). The systematic study by Looney et al. (2000) was successful in detecting a number of protostellar binaries by mm dust continuum emission, but did not provide any kinematic information. Only recently these authors published velocity fields of 3 objects from their sample (Volgenau et al. 2006).
To search for binary protostars and derive kinematic properties of these systems, we have started a program to observe, at high angular resolution, a number of isolated low-mass prestellar and protostellar molecular cloud cores, conducted at the Owens Valley Radio Observatory (OVRO) millimeter array (this work; hereafter called Paper I) and now continued with ATCA (Australia Telescope Compact Array) and PdBI (IRAM Plateau de Bure Interferometer) arrays (Paper II&III, in prep.). In this paper we present N2H+ results for 9 protostellar cores observed with OVRO. In section 2 we describe the target list, observations, and data reduction. Observational results are presented in section 3. We give a detailed description of individual sources and discuss the implications of our results for binary star formation models in section 4. The main conclusions of this study are summarized in section 5.
2 OBSERVATIONS AND DATA REDUCTION
For this survey we selected a number of well-isolated and nearby low-mass protostellar cores. Priority was given to sources which were already well-characterized either by our own previous observational data or in the literature. Most sources are Class 0 objects, which represent the youngest protostars at an age of a few 104 yr. While they may already be too evolved to represent the true initial conditions, these sources provide an opportunity to probe the earliest and most active stage of the star formation process, where most of the initial information is still preserved. The target list and basic properties of the sources are summarized in Table 1.
For studying the gas kinematics and derive rotation curves, we choose to observe the N2H+ (1-0) hyperfine structure line complex at 93.1378 GHz. N2H+ is known to be a selective tracer of cold, dense, and quiescent gas and is particularly suitable for studying the structure and kinematics of cold star-forming cores (Turner & Thaddeus 1977; Womack, Ziurys, & Wychoff 1992; Bachiller 1996; Caselli et al. 2002). It is the most reliable tracer of the gas kinematics in pre- and protostellar cores for three reasons: (1) compared to other molecules, it depletes much later and more slowly onto grains (Bergin & Langer 1997), (2) it is formed where CO is depleted and thus traces only the dense cores and not the wider envelope and is thus perfectly suited for interferometric observations, and (3) with its seven hyperfine components within 17 km s-1 (including optically thin and moderately optically thick components; Caselli et al. 1995) it provides much more precise and reliable kinematic information than a single line, even with a moderate signal-noise ratio.
Observations were carried out with the OVRO array of six 10.4 m telescopes during 7 observing seasons between 1999 and 2002. Five different array configurations (C, L, E, H, and U) were used, with baselines ranging from 18 to 480 m. All antennas were equipped with cooled SIS receivers which provided average system temperatures of 300400 K at the observing frequency. A digital correlator was centered at 93.1378 GHz. Spectral resolution and bandwidth were 0.2 km s-1 and 25 km s-1, respectively. Amplitude and phase were calibrated through frequent observations of quasars nearby to each source, typically every 20 minutes, resulting in an absolute position uncertainty of 02. The flux density scale was calibrated by observing Neptune and Uranus. The estimated uncertainty is 20%. Observing parameters are summarized in Table 2. The thermal dust continuum emission was measured simultaneously with the N2H+ and other line observations using a separate continuum correlator. The combined continuum results will be published in a separate paper (Launhardt et al., in prep.).
The raw data were edited and calibrated using the MMA software package (Scoville et al. 1993), and synthesized images were produced using MIRIAD (Sault et al. 1995) and its CLEAN algorithm, with “robust” weighting of the visibilities (Briggs et al. 1999). The cleaned and restored maps have effective synthesized beam sizes of 48′′ and 1 rms levels of 70 mJy/beam (see Table 2). Further analysis and figures were done with the GILDAS111http://www.iram.fr/IRAMFR/GILDAS software package. With Class (part of GILDAS), we have developed a semi-automatic fitting routine which allows the derivation of reliable and very accurate velocity fields from the 7-hyperfine component line complex. Assuming that bulk rotation is the dominating motion, the velocity fields are then used to derive the rotation axis and the specific angular momentum of the cores.
3 RESULTS
3.1 Morphology of N2H+ Cores
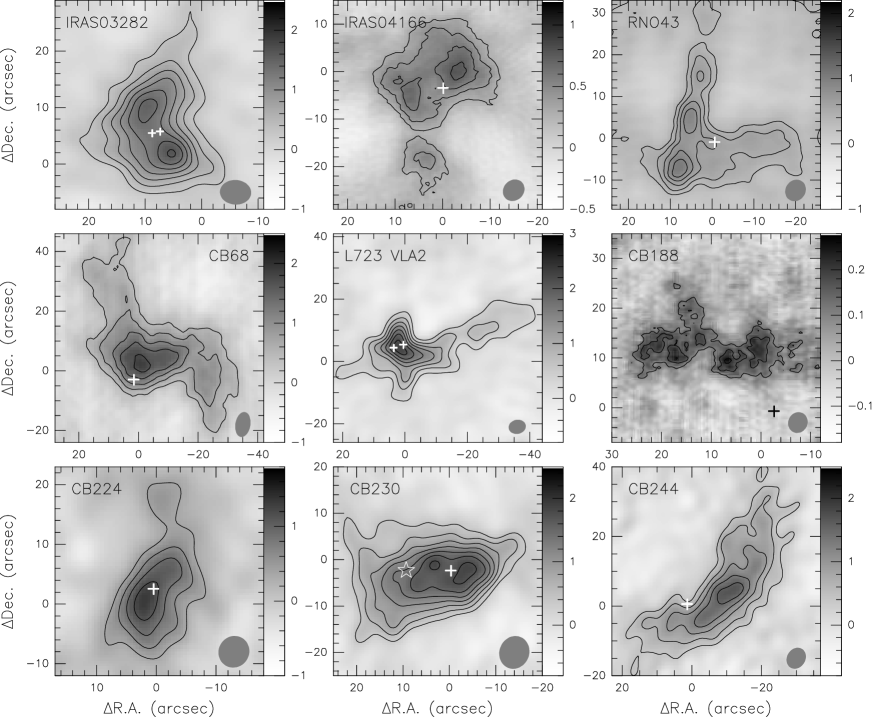
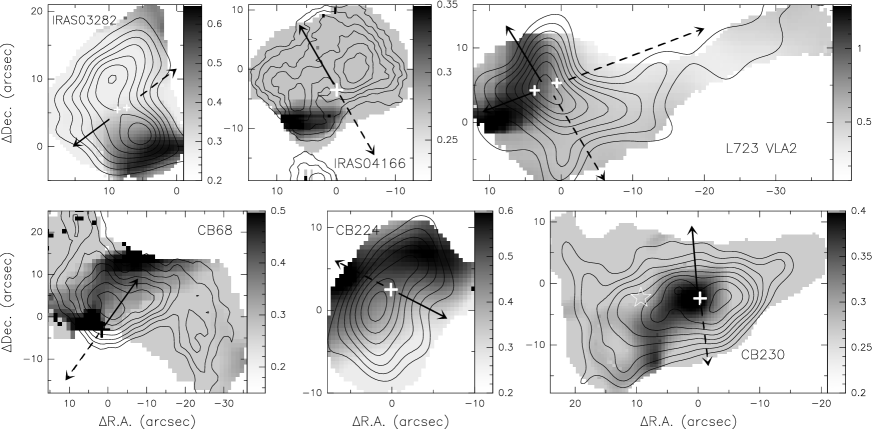
N2H+ emission is detected from all nine targeted objects. Figure 1 shows the distribution of the velocity-integrated intensity of N2H+ towards the nine cores. The emission was integrated over all seven components, using frequency masks that completely cover velocity gradients within the sources. All objects are spatially associated with mm dust continuum sources, indicative of embedded protostars and their accretion disks. The positions of the mm continuum sources are indicated by crosses in Figure 1 (Launhardt et al. 2007, in prep.). We find that in seven of the nine objects the mm continuum source lies within the half maximum level of the N2H+ emission. The two exceptions are CB 188 (the only Class I object in our sample) and CB 244. This good general agreement indicates that N2H+ cannot be significantly depleted like, e.g., CO and CS (see also Bergin et al. 2001; Caselli et al. 1999).
We also measured mean FWHM radii of the integrated N2H+ emission. The mean FWHM core radii were measured as , where is the core area at the half maximum level, corrected for the beam size. Except for CB 188, all sources exhibit quite compact N2H+ emission regions with mean FWHM radii of 12003500 AU (see Table 4). The average radius in our sample is = 2000 800 AU, which is much lower than the average value found by Caselli et al. (2002; hereafter CBMT02) for their sample of starless cores ( 10000 AU) observed with single-dish observations (beam size 54′′), but similar to the radius of Class 0 sources IRAM 04191+1522 ( 2400 AU) and NGC 1333 IRAS 4B ( 1800 AU) observed with PdBI by Belloche et al. (2002) and Di Francesco et al. (2001), respectively.
However, when viewed in detail, all sources in our sample show a complex, often multi-peaked structure. For example, IRAS 03282, IRAS 04166, and CB 230 each have two separated peaks in the region enclosed by the half maximum intensity level, with the mm continuum source located between the two peaks. In RNO 43, CB 68, CB 224, and CB 244 the main peak of N2H+ emission offsets by 510′′ from the mm continuum sources. Only in L723 VLA2 there is no positional discrepancy between the N2H+ and mm continuum emission. The individual sources are discussed in detail in Section 4.1.
3.2 Masses and Column Densities
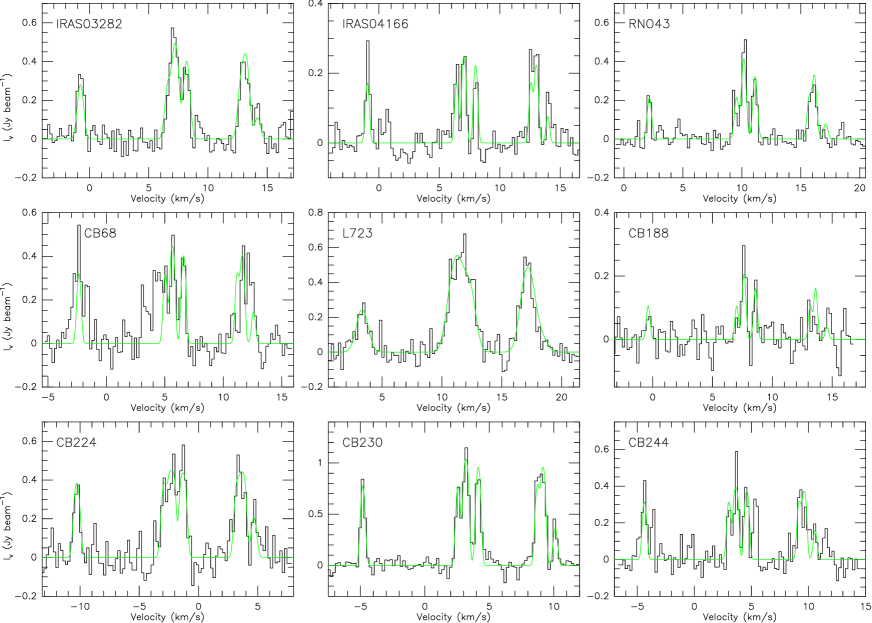
Figure 2 shows the N2H+ spectra at the position of maximum intensity in each map. The N2H+ (10) line complex consists of 7 hyperfine structure components, which have been detected in all sources. However, in several sources like, e.g., L723 VLA2 (see below), the line width is larger than the separation between hyperfine components, so that some lines are blended. The hyperfine fitting program in CLASS (Forveille et al. 1989), with the frequencies adopted from Caselli et al. (1995) and weights adopted from Womack et al. (1992), has been used to determine LSR velocities (), intrinsic line width (; corrected for instrumental effects), total optical depths (), and excitation temperatures (). These parameters are listed in Table 3. Here is the sum of the peak optical depths of the seven hyperfine components (see Benson & Myers 1989). The optical depth of the main N2H+ () component, which is equal to 0.259, is found to be small ( 0.5) at the intensity peak for all sources. Hence the N2H+ emission can be considered optically thin everywhere. The excitation temperature, , was calculated to be 4.15.7 K at the peak positions, using a main-beam efficiency = 0.7 (Padin et al. 1991). The average 4.9 K in our sample is similar to what has been found with single-dish observations for dense cores by CBMT02 ( 5.0 K).
Assuming that the observed N2H+ line widths are not dominated by systematic gas motions, the virial mass of the cores has been calculated as:
| (1) |
where is the gravitational constant, is the FWHM core radius, and is the line width of the emission from an “average” particle with mass = 2.33 amu (assuming gas with 90% H2 and 10% He). The coefficient = (3 )/(5 2), where is the power-law index of the density profile, is corrected for deviations from constant density (see Williams et al. 1994). In our calculations, we assume = 1.5 and = 0.75 (see André, Ward-Thompson, & Barsony 2000). can be derived from the observed spectra by
| (2) |
where is the observed mean line width (obtained through Gaussian fitting to the distribution of line widths vs. solid angle area; see Table 3 and 3.4) and is the mass of the emitting molecule (here we use = 29 amu). The corresponding hydrogen density of the has been calculated assuming a uniform density spherical core with radius (given in Table 4). The derived virial masses in our sample range from 0.3 to 1.2 , with a mean value of 0.6 . The corresponding hydrogen densities range from 7.4 to 81 105 cm-3. Both and values for each source are listed in Table 4.
The N2H+ column density has been calculated independently from the line intensity using the equation given by Benson et al. (1998):
| (3) |
where is the total optical depth, is the intrinsic line width in km s-1, and is the excitation temperature in K. The gas-phase N2H+ mass of the core can then be calculated from FWHM, where is the distance from the sun and is the area enclosed by the contour level at 50% of the peak value for each core.
From the ratio of N2H+ mass to virial mass, we derived the average fractional abundance of N2H+ in each core: = /, where = /1.36, the factor 1.36 accounting for He and heavier elements. The values are listed in Table 4. The average value 3.3 10-10 in our sample is close to that found by CBMT02 for their sample of dense cores ( 3 10-10).
3.3 Velocity Fields
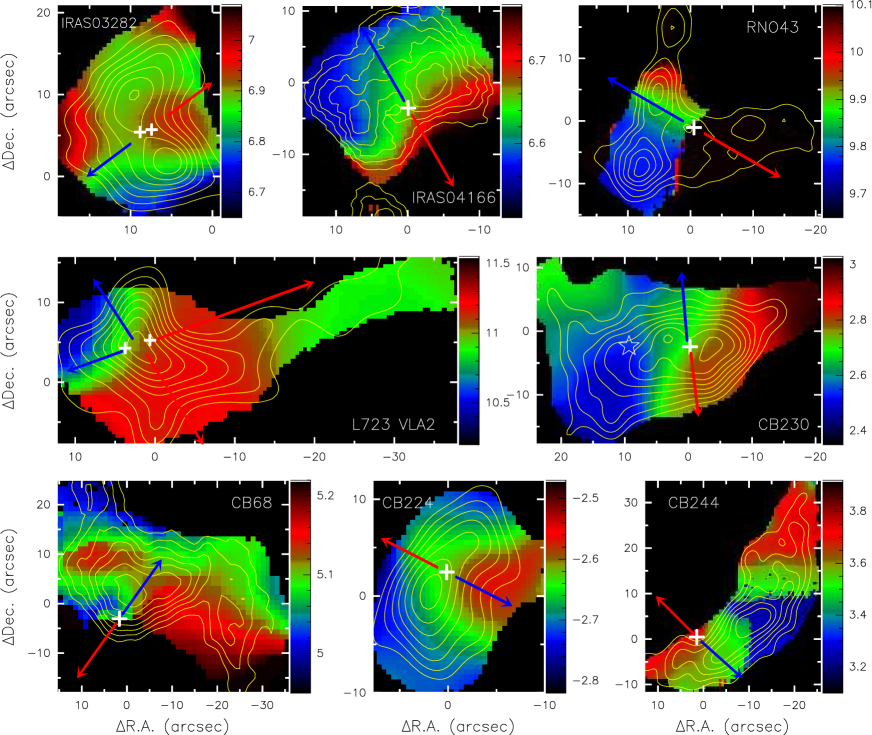
Based on the hyperfine fitting program in Class, we have developed a semi-automated quality control and spectra fitting routine that computes the mean radial velocity, line width, and line intensity at each point of the map where N2H+ is detected ( 2 noise). Figure 3 shows the mean velocity fields for the 8 Class 0 objects in our sample, obtained from this line fitting routine. The N2H+ emission from CB 188, the only evolved (Class I) object in our sample, is too faint and fuzzy to give a reliable velocity field.
In Class 0 protostars, the effects of infall, outflow, rotation, and turbulence are generally superimposed. Of these, turbulence and infall normally broaden the lines but do not produce systematic velocity gradients. On the other hand, systematic velocity gradients are usually dominated by either rotation or outflow. In Fig. 3, we therefore also show the outflow information for each source. We want to mention that many other studies usually do not take this kind of caution. Figure 3 shows that 5 objects (IRAS 04166, RNO 43, L723 VLA2, CB 230, and CB 224) have well-ordered velocity fields with symmetrical gradients, while 3 objects (IRAS 03282, CB 68, and CB 244) have more complex velocity fields. Two objects (RNO 43 and CB 230) with well-ordered velocity fields have gradients roughly perpendicular to the axis of outflow, while 2 objects (IRAS 04166 and L732 VLA2) have gradients basically parallel and one object (CB 224) anti-parallel to the outflow direction.
Assuming the mean direction of the bulk angular momentum is preserved in the collapse from the core to the disk, we would expect outflows to emerge perpendicular to the rotation velocity gradients. Thus, if the velocity field is dominated by rotation, we would see the velocity gradient to be perpendicular to the outflow axis, like seen in RNO 43 and CB 230. If gradients are parallel to the outflow axis and with the same orientation, it is likely that we see outflow motions rather than rotation, like in IRAS 04166 and L723 VLA2. In these cases, a possible underlying rotation velocity gradient must be smaller than the observed effective gradient. Following these arguments, we treat those gradients parallel to the outflow as upper limits to the rotation gradient. The details of the velocity field for each source are described in 4.1.
A least-squares fitting of velocity gradients has been performed for the objects in our sample using the routine described in Goodman et al. (1993; hereafter GBFM93). The fitting results are summarized in Table 5. Listed are in column (2) the mean velocity of the cores, in columns (3) and (4) the magnitude of the velocity gradient and its direction (the direction of increasing velocity, measured east of north), and in column (5) the total velocity shift across the core (i.e., the product between and core size ).
3.4 Line Widths
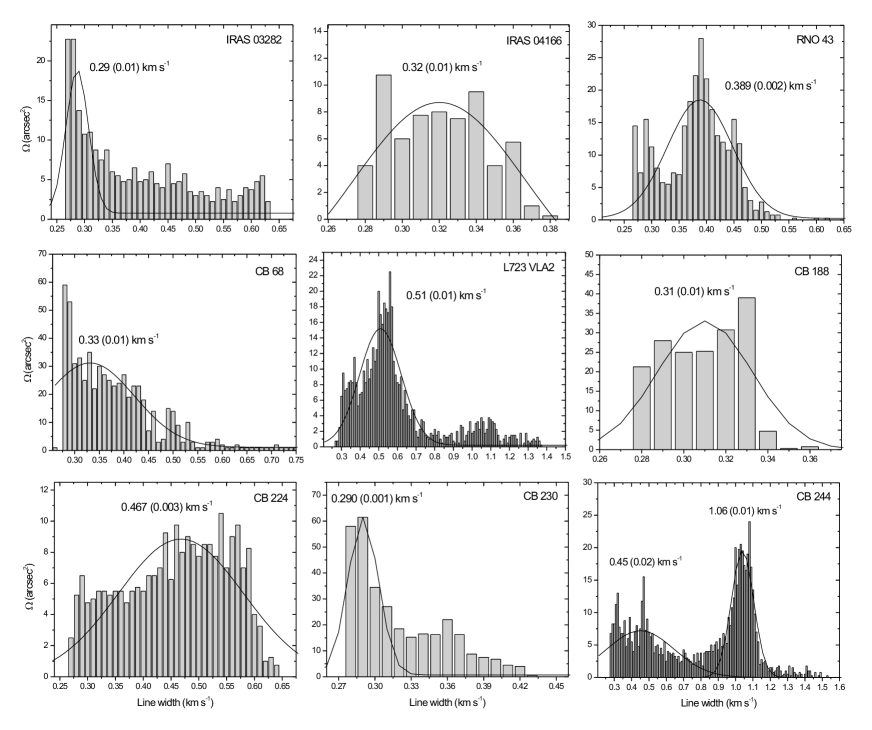
Figure 4 shows the distribution of line widths vs. solid angle area in the maps for the 9 protostars in our sample. The mean line width for each source is then derived through Gaussian fitting to the distribution and is listed in Table 3. We find that the mean line width in our sample is 0.29 0.51 km s-1, with an average of 0.37 km s-1.
The FWHM thermal line width for a gas in LTE at kinetic temperature is given by
| (4) |
where is the Boltzmann constant and is the mass of the observed molecule. Assuming a kinetic gas temperature of 10 K (see Benson & Myers 1989), the thermal contribution to the N2H+ line width is 0.13 km s-1. The typical non-thermal contribution to the line width () is then 0.35 km s-1 , which is about 2.5 times larger than the thermal line width (see discussion in 4.2).
Figure 5 shows the spatial distribution of the N2H+ line width for those 6 Class 0 sources which are not highly elongated (axial ratios 2). In most cases the line widths are roughly constant within the interiors of the cores and broader line widths occur only at the edges. This is consistent with both the NH3 observations by Barranco & Goodman (1998) and the physical picture described by Goodman et al. (1998) that the star-forming dense cores are “velocity coherent” regions of nearly constant line width. The exception, CB 230, is discussed in 4.1.8
4 DISCUSSION
4.1 Description of Individual Sources
4.1.1 IRAS 03282+3035
IRAS 03282 is one of the youngest known Class 0 protostars (André et al. 2000). It is located in the western part of the Perseus molecular cloud complex at a distance of 300 pc (Motte & André 2001). Its bolometric luminosity and total envelope mass are estimated to be 1.2 and 2.9 , respectively (Shirley et al. 2000). IRAS 03282 drives a highly collimated bipolar molecular outflow at P.A. 37∘ with kinematic age 104 yr (Bachiller et al. 1994).
The N2H+ intensity map of IRAS 03282 shows a molecular cloud core that is hour-glass shaped and elongated along P.A. 30 degree, i.e., nearly perpendicular to the axis of the large-scale CO outflow (see Fig. 3). We interpret the hourglass shape as effect of the outflow, which re-releases CO from grain surface back into the gas phase. CO, in turn, destroys the N2H+ molecule (Aikawa et al. 2001). Our OVRO 1.3 mm dust continuum images reveal two mm sources located between the two N2H+ emission peaks (see Fig. 3). The mass ratio and the angular separation of this binary protostar are 0.23 and 15 ( 450 AU at a distance of 300 pc), respectively (Launhardt et al. 2007, in prep.; hereafter LSZ07). The velocity field of IRAS 03282 does not show a symmetrical gradient and the red-shifted N2H+ emission lobe to the northwest of the mm sources matches exactly the red-shifted 13CO lobe, implying that the N2H+ emission in this region is affected by the outflow. Correspondingly, we treat the observed total velocity gradient as upper limit to rotation (see 3.3). Figure 5 shows the line width distribution of IRAS 03282. The average line width across the source is 0.4 0.1 km s-1 and reaches 0.7 km s-1 towards the southern edge of the core.
4.1.2 IRAS 04166+2706
IRAS 04166 is a Class 0 protostar associated with the small dark cloud B 213 in the Taurus molecular cloud complex at a distance 140 pc (Mardones et al. 1997). Its bolometric luminosity and total envelope mass are 0.4 and 1.0 , respectively (Shirley et al. 2000). IRAS 04166 drives a highly collimated, extremely high velocity (up to 50 km s-1) bipolar molecular outflow at P.A. 30∘ (Tafalla et al. 2004).
The N2H+ intensity map of IRAS 04166 shows the same hourglass shape and orientation relative to the outflow as IRAS 03282. We interpret it in the same way. The N2H+ velocity field of IRAS 04166 shows a symmetric gradient, which however matches the red- and blue-shifted CO outflow lobes (see Fig. 3). As for IRAS 03282, we treat the observed total velocity gradient as upper limit to rotation.
4.1.3 RNO 43 MM
The millimeter continuum source RNO 43 MM is associated with the dark cloud L 1582B and the very cold IRAS point source 05295+1247 (detected only at 60 and 100 m). The cloud is physically connected to the Ori molecular ring located at a distance of 400 pc (Zinnecker et al. 1992). RNO 43 MM is the origin of a 3.4 pc long Herbig-Haro flow (HH 243, HH 244, and HH 245; Reipurth et al. 1997) and drives a collimated bipolar molecular outflow at P.A. 60∘ (Arce & Sargent 2004). From its spectral energy distribution (SED) and the ratio of sub-mm to bolometric luminosity, RNO 43MM has been classified a Class 0 source (Bachiller 1996). Its bolometric luminosity and total envelope mass are estimated to be 6.0 and 0.4 , respectively (Zinnecker et al. 1992).
Our N2H+ intensity map of RNO 43MM shows a V-shaped core with two lobes, extending 20′′ to the north and west, respectively (see Fig. 1). The western lobe exhibits much higher (redder) mean velocities than the rest of the core, and is outside the plot scale of Fig. 3 (11 up to 20 km s-1). This jump in velocity probably means that the western lobe belongs to another molecular cloud layer in this direction. In the inner core region (included at 50% contour level), the velocity field exhibits a symmetric structure with a gradient of 5.8 km s-1 pc-1 at P.A. 13∘, approximately perpendicular to the axis of outflow, suggesting rotation (see Fig. 3). The total velocity shift across the inner core is 0.4 km s-1.
4.1.4 CB 68
CB 68 (LDN 146) is a small Bok globule located in the outskirts of the Oph dark cloud complex at a distance of 160 pc (Clemens & Barvainis 1988; Launhardt & Henning 1997). The dense core of the globule exhibits strong, extended, centrally peaked sub-mm/mm dust continuum emission (Launhardt & Henning 1997; Launhardt et al. 1998; Vallée, Bastien, & Greaves 2000) and is associated with the cold IRAS point source 16544–1604. The central source, which was classified as a Class 0 protostar, drives a weak, but strongly collimated bipolar molecular outflow at P.A. 142∘ (Wu et al. 1996; Mardones et al. 1997; Vallée et al. 2000).
Our N2H+ intensity map shows a compact source of about 9′′ FWHM radius, which peaks very close to the mm continuum position. In addition, it exhibits two armlike extensions to northeast and southwest. The velocity field of CB 68 is relatively complicated and shows no systematic gradient which could be interpreted as rotation. There is also no clear correlation with the outflow. As for IRAS 03282, we derive only an upper limit for the rotation velocity gradient.
4.1.5 L723 VLA2
L723 is a small isolated dark cloud located at a distance of 300150 pc (Goldsmith et al. 1984). The IRAS point source at the center of the cloud core is associated with strong far-infrared (Davidson 1987), sub-mm (Shirley et al. 2000) and mm continuum emission (Cabrit & André 1991; Reipurth et al. 1993) and was classified as Class 0 protostar with a bolometric luminosity 3.0 and a circumstellar mass 1.2 (LSZ07). Anglada et al. (1991) detected two radio continuum sources (VLA1 and VLA2) with 15′′ separation, both located within the error ellipse of the IRAS position. However, only VLA2 was found to be associated with dense gas in the cloud core (Girart et al. 1997). Centered at the IRAS position is a large quadrupolar molecular outflow with two well-separated pairs of red and blue lobes: a larger pair at P.A. 110∘ and a smaller pair at P.A. 30∘ (Lee et al. 2002 and references therein). While several scenarios have been proposed to explain the quadrupolar morphology of the large-scale CO outflow, the discovery of a thermal radio jet at the position of VLA2 (Anglada et al. 1996) and of a large-scale H2S(1) bipolar flow (Palacios & Eiroa 1999), both aligned with the larger pair of CO outflow lobes at P.A. 110∘, as well as new high-resolution CO observations (Lee et al. 2002) clearly favor the presence of two independent flows. Indeed, our OVRO mm continuum observations reveal two compact sources in L723 VLA2 separated by 32 (960 AU at a distance of 300 pc), supporting strongly the scenario that the quadrupolar outflow is driven by a binary protostar system (see Launhardt 2004).
The N2H+ intensity map of L723 VLA2 shows a compact source of about 8′′ FWHM diameter, which peaks between the two mm continuum sources. In addition, it shows a long extension to the northwest along the direction of larger outflow. The mean velocity difference between the two continuum positions is 0.4 km s-1. However, the overall velocity field of L723 VLA2 shows that the red-shifted N2H+ emission matches exactly the red-shifted emission of two outflows and the velocity gradient is basically in the same direction as the outflow, suggesting that the outflow has a strong effect on the N2H+ emission. As for IRAS 03282, we therefore treat the observed total velocity gradient as upper limit to rotation. The line widths distribution of L723 VLA2 is shown in Fig. 5. The line widths are about 0.5 km s-1 in the northwest extension, 0.61.0 km s-1 across the core, and reach 1.5 km s-1 towards the eastern edge of the core. We suggest that the relatively large line widths in this source are the result of strong outflow-envelope interaction.
4.1.6 CB 188
CB 188 is a small dark globule at a distance of 300 pc, which harbors a Class I YSO (Launhardt & Henning 1997). A small ( 2′) CO outflow with overlapping red and blue lobes was detected by Yun & Clemens (1994), suggesting the YSO is seen close to pole-on. In our N2H+ intensity map, CB 188 shows a complex clumpy structure (see Fig. 1). It also has the weakest N2H+ emission in our survey (also see the spectra in Fig. 2). This could imply that N2H+ is destroyed during the evolution from Class 0 to Class I, e.g., due to release of CO from grain surfaces in outflows (see Aikawa et al. 2001). We do not further discuss this source in this paper.
4.1.7 CB 224
CB 224 is a Bok globule located at a distance of 400 pc (Launhardt & Henning 1997). Two mm sources were detected in our OVRO survey at an angular separation of 20′′ (LSZ07). The northeast mm source (not shown here) is associated with a cold IRAS source 20355+6343 (3.9 ; Launhardt & Henning 1997), but has no N2H+ emission detected. The southwest source shown in our images, which is classified a Class 0 object (LSZ07), drives a collimated 13CO bipolar outflow at P.A. 120∘ (Chen et al. 2007, in prep.).
The N2H+ intensity map of CB 224 shows the same hourglass morphology perpendicular to the outflow as IRAS 03282 and IRAS 04166 (but slightly more asystematic in intensity). There is a clear and systematic velocity gradient across the core, but the lines of constant velocity are curved in a “C” shape (see Fig. 3). The velocity field cannot be solely interpreted by rotation. The CO outflow seems to have no effect on the N2H+ velocity field because it is oriented in the opposite direction. We speculate that the velocity field is due to a combination of rotation and core contraction. The HCO+ observations in De Vries et al. (2002) indeed indicated signs of infall motions in CB 224.
4.1.8 CB 230
CB 230 (L 1177) is a small, bright-rimmed Bok globule at a distance of 400100 pc (Wolf et al. 2003). The globule contains a protostellar core of total mass 5 and exhibits signatures of mass infall (Launhardt et al. 1997, 1998, 2001). Magnetic field strength and projected direction in the dense core are = 218 50 mG and P.A. = 67∘, respectively (Wolf et al. 2003). The dense core is associated with a large-scale collimated CO outflow at P.A. = 7∘ of dynamical age 2 104 yr (Yun & Clemens 1994; Chen et al. 2007, in prep.). The Mid-IR image of CB 230 suggests the presence of two deeply embedded YSOs separated by 10′′ (Launhardt 2004). Only the western source was detected at 1.3 mm and 3 mm dust continuum, suggesting that the mass of a possible accretion disk around eastern source is below the detection limit. Two bright near-infrared reflection nebulae are associated with the embedded YSOs, but the stars are not directly detected at wavelengths shorter than 5 m. CB 230 is probably a transition object between Class 0 and I.
Our N2H+ intensity map shows that the molecular cloud core is elongated East-West. The velocity field map shows a clear velocity gradient across the core of 8.8 km s-1 pc-1 increasing from east to west along the long axis, i.e., roughly perpendicular to the outflow axis. This strongly supports the view that the two MIR sources form a protobinary system which is embedded in the N2H+ core. This core in turn rotates about an axis perpendicular to the connecting line between the two protostars and parallel to the main outflow. Fig. 5 shows that the line width distribution exhibits a strong peak at the position of the 3 mm continuum source. Together with the velocity field shown in Fig. 3, this can be understood as the result of Keplerian rotation. Morphology and kinematics of this source will be discussed more detailed in another paper.
4.1.9 CB 244
CB 244 (L 1262) is a Bok globule located at a distance of 180 pc (Launhardt & Henning 1997). It is associated with a faint NIR reflection nebula and a cold IRAS point source, and was classified as Class 0 protostar. Its bolometric luminosity and total envelope mass are estimated to be 1.1 and 3.3 , respectively (Launhardt & Henning 1997). CB 244 drives a bipolar molecular outflow at P.A. 130∘ (Yun & Clemens 1994; Chen et al. 2007, in prep.).
The N2H+ intensity map of CB 244 shows an elongated structure in the direction from Northwest to Southeast, approximately perpendicular to the direction of outflow (see Fig. 3). The velocity field of CB 244 exhibits a complicated structure and maybe dominated by effects other than rotation. As for other sources, we assume that the total observed velocity gradient puts an upper limit to the rotation. The distribution of line widths for this source shows two distinct peaks (see Fig. 4). The smaller line widths originate from the southeastern part of the core where the protostar is embedded, while the larger widths are found in the northwestern extension only (see Fig. 1). Therefore, we adopted the smaller peak value as representative for CB 244.
4.2 Turbulent Motions
At a kinetic gas temperature of 10 K, the typical non-thermal line width in our sample (0.35 km s-1) is about 2.5 times lager than the thermal line width (0.13 km s-1) (see 3.4). The origin of the non-thermal line width in such cores is subject of an ongoing debate in the literature. Generally, turbulence is suggested to be the main contribution (see e.g., Barranco & Goodman 1998 and Goodman et al. 1998), but infall, outflow, and rotation may also contribute to the non-thermal line width.
With the exception of L723 VLA2, there appears to be no spatial correlation between regions of increased line width and outflow features (see Fig. 5). CB 230 may represent a special case where Keplerian rotation of a large circumstellar disk causes the large non-thermal line width in the central region (see Fig. 5). To avoid a bias from localized line-broadening due to outflows and/or Keplerian rotation, we estimated the observed mean line width through Gaussian fitting to the distribution of line widths vs. area in the maps (see Fig. 4). The non-thermal contribution to these mean line widths are listed in Table 3. We assume that these mean non-thermal line widths are dominated by turbulence. The thermal FWHM line width of an “average” particle of mass 2.33 mH, which represents the local sound speed, would be 0.44 km s-1 at 10 K. The mean observed non-thermal line width is 1.3 times smaller than this value, which means that turbulence in these cores is subsonic.
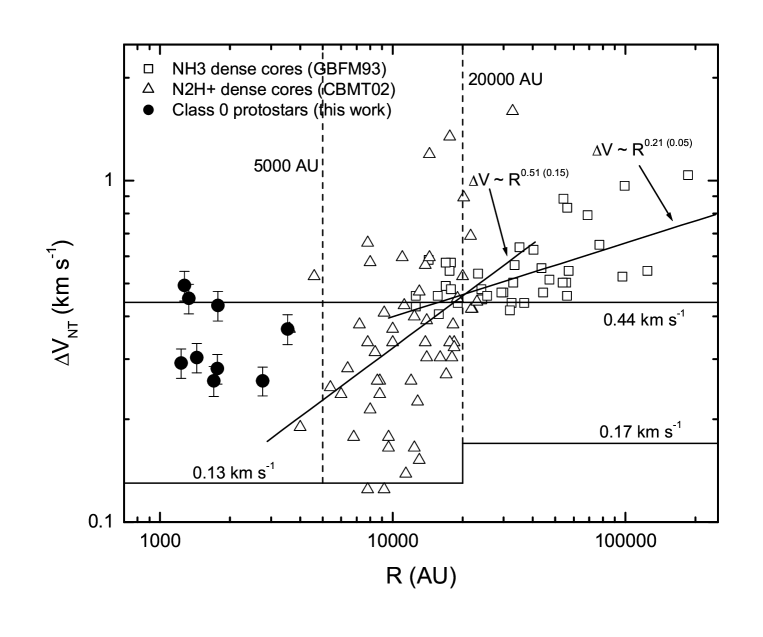
Figure 6 shows the distribution of non-thermal line width with core size for the objects in our sample, together with the dense cores from GBFM93 and CBMT02. It shows that high-level (supersonic) turbulence normally occurs in large-scale cores only. In the cores traced by NH3 ( 20000 AU 0.1 pc), the non-thermal line widths decrease with core size with a power-low index 0.2, while in those traced by N2H+ (CBMT02; 5000 AU 20000 AU), the line widths decrease with an index of 0.5. This suggests that non-thermal motions are more quickly damped in smaller cores (see also Fuller & Myers 1992). Comparing our data with CBMT02, we find that the relation between line width and core size no longer holds at 10000 AU, suggesting the inner parts of dense cores are “velocity coherent”. The radius at which the gas becomes “coherent” is less than 0.1 pc, as suggested in Goodman et al. (1998). Also note that the mean non-thermal line width in our sample (0.35 km s-1) is even larger than the widths in some larger scale dense cores (see Fig. 6). We speculate that the heating from an internal protostar, as well as related activities, like e.g., infall and/or outflow, contribute to the line widths in these protostellar cores.
4.3 Systematic Gas Motions: Fast Rotation of Protostellar Cores
For the fragmentation model of binary star formation, some initial angular momentum must be present; otherwise the cores will collapse onto a single star. The source of this angular momentum is generally suggested to be the bulk rotation of the core. As suggested in the earlier study by GBFM93, rotation is a common feature of dense cores in molecular clouds. In our observations, most objects show well-ordered velocity fields with symmetric gradients and the motions of several objects could be interpreted as bulk rotation. The preliminary results from our ATCA and PdBI observations show similar well-ordered velocity fields (Paper II&III, in prep.), supporting the view in GBFM93.
Up to now only a few Class 0 objects have been studied in detail kinematically. Typical examples are the nearby, isolated object IRAM 04191+1522 (IRAM 04191 for short; see Belloche et al. 2002), or NGC 1333 IRAS 4A (IRAS 4A for short; see Di Francesco et al. 2001 and Belloche et al. 2006), which is actually a binary protostar at a separation of 600 AU (Looney et al. 2000). Below, we analyze our 8 Class 0 objects together with these two sources. Of the 8 Class 0 targets, CB 230, IRAS 03828, and L723 VLA2 are resolved as binary protostars by our mm observations, while IRAS 04166, RNO 43, CB 68, CB 224, and CB 244 remain single or unresolved. We treat RNO 43 and CB 230 as objects which provide reliable rotation velocity gradients and take the other 6 measurements as upper limits. The ASURV222ASURV Rev.1.2 (LaValley, Isobe & Feigelson 1992) is a software package which implements the methods presented in Feigelson & Nelson (1985). For details see http://astrostatistics.psu.edu/. software package was used for the statistical analysis of the results. This package performs a “survival analysis” which takes into account upper limits and allows to compute a statistical sample mean. It must, however, be noted that two real measurements and 6 upper limits are not sufficient to derive statistically significant correlations.
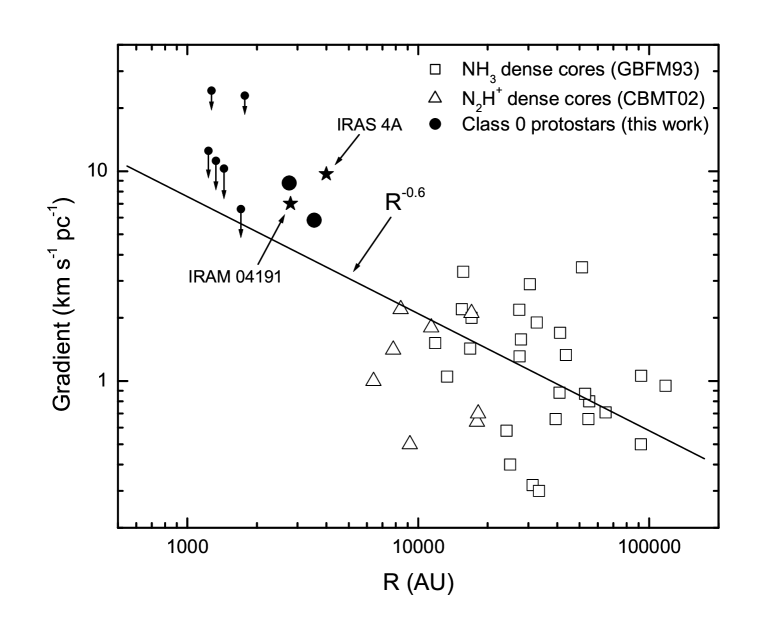
The velocity gradients derived in our sample range from 5.8 to 24.2 km s-1 pc-1 (see Table 5). The mean value derived by the cumulative Kaplan-Meier (KM) estimator in ASURV is 7.00.8 km s-1 pc-1. This result is consistent with the gradients derived in IRAM 04191 ( 7 km s-1 pc-1) and IRAS 4A ( 9.3 km s-1 pc-1), but it is much larger than the velocity gradients of dense cores derived from single-dish observations in GBFM93 and CBMT02 (12 km s-1 pc-1). The correlation between velocity gradient () and core size () is shown in Figure 7. It shows a clear trend with smaller cores ( 5000 AU) having larger velocity gradients. Taking into account only RNO 43 and CB 230, the entire dataset could be fitted by a relation of -0.6±0.1, which is steeper than the slope of obtained by GBFM93 for the larger scale cores only. As expected, smaller (more evolved) protostellar cores rotate much faster than larger (prestellar) cores.
4.4 Constraints on Angular Momentum
Assuming the velocity gradients are due to core rotation, the specific angular momentum of the objects can be calculated with the following equation (see GBFM93):
| (5) |
where the coefficient = , is the power-law index of the radial density profile (here we adopt = 1.5), is the velocity gradient, and is the inclination angle to the line of sight direction. Here we assume to be 1 for all sources. The derived specific angular momenta for our 8 Class 0 protostars are listed in column (6) in Table 5. We derived values between 0.12 and 0.45 10-3 km s-1 pc, with a KM sample mean of 0.210.1 10-3 km s-1 pc.
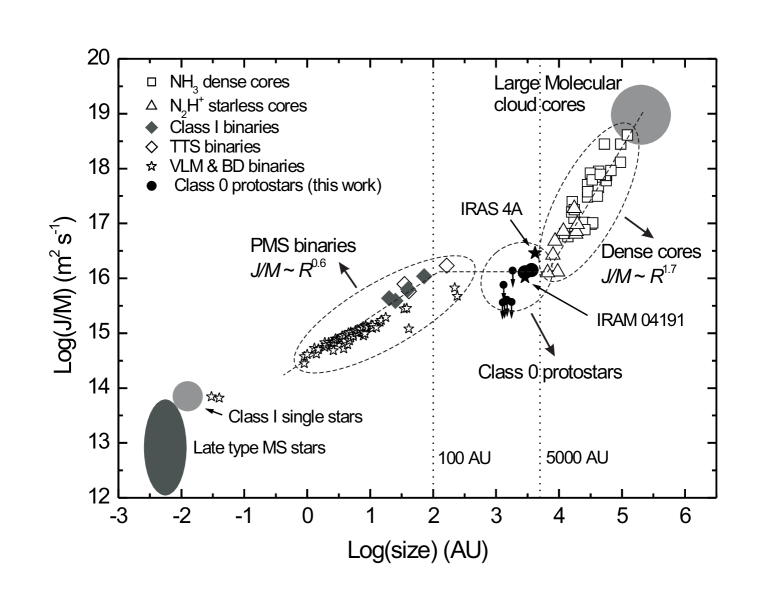
In Figure 8 we show the distribution of specific angular momentum vs. size scale for Class 0 single (unresolved) and binary protostars (this work), together with molecular cloud cores, PMS binary stars, and single stars, etc. The data of NH3 dense cores and N2H+ starless cores are from GBFM93 and CBMT02, respectively. For PMS binary stars, the specific orbital angular momenta are derived as = (where is the total stellar mass, is the separation, and is the mass ratio). Data of Class I and T Tauri binaries are from Chen et al. (Paper IV, in prep.)333The masses of Class I and T Tauri binaries are dynamic masses. The angular momentum plotted in Fig. 8 for these binaries does not include the angular momentum from the stellar rotation.; data of very low-mass ( 0.1 ) and brown dwarf binaries are from Burgasser et al. (2007). The specific angular momentum of Class I single stars is derived from = , where of 38 km s-1 and of 2.7 are mean values from the sample of Class I stars in Covey et al. (2005) and adopted as representative values here.
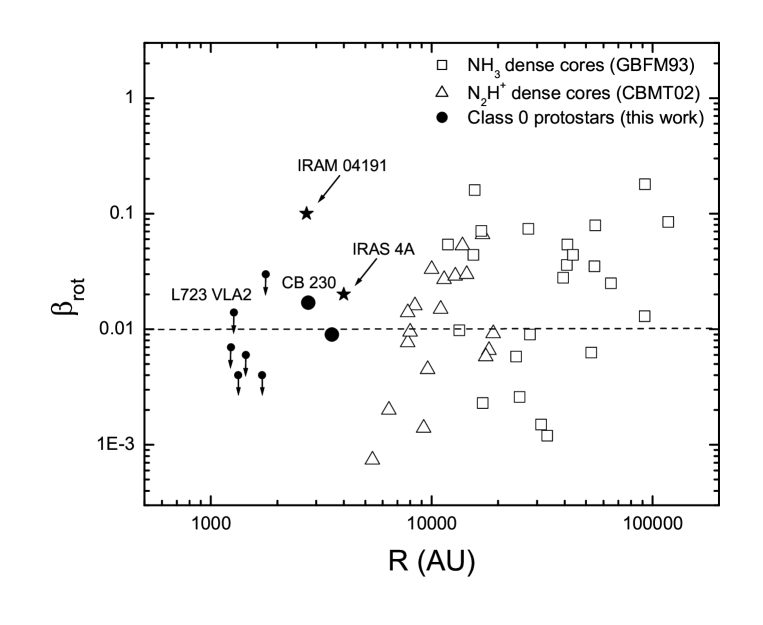
As shown in Fig. 8, there is a strong correlation between and size scale in dense cores ( 5000 AU). The data can be fitted with a power-law correlation of , which is consistent with the index obtained by GBFM93. This means that in these dense cores the angular velocity is locked at a constant value to the first order, which is generally explained by the mechanism of magnetic braking (see Basu & Mouschovias 1994). In addition, Fig. 8 shows that the mean value in this region is considerably ( 2 magnitudes) larger than the typical orbital angular momentum of T Tauri binary systems. However, stars are not formed from the entire cloud (large dense cores), but only from the dense inner 5000 AU part of the cores that undergoes dynamical gravitational collapse and decouples from the rest of the cloud. Fig. 8 shows that such cores have almost the same specific angular momentum as the widest (few hundred AU) PMS binaries. But, there is a gap in size scale between the smallest prestellar cores and the widest binaries. We find that the specific angular momenta of Class 0 protostellar cores are located in this gap, but nearly indistinguishable from those of wide PMS binary systems, i.e., angular momentum is basically maintained (conserved) from the smallest prestellar cores via protostellar cores to wide PMS binary systems. In the context that most protostellar cores are assumed to fragment and form binary stars, this means that most of the angular momentum contained in the collapse region is transformed into orbital angular momentum of the resulting stellar binary system.
4.5 Energy Balance
In this section we estimate the contribution of different terms to the total energy balance of the protostellar cores in our sample. In Table 6 we summarize the basic equations and the estimated ratios for the rotational, thermal, and turbulent energy to the gravitational potential energy. Here we assume a mean kinetic gas temperature 10 K for all objects. The masses and radii used in the equations are virial masses and FWHM radii listed in Table 4.
The ratios of thermal and turbulent energy to gravitational potential energy ( 0.26 and 0.15) show that in these protostellar cores both thermal and turbulent contribution together appear to dominate the support of the cores, but the thermal contribution 2 times outweighs turbulence. The estimated values range from 0.004 to 0.017, with a KM sample mean of 0.0070.002, which is much lower than and . This suggests that rotation is not dominating in the support of the protostellar cores. When we apply the equilibrium virial theorem 2[] + = 0 (in the absence of magnetic fields), we find that all the Class 0 protostellar cores in our sample are slightly supercritical (see Table 6).
Although the rotation energy is relatively small, it is thought to play an important role in the fragmentation process (see reviews by Bodenheimer et al. 2000 and Tholine 2002). In general, if is very large (), a gas cloud can be stable against dynamical collapse, potentially inhibiting fragmentation and star formation. However, if is very small, a cloud will not have enough rotational energy to experience fragmentation. Boss (1999) has shown that rotating, magnetized cloud cores fragment when 0.01 initially444Machida et al. (2005) find that the fragmentation does occur in rotating, magnetized clouds when 0.04, considering magnetic fields suppress fragmentation.. It should be noted that three sources in our sample might have a 0.01. Of these, CB 230 ( 0.017) and L723 VLA2 ( 0.014) have been resolved as binary protostars. On the other hand, IRAS 03282, a resolved binary protostar, has a very low ( 0.004), and IRAS 04166, a single (unresolved) protostar, has value close to 0.01. Thus, our observations can neither confirm nor disprove a relation between and fragmentation. This could be due to low-number statistics combined with observational uncertainties. Figure 9 shows the distribution of with core size for our sample, together with the cores from GBFM93 and CBMT02. It shows that is roughly independent of , as suggested before by GBFM93.
5 Summary and Conclusions
We present N2H+ (1-0) observations of 9 isolated low-mass protostellar cores using the OVRO mm array. The main conclusions of this work are summarized as follows:
(1) N2H+ emission is detected in all target objects and the emission is spatially consistent with the thermal dust continuum emission. The mean excitation temperature of the N2H+ line is 4.9 K. The mean FWHM core radius is = 2000 800 AU. The derived virial masses of the N2H+ cores in our sample range from 0.3 to 1.2 , with a mean value of 0.6 . The corresponding mean hydrogen number densities range from 106 to 107 cm-3. The N2H+ column densities in our sample range from 0.6 to 2.8 1012 cm-2, with a mean value of 1.4 1012 cm-2. The average fractional abundances of N2H+, calculated by relating the N2H+ column densities derived from the line strength to the virial masses, was found to be 3.3 10-10. This is consistent with the result obtained in other surveys with single-dish observations.
(2) The observed mean line widths range from 0.29 to 0.51 km s-1, with a mean value of 0.37 km s-1. The non-thermal contribution is about 2.5 times larger than the thermal line width, suggesting that the protostellar cores in our sample are not purely thermally supported. We find that line widths are roughly constant within the interiors of the cores and larger line widths only occur at the edges of the cores. We conclude that turbulence is not negligible but subsonic in the protostellar cores.
(3) We derive the N2H+ velocity fields of eight Class 0 protostellar cores. CB 230 and RNO 43 show symmetrical velocity gradients that can be explained by bulk rotation. In L723 VLA2, IRAS 03282, and IRAS 04166, outflow-envelope interaction appears to dominate the velocity fields. CB 68, CB 224, and CB 244 show complicated velocity fields, which could be affected by infall or large-scale turbulence. We argue that in these cores the observed velocity gradients provide an upper limit to any underlying bulk rotation.
(4) The velocity gradients over the cores range from 6 to 24 km s-1, with a mean value of 7 km s-1 pc-1. This is much larger than what has been found in single-dish observations of prestellar cores, but agrees with recent interferometric observations of other Class 0 protostellar cores. Assuming these gradients are due to rotation, the comparison between gradients and core sizes suggests that smaller (evolved) protostellar cores rotate much faster than larger dense (prestellar) cores. The data could be fitted by a relation of .
(5) We find that in terms of specific angular momentum and size scale Class 0 protostellar cores fill the gap between dense molecular cloud cores and PMS binary systems. There appears to be no evolution (decrease) of angular momentum from the smallest prestellar cores via protostellar cores to wide PMS binary system. In the context that most protostellar cores are assumed to fragment and form binary stars, this means that most of the angular momentum contained in the collapse region is transformed into orbital angular momentum of the resulting stellar binary system.
(6) Both thermal and turbulent energy together dominate the support against gravity, but the thermal contribution is about 2 times larger than turbulence. All protostellar cores in our sample are found to be slightly virially supercritical.
(7) The ratio of rotational energy to gravitational energy is relatively small in our sample, ranging from 0.004 to 0.02, with a mean value of 0.007. We find that values in our sample show no clear correlation with observed binary protostars. On the other hand, the three identified binary protostars are also not distinguished by values. This could be due to low-number statistics combined with observational uncertainties.
References
- Aikawa et al. (2001) Aikawa, Y., Ohashi, N., Inutsuka, S. I. et al. 2001, ApJ, 552, 639
- André et al. (2000) André, P., Ward-Thompson, D., & Barsony, M. 2000, in Protostars and Planets IV, ed. V. Mannings, A. P. Boss, & S. S. Russell (Tucson: Univ. Arizona Press), 59
- Anglada et al. (1991) Anglada, G., Estalella, R., Rodriguez, L. F., Torrelles, J. M., Lopez, R., & Canto, J. 1991, ApJ, 376, 615
- Anglada et al. (1996) Anglada, G., Rodriguez, L. F., & Torrelles, J. M. 1996, ApJ, 473, L123
- Arce & Sargent (2004) Arce, H. G., & Sargent, A. I. 2004, ApJ, 624, 232
- Bachiller (1996) Bachiller, R. 1996, ARA&A, 34, 111
- Bachiller et al. (1994) Bachiller, R., Terebey, S., Jarrett, T., Martin-Pintado, J., Beichman, C. A., & van Buren, D. 1994, ApJ, 437, 296
- (8) Barranco, J. A, & Goodman, A. 1998, ApJ, 504, 207
- (9) Basu, S., & Mouschovias, T. C. 1994, ApJ, 432, 720
- Bate (2000) Bate, M. R. 2000, MNRAS, 314, 33
- Bate & Bonnell (1997) Bate, M. R., & Bonnell, I. A. 1997, MNRAS, 285, 33
- (12) Belloche, A., André, P., Despois, D., & Blinder, S. 2002, A&A, 393, 927
- (13) Belloche, A., Hennebelle, P., & André, P. 2006, A&A, 453, 145
- (14) Benson, P. J., Caselli, P., & Myers, P. C., 1998, ApJ, 506, 743
- (15) Benson, P. J., & Myers, P. C. 1989, ApJS, 71, 89
- (16) Bergin, E. A., Ciardi, D. R., Lada, C. J., Alves, J., & Lada, E. A. 2001, ApJ, 557, 209
- Bergin & Langer (1997) Bergin, E. A., Langer, W. D. 1997, ApJ, 486, 316
- Bodenheimer et al. (2000) Bodenheimer, P., Burkert, A., Klein, R. I., & Boss, A. P. 2000, in Protostars and Planets IV, ed. V. Mannings, A. P. Boss, & S. R. Russell (Tucson: Univ. Arizona Press), 675
- (19) Boss, A. P. 1999, ApJ, 520, 744
- (20) Briggs, D. S., Schwab, F. R., & Sramek, R. A. 1999, ASPC, 180, 127
- (21) Burgasser, A. J., Reid, I. N., Siegler, N. et al. 2007, in Protostars and Planets V, ed. B. Reipurth, D. Jewitt, & K. Keil (Tucson: Univ. Arizona Press), 427
- (22) Cabrit, S., & André, P. 1991, ApJ, 379, 25
- Caselli et al. (2002) Caselli, P., Benson, P. J., Myers, P., & Tafalla, M. 2002, ApJ, 572, 238 (CBMT02)
- (24) Caselli, P., Walmsley, C. M., Tafalla, M., Dore, L., & Myers, P. C. 1999, ApJ, 523, L165
- Caselli (1995) Caselli, P., Myers, P. C., Thaddeus, P. 1995, ApJ, 455, L77
- Clemens & Barvainis (1988) Clemens, D. P., & Barvainis, R. 1988, ApJS, 68, 257
- (27) Covey, K. R., Greene, T. P., Doppmann, G. W., & Lada, C. J. 2005, AJ, 129, 2765
- (28) Davidson, J. A. 1987, ApJ, 315, 602
- (29) De Vries, Ch. H., Narayanan, G., & Snell, R. L. 2002, ApJ, 577, 798
- (30) Di Francesco, J., Myers, P. C., & Wilner, D. J. et al. 2001, ApJ, 562, 770
- (31) Duchêne, G., Delgado-Donate, E., Haisch, K. E., Loinard, L., & Rodríguez, L. 2007, in Protostars and Planets V, ed. B. Reipurth, D. Jewitt, & K. Keil (Tucson: Univ. Arizona Press), 379
- (32) Feigelson, E. D., & Nelson, P. I., 1985, ApJ, 293, 192
- (33) Forveille, T. Guilloteau, S., & Lucas, R. 1989, CLASS Manual (Grenoble: IRAM)
- (34) Fuller, G. A., & Myers, P. C. 1992, ApJ, 384, 523
- (35) Girart, J. M., Estalella, R., Anglada, G., Torrelles, J. M., Ho, P. T. P., & Rodriguez, L. F. 1997, IAU Symp. 182: Herbig-Haro Flows and the Birth of Stars, 182, 266
- Goldsmith et al. (1984) Goldsmith, P. F., Snell, R. L., Hemeon-Heyer, M., & Langer, W. D. 1984, ApJ, 286, 599
- (37) Goodman, A. A., Barranco, J. A., Wilner, D. J., & Heyer, M. H. 1998, ApJ, 504, 223
- Goodman et al. (1993) Goodman, A. A., Benson, P. J., Fuller, G. A., & Myers, P. C. 1993, ApJ, 406, 528 (GBFM93)
- (39) Halbwachs, J. L., Mayor, M., Udry, S., & Arenou, F. 2003, A&A, 397, 159
- (40) Launhardt R. 2001, in The Formation of Binary Stars, IAU Symp. 200, ed. H. Zinnecker, & R. D. Mathieu (San Francisco: ASP), 117
- Launhardt (2004) Launhardt, R. 2004, in IAU Symp. 221, Star Formation at High Angular Resolution, ed. M. G. Burton, R. Jayawardhana, & T. L. Bourke (San Francisco: ASP), 213
- Launhardt et al. (1998) Launhardt, R., Evans, N. J., Wang, Y., Clemens, D. P., Henning, T., & Yun, J. L. 1998, ApJS, 119, 59
- Launhardt & Henning (1997) Launhardt, R., & Henning, T. 1997, A&A, 326, 329
- (44) LaValley, M., Isobe, T., & Feigelson, E. D., 1992, “ASURV”, Bull. Am. Astron. Soc.
- (45) Lee, C., Mundy, L. G., Stone, J. M., & Ostriker, E. C. 2002, ApJ, 576, 294
- (46) Looney, L. W., Mundy, L. G., & Welch, W. J. 2000, ApJ, 529, 477
- (47) Machida, M. N., Matsumoto, T., Hanawa, T., & Tomisaka, K. 2005, MNRAS, 362, 382
- Mardones et al. (1997) Mardones, D., Myers, P. C., Tafalla, M., Wilner, D. J., Bachiller, R., & Garay, G. 1997, ApJ, 489, 719
- Mathieu et al. (2000) Mathieu, R. D., Ghez, A. M., Jensen, E. L. N., & Simon, M. 2000, in Protostars and Planets IV, ed. V. Mannings, A. P. Boss, & S. R. Russell (Tucson: Univ. Arizona Press), 703
- (50) Motte, F., & André, P. 2001, A&A, 365, 440
- (51) Padin, S., Scott, S. L., Woody, D. P., et al. 1991, PASP, 103, 461
- (52) Palacios, J., & Eiroa, C. 1999, A&A, 346, 233
- (53) Reipurth, B., Bally, J., & Devine, D. 1997, AJ, 114, 2708
- (54) Reipurth, B., Chini, R., Krugel, E., Kreysa, E., & Sievers, A. 1993, A&A, 273, 221
- (55) Reipurth, B., Jewitt, D., & Keil, K. (ed.) 2007, Protostars and Planets V (Tucson: Univ. Arizona Press)
- Sault et al. (1995) Sault, R. J., Teuben, P. J., & Wright, M. C. H. 1995, in ASP Conf. Ser. 77, Astronomical Data Analysis Software and Systems IV, ed. R. A. Shaw, H. E. Payne, & J. J. E. Hayes (San Francisco: ASP), 443
- Scoville et al. (1993) Scoville, N. Z., Carlstrom, J. E., Chandler, C. J. et al. 1993, PASP, 105, 1482
- (58) Shirley, Y. L., Evans II, N. J., Rawlings, J. M. C., & Gregersen, E. M. 2000, ApJS, 131, 249
- (59) Tafalla, M., Santiago, J., Johnstone, D., & Bachiller, R. 2004, A&A, 423, L21
- Tohline (2002) Tohline, J. E. 2002, ARA&A, 40, 349
- (61) Turner, B. E., & Thaddeus, P. 1977, ApJ, 211, 755
- Vallee et al. (2000) Vallée, J. P., Bastien, P., & Greaves, J. S. 2000, ApJ, 542, 352
- Volgenau et al. (2006) Volgenau, N. H., Mundy, L. G., Looney, L. W., & Welch, W. J. 2006, ApJ, 651, 301
- (64) Wang, Y., Evans II, N. J., Zhou, S., & Clemens, D. P. 1995, ApJ, 454, 217
- (65) Williams, J. P., de Geus, E. J., & Blitz, L. 1994, ApJ, 428, 693
- Wolf et al. (2003) Wolf, S., Launhardt, R., & Henning, T. 2003, ApJ, 592, 233
- (67) Womack, M., Ziurys, L. M., & Wyckoff, S. 1992, ApJ, 387, 417
- Wu et al. (1996) Wu, Y., Huang, M., & He, J. 1996, A&AS, 115, 283
- Yun & Clemens (1994) Yun, J. L. & Clemens, D. P. 1994a, AJ, 108, 612
- Yun & Clemens (1994) Yun, J. L. & Clemens, D. P. 1994b, ApJS, 92, 145
- (71) Zinnecker, H., & Mathieu, R. D. (ed.) 2001, IAU Symposium. 200, The Formation of Binary stars (San Francisco: ASP)
- (72) Zinnecker, H., Bastien, P., Arcoragi, J. P., & Yorke, H. W. 1992, A&A, 265, 726
| Source | Associated | Outflow | Infall | Class | Refs. | ||||
|---|---|---|---|---|---|---|---|---|---|
| Name | IRAS source | [pc] | [L⊙] | [K] | [M⊙] | ||||
| IRAS 03282 | 03282+3035 | 300 | 1.2 | 23 | 2.9 | y, bipol, coll. | y | 0 | 1,2,3 |
| IRAS 04166 | 04166+2706 | 140 | 0.4 | 91 | 1.0 | y, bipol, coll. | y | 0 | 1,3,4 |
| RNO 43 MM | 05295+1247 | 400 | 6.0 | 0.4 | y, bipol, coll. | 0 | 5,6 | ||
| CB 68 | 165441604 | 160 | 1.6 | 74 | 3.5 | y, bipol, coll. | 0 | 7,8 | |
| L723 VLA2 | 19156+1906 | 300 | 3.3 | 47 | 7.3 | y, quadrupol. | 0 | 3,9 | |
| CB 188 | 19179+1129 | 300 | 2.6 | 0.7 | y, bipol | I | 8,10 | ||
| CB 224 | 20355+6343 | 400 | 16 | 6.6 | y, bipol | y | 0/I | 11,12,13 | |
| CB 230 | 21169+6804 | 400 | 8.2 | 5.1 | y, bipol, coll. | y | 0/I | 10,11,12 | |
| CB 244 | 23238+7401 | 180 | 1.1 | 56 | 3.3 | y, bipol | y | 0 | 8,10,14 |
Note. — References. — (1) Mardones et al. 1997; (2) Bachiller et al. 1994; (3) Shirley et al. 2000; (4) Tafalla et al. 2004; (5) Zinnecker et al. 1992; (6) Arce & Sargent 2004; (7) Vallée et al. 2000; (8) Launhardt & Henning 1997; (9) Lee et al. 2002; (10) Yun & Clemens 1994; (11) Wolf et al. 2003; (12) Launhardt et al. 1998; (13) Chen et al. in prep.; (14) Wang et al. 1995
| Source | Other | R.A. & Dec. (1950)a | Array | UV coverage | HPBWb | rms |
|---|---|---|---|---|---|---|
| Name | Name | [h : m : s, ] | configuration | [k] | [arcsecs] | [mJy/beam] |
| IRAS 03282 | … | 03:28:15.2, +30:35:14 | CLE | 3–36 | 5.54.3 | 76 |
| IRAS 04166 | B 213 | 04:16:37.8, +27:06:29 | CLU | 3–145 | 4.84.2 | 45 |
| RNO 43 MM | L 1582B | 05:29:30.6, +12:47:35 | CLEH | 3–68 | 5.34.7 | 52 |
| CB 68 | L 146 | 16:54:27.2, 16:04:44 | CLH | 3–62 | 8.45.0 | 71 |
| L723 VLA2 | … | 19:15:41.8, +19:06:45 | CLE | 3–36 | 5.54.5 | 81 |
| CB 188 | … | 19:17:54.1, +11:30:02 | CLEU | 3–127 | 4.44.1 | 55 |
| CB 224 | L 1100 | 20:35:30.6, +63:42:47 | CL | 3–36 | 5.45.1 | 97 |
| CB 230 | L 1177 | 21:16:53.7, +68:04:55 | CL | 3–36 | 7.16.4 | 63 |
| CB 244 | L 1262 | 23:23:48.5, +74:01:08 | CL | 3–36 | 6.35.2 | 86 |
| Source | b | c | ||||
|---|---|---|---|---|---|---|
| Name | (km s-1) | (K) | (km s-1) | (km s-1) | (km s-1) | |
| IRAS 03282 | 6.890.01 | 4.980.05 | 1.380.08 | 0.510.03 | 0.290.01 | 0.260.02 |
| IRAS 04166 | 6.640.02 | 4.080.13 | 1.760.18 | 0.340.01 | 0.320.01 | 0.290.02 |
| RNO 43 | 9.770.01 | 5.150.25 | 0.770.01 | 0.410.02 | 0.390.01 | 0.370.02 |
| CB 68 | 5.260.04 | 4.250.04 | 1.380.09 | 0.370.04 | 0.330.01 | 0.300.02 |
| L723 VLA2 | 11.000.02 | 5.740.21 | 0.780.03 | 1.070.04 | 0.510.01 | 0.490.02 |
| CB 188 | 7.230.02 | 4.580.08 | 0.730.04 | 0.380.03 | 0.310.01 | 0.280.02 |
| CB 224 | 2.650.01 | 4.610.04 | 1.750.08 | 0.500.03 | 0.470.01 | 0.450.02 |
| CB 230 | 2.780.01 | 5.490.13 | 1.540.04 | 0.360.01 | 0.290.01 | 0.260.02 |
| CB 244 | 3.240.01 | 4.930.11 | 1.090.16 | 0.380.02 | 0.450.02 | 0.430.03 |
| Source | a | |||||
|---|---|---|---|---|---|---|
| [AU] | [] | [105 cm-3] | [1012cm-2] | [10-10 ] | [10-10] | |
| IRAS 03282 | 1703 | 0.42 | 22.6 | 1.81 | 1.57 | 5.11 |
| IRAS 04166 | 1232 | 0.30 | 43.6 | 0.96 | 0.31 | 1.41 |
| RNO 43 MM | 3530 | 1.21 | 7.4 | 0.82 | 2.32 | 2.60 |
| CB 68 | 1440 | 0.37 | 33.7 | 0.93 | 0.51 | 1.83 |
| L723 VLA2 | 1272 | 0.65 | 84.4 | 2.84 | 1.89 | 3.96 |
| CB 188 | 1763 | 0.44 | 21.6 | 0.57 | 0.46 | 1.42 |
| CB 224 | 1329 | 0.57 | 64.7 | 1.95 | 2.07 | 4.97 |
| CB 230 | 2762 | 0.71 | 9.0 | 1.52 | 3.86 | 7.41 |
| CB 244 | 1774 | 0.72 | 34.9 | 0.96 | 0.69 | 1.30 |
| mean velocity | |||||
|---|---|---|---|---|---|
| Source | [km s-1] | [km s-1 pc-1] | [degree] | [km s-1] | [10-3 km s-1 pc] |
| IRAS 03282 | 6.91 | 6.6 | 70.81.2 | 0.11 | 0.12 |
| IRAS 04166 | 6.64 | 12.5 | -134.21.7 | 0.15 | 0.12 |
| RNO 43 MM | 9.72 | 5.80.1 | -23.11.0 | 0.21 | 0.45 |
| CB 68 | 5.15 | 10.30.2 | 161.20.8 | 0.15 | 0.13 |
| L723 VLA2 | 11.03 | 24.2 | -139.20.2 | 0.30 | 0.24 |
| CB 224 | -2.67 | 11.2 | -82.71.0 | 0.15 | 0.12 |
| CB 230 | 2.69 | 8.80.1 | -54.00.4 | 0.24 | 0.42 |
| CB 244 | 3.51 | 22.9 | 51.20.2 | 0.41 | 0.45 |
| Source | () | ||||
|---|---|---|---|---|---|
| IRAS 03282 | 1.34 | 0.004 | 0.33 | 0.11 | 0.11 |
| IRAS 04166 | 0.99 | 0.007 | 0.33 | 0.14 | 0.05 |
| RNO 43 MM | 5.51 | 0.009 | 0.24 | 0.16 | 0.19 |
| CB 68 | 1.29 | 0.006 | 0.31 | 0.14 | 0.08 |
| L723 VLA2 | 4.36 | 0.014 | 0.16 | 0.19 | 0.27 |
| CB 224 | 3.19 | 0.004 | 0.19 | 0.19 | 0.23 |
| CB 230 | 2.40 | 0.017 | 0.31 | 0.11 | 0.12 |
| CB 244 | 3.91 | 0.03 | 0.20 | 0.18 | 0.18 |