Present address: ]Department of Physics, National University of Singapore, Singapore 117542
Also at: ]Department of Physics, Huainan Normal University, Huainan, Anhui 232001, P. R. China
The radial breathing-like mode of the collapsed Single-walled carbon nanotube bundle under hydrostatic pressure
Abstract
Using the first principles calculations we have studied the vibrational modes and Raman spectra of a (10, 10) single-walled carbon nanotube (SWNT) bundle under hydrostatic pressure. Detailed analysis shows that the original radial breathing mode (RBM) of the SWNT bundle disappears after the structural phase transition (SPT). And significantly a RBM-like mode appears at about 509 cm-1, which could be considered as a fingerprint of the SPT happened in the SWNT bundle, and further used to determine the microscopic structure of the bundle after the SPT.
pacs:
61.46.+w, 63.22.+m, 78.30.NaThe carbon nanotubes (CNTs) have attracted much attention since their discovery [1] due to their remarkable electronic and mechanical properties [2], and potential applications in future nanoscale electronic devices. It is well known that the physical properties of the CNTs depend much on their geometrical structures, and so can be easily changed by an applied pressure or strain, which could be used to fabricate the nanoscale electromechanical coupling devices and transducers. For example, a uniaxial strain on the SWNTs can cause a metal-semiconductor transition [3].
Recently, the effect of hydrostatic pressure on the CNT bundle, including the Raman spectroscopy investigation, has attracted much attention in experiments [4-10] and theoretical calculations [11-15]. It is reported that the intensity and broadening of band decrease with increasing pressure and the RBM vanishes above a critical pressure [4-7], showing a SPT at this pressure. Meantime, the Raman spectra [4], synchrotron X-ray diffraction data [8] and the optical absorption spectra [9] showed that the changes of geometrical structure and optical properties are reversible upon unloading the pressure. Sluiter and Kawazoe [11] used the continuum model to calculate the complete phase diagram of the carbon nanotube bundle under hydrostatic pressure. For the (10,10) SWNT bundle, their results indicate, if considering stable states only, tube’s cross sections are round up to 1.9 GPa, racetrack shaped between 1.9 and 6.0 GPa. But until now, how to verify their predictions experimentally is still an open question, meanwhile no detailed theoretical analysis on the vibrational properties and Raman spectra of CNT bundle under hydrostatic pressure has been made, which is just what we attempt to do in this paper.
The Raman spectroscopy has been considered as a powerful tool to detect the diameter-selective phonon modes of the SWNTs [16-18]. An important low-frequency Raman peak is attributed to the RBM ( band), where all carbon atoms are subject to an in-phase radial displacements. It was found that the RBM frequency is inversely proportional to the tube diameter, and independent of its chirality. And the higher frequency peaks are caused by the out-of-phase vibrations of the neighboring carbon atoms parallel to the surface of the cylinder (tangential modes, band).
In this work we will pay our main attention to the effect of hydrostatic pressure on the vibrational modes of the (10,10) SWNT bundle. Our most striking finding is a RBM-like mode in the collapsed bundle after the SPT, which is also Raman active and could be considered as a fingerprint of the SPT happened in the SWNT bundle, and further used to accurately measure structure of the bundle after the SPT.
Our theoretical calculations were performed using the density-functional theory in the local-density approximation (LDA) [19], in which the highly accurate projected augmented wave (PAW) method [20] was used. The maximum spacing between K points is 0.03 Å-1 and the Gaussian smearing width is 0.04 eV. The geometrical structures of the SWNT bundle before and after the SPT are optimized by the first-principle method at 0, 0.45, 2.8 and 5 GPa, and in the final geometry no forces on the atoms exceed 0.001 eV/Å. The Raman intensity was calculated by combining above first-principles results with the empirical bond polarizability model [21].
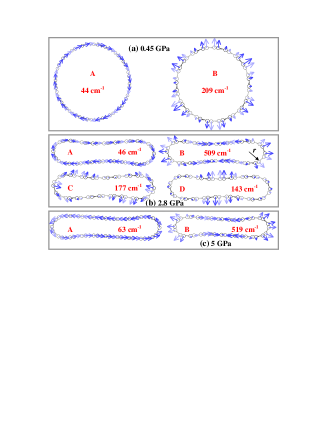
The optimized structures of a (10, 10) SWNT bundle under different pressures are shown in Figs. 1(a)-1(c). As the hydrostatic pressure increases, the tube surface deformation energy increases, and the intertube distance decreases, increasing the van der Waals (vdW) energy. When the pressure increases up to a critical value, it becomes energetically favorable to reduce the tube’s inner volume, rather than simply reduce the intertube distance, making thus the system undergo a SPT and the tube spontaneously collapses to form a peanut-like cross-section, which is consistent with the recent molecular dynamics simulations [14] and continuum model analysis [11]. Such a kind of structural change should exhibit some important characters in the vibrational properties.
To investigate the systematic vibrational properties, the nonresonant Raman spectra of SWNT bundle under different pressures are firstly calculated and plotted in Fig. 2. It can be found from Fig. 2 that more peaks emerge in both the low- and high-frequency regions after the SPT, i.e., the whole Raman spectra distribute wider after the SPT. This should be attributed to the symmetry-breaking and the split of phonon bands. The high frequency part in the Raman spectra of the bundle before the SPT are almost the same, and the same holds for those after the SPT. This means the sudden change of structure occurs only at the SPT pressure. Most importantly, the original RBM of the bundle disappears from the spectra after the SPT, which is consistent with the experimental results [5,6].
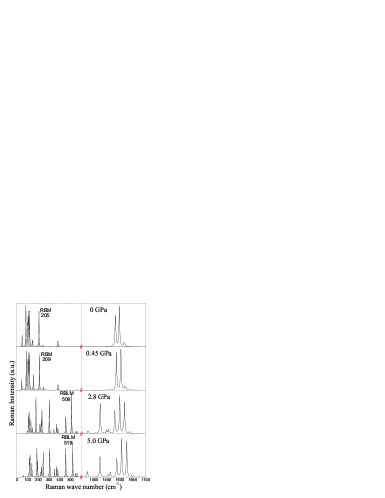
In all the structures, the Raman frequencies increase when external pressure increases. We calculate the pressure dependence and summarize them in Table I, in which the experimental data taken from Ref. 5 are also presented. From Table I, we can find that although first-principle calculation overestimates the Raman frequency systematically, it can reproduce most of the experimental dependence of the Raman frequency on hydrostatic pressure. So we can use the first-principle results to further investigate in detail the vibration modes of (10, 10) bundle under hydrostatic pressure.
| Structure | RBM | Band | ||||||
|---|---|---|---|---|---|---|---|---|
| region | ||||||||
| Before | 1566 | 6.1 | 1583 | 9.3 | ||||
| SPT | 181 | 10.1 | 205 | 9.0 | 1571 | 11.0 | 1598 | 13.0 |
| 1591 | 10.1 | 1615 | 9.3 | |||||
| After | 0.7 | 1.6 | ||||||
| SPT | 5.9 | 6.2 | ||||||
| 5.8 | 3.9 | |||||||
Because of the complexity of the vibrational modes, here we only pay main attention to some characteristic vibrational modes in low frequency region. We show the rotational mode (A), and the RBM or RBM-like mode (B) of the SWNT bundle at 0.45, 2.8 and 5 GPa in Figs. 1(a)-1(c) respectively. Firstly, in Fig. 1(a) one may notice that the tube’s cross-section is not a perfect circle now. This is because the rotational symmetry of the (10,10) tube is incompatible with the hexagonal lattice symmetry, making the tube’s cross-section deformed slightly. Secondly, the atomic motions in the rotational mode (A) before and after the SPT are always almost along the tube surface, but its frequency can not remain zero because of the non-circular cross-section and the tube-tube interaction. This mode is an IR active, making it observed possibly in IR spectra.
On the other hand, because of the hexagonal symmetry of the unit cell in the bundle, the atomic motions in the RBM are not the same for every atom, as seen from Fig. 1(a), exhibiting approximately the hexagonal symmetry too, which means that the RBM frequency in the SWNT bundle will not be the same as that in the isolated SWNT.
A special attention should be paid to the mode (B) of 509 cm-1 at 2.8 GPa after the SPT in Fig. 1(b), in which most of the atomic motions on the two ends are perpendicular to the tube surface, showing in-phase vibrations, and the motions of the atoms in the flat region are along the tube surface. This mode also exists at 5 GPa, as shown in Fig. 1(c), which so can be regarded as a RBM-like mode appearing only in the bundle after the SPT. In fact, the previous researcher also found a similar mode in a capped SWNT [22], which comes from a mixing of the RBM of the hemisphere and the tangential mode of capped SWNT. Because most of the atomic motions in the mode are in-phase, this RBM-like mode have a large Raman intensity as shown in Fig. 2, making it can be found experimentally in the Raman spectra of the bundle after the SPT.
It is well known that the RBM frequency is inversely proportional to tube diameter, expressed by the formula of , where is a constant. To examine further the RBM-like behavior of the mode in Fig. 1(b), we have measured the radius of the circular end in Fig. 1(b), which is Å. After taking nm/cm-1 from Ref. [5], which was also obtained by the first-principle method, one can obtain cm-1. This value is very close to our first-principle result (509 cm-1), and a difference of several cm-1 comes from the tube-tube interactions. In order to make a more accurate comparison between them, we directly take one isolated tube from the collapsed bundle at 2.8 GPa, and then calculate the frequency of its RBM-like mode, which is found to be 501 cm-1. Thus, a very good agreement between the normal mode frequency of the isolated tube and the RBM of an equivalent SWNT composed of the circular ends of a collapsed tube in the bundle has been obtained, indicating the normal mode (B) in Fig. 1(b) can indeed be considered as a RBM-like mode of the tube bundle after the SPT. It is valuable to mention that appearance of this RBM-like mode indicates an existence of the two circular ends in the bundle after the SPT, which furthermore can be regarded as a fingerprint-type mark of the SPT. More importantly, the frequency of this RBM-like mode is only determined by the radii of the two circular ends, and so is mainly influenced by the external pressure, but not the radius of the original tube. As shown in Fig. 1(c), when external pressure increases to 5 GPa, the frequency of the RBM-like mode is changed to 519 cm-1. So this mode can also be used to determine experimentally the microscopic structure of the bundle after the SPT, no matter what kind of SWNT bundle is used originally.
Another interesting Raman-active normal mode (C) in Fig. 1(b) is a quadrupole vibration mode, which often has a strong intensity in the Raman spectra of clusters, and the lowest Raman active mode of the SWNT is also a quadrupole mode. The similitude between these modes may indicate that the mode (C) origins from the lowest Raman active mode of the SWNT. In other words, the -like modes of the two circular ends would combine together to give the mode (C) in Fig. 1(b), which could be identified by the following argument. We know that the lowest Raman active mode of SWNT is inversely proportional to the squared tube diameter, i.e., [23]. Taking Å, its mode frequency will become cm-1, where the radius of (10, 10) tube is equal to Å, and 17 cm-1 is the mode frequency of the isolated (10, 10) SWNT. After considering the up-shift of the frequency induced by the intertube interaction, this value is compatible with the mode frequency of 177 cm-1 given in Fig. 1(b). So, we think this mode can also be observed in future Raman experiments.
Next, the mode (D) of 143 cm-1 in Fig. 1(b) is mainly contributed by the out-phase motion of nearby flat walls, which can be regarded as the mode of the graphite with its frequency of 127 cm-1. But now due to pressure effect, its frequency increases to 143 cm-1. When pressure increases up to 5 GPa, the frequency of this mode further increases to 193 cm-1.
In conclusion, using the first principles calculations we have studied in detail the vibrational modes of the (10, 10) SWNT bundle under hydrostatic pressure, which are found to be very different from those without the applied pressure, especially after the SPT. Several important results are obtained, e.g., disappearance of the original RBM, and appearance of a RBM-like mode and a quadrupole vibrational mode after the SPT. All the modes can be considered as a fingerprint of happening of the SPT, and used to measure accurately the microscopic structure of the bundle after the SPT in future experiment. On the other hand, the characters mentioned above have a close relationship with the peanut-like cross-section, and so our results show that Raman spectra can be used to verify the prediction of the foregone researches [11, 14].
Acknowledgments: The authors acknowledge support from the Natural Science Foundation of China under Grant No. 10474035 and No. A040108, and also support from a Grant for State Key Program of China through Grant No. 2004CB619004.
References
- (1) S. Iijima, Nature (London) 354, 56 (1991).
- (2) M.S. Dresselhaus, G. Dresselhaus, and Ph. Avouris, Carbon Nanotubes: Synthesis, Structure, Properties and Applications, Vol. 80 of Springer Series in Topics in Applied Physics (Springer-Verlag, Berlin, 2001).
- (3) Liu Yang and Jie Han, Phys. Rev. Lett. 85, 154 (2000).
- (4) U.D. Venkateswaran, A.M. Rao, E. Richter, M. Menon, A. Rinzler, R.E. Smalley, and P.C. Eklund, Phys. Rev. B 59, 10928 (1999).
- (5) M. J. Peters, L.E. McNeil, Jian Ping Lu, and Daniel Kahn, Phys. Rev. B 61, 5939 (2000).
- (6) C. Thomsen, S. Reich, A.R. Goni, H. Jantoljak, P.M. Rafailov, I. Loa, K. Syassen, C. Journet, P. Bernier, Phys. Status Solidi B 215, 435 (1999).
- (7) C. Thomsen, S. Reich, H. Jantoljak, I. Loa, K. Syassen, M. Burghard, G.S. Duesberg, and S. Roth, Appl. Phys. A 69, 309 (1999).
- (8) J. Tang, L.-C. Qin, T. Sasaki, M. Yudasaka, A. Matsushita, and S. Iijima, Phys. Rev. Lett. 85, 1887 (2000).
- (9) S. Kazaoui, N. Minami, H. Yamawaki, K. Aoki, H. Kataura, and Y. Achiba, Phys. Rev. B 62, 1643 (2000).
- (10) S. Reich, H. Jantoljak, and C. Thomsen, Phys. Rev. B 61, R13389 (2000).
- (11) M.H.F. Sluiter, and Y. Kawazoe, Phys. Rev. B 69, 224111 (2004).
- (12) D. Kahn, and J. P. Lu, Phys. Rev. B 60, 6535 (1999).
- (13) J. Sandler, M.S.P. Shaffer, A. H. Windle, M.A. Montes-Moran, C.A. Cooper, R.J. Young, and M.P. Halsall, Phys. Rev. B 67, 035417 (2003).
- (14) J.A. Elliott, J.K.W. Sandler, A.H. Windle, R.J. Young, and M.S.P. Shaffer, Phys. Rev. Lett. 92, 095501 (2004).
- (15) I. Loa, J. Raman Spectrosc. 34, 611 (2003).
- (16) A. M. Rao, E. Richter, S.Bandow, B. Chase, P. C. Eklund, K. A. Williams, S. Fang, K. R. Subbaswamy, M. Menon, A. Thess, R. E. Smalley, G. Dresselhaus, and M. S. Dresselhaus, Science 275, 187 (1997).
- (17) C. Journet, W.K. Maser, P. Brenier, A. Loiseau, M. Lamy de la Chapelle, S. Lefrant, P. Deniard, R. Lee, and J.E. Fischer, Nature (London) 388, 756 (1997).
- (18) J.M. Holden, Ping Zhou, Xiang-Xin Bi, P.C. Eklund, Shunji Bandow, R.A. Jishi, K. Das Chowdhury, G. Dresselhaus, and M.S. Dresselhaus, Chem. Phys. Lett. 220, 186 (1994).
- (19) G. Kresse and J. Hafner, Phys. Rev. B 47, R558 (1993); ibid. 49, 14251 (1994); G. Kresse and J. Furthmuller, Comput. Mater. Sci. 6, 15 (1996).
- (20) P.E. Blöchl, Phys. Rev. B 50, 17953 (1994); G. Kresse and D. Joubert, ibid. 59, 1758 (1999).
- (21) R. Saito, T. Takeya, T. Kimura, G. Dresselhaus, and M.S. Dresselhaus, Phys. Rev. B 57, 4145 (1998); S. Guha, J. Menendez, J.B. Page, and G.B. Adams, Phys. Rev. B 53, 13106 (1996); Gang Wu, Jian Zhou and Jinming Dong, Phys. Rev. B 72, 115411 (2005).
- (22) L. Vitali, M. Burghard, M. A. Schneider, L. Liu, S.Y. Wu, C. S. Jayanthi, and K. Kern, Phys. Rev. Lett. 93, 136103 (2004).
- (23) R. Saito, T. Takeya, T. Kimura, G. Dresselhaus, and M. S. Dresselhaus, Phys. Rev. B 59, 2388 (1999).